
Abstract
Abstract
While many federal agencies are undertaking environmental justice-related activities to respond to Executive Order 12898 issued by President Clinton in 1994: “Federal Actions to Address Environmental Justice in Minority Populations and Low-Income Populations,” there is a lack of guidance on how to assess disproportionate human health or environmental effects of agency programs, policies, and actions on minority and low-income populations. Meanwhile, many state governments are now developing their own strategies for identifying disproportionate environmental health impacts and addressing environmental justice concerns. The purpose of this study is to review the diversity of state-level approaches and methodologies for conducting disproportionate environmental health impact evaluations as part of their environmental justice programs and initiatives. We found state approaches to these assessments, often called “environmental justice analyses” range from simple qualitative evaluations of demographic indicators, such as race and income, to complex quantitative analyses of environmental health hazards such as statistical modeling across populations and geographic regions. In spite of the progress many states have made to develop methods for disproportionate environmental health impact assessment, several challenges remain such as linking these evaluation approaches to health risks so as to be useful in regulatory decision making, greater quantity and variety of robust data sets at the proper spatial resolution, increased funding to implement programs over the long-term, and collaboration among relevant governmental agencies at all levels.
Introduction
As a federal agency, EPA pursues the goal of environmental justice (EJ) across each of its programs at the directive of Executive Order 12898 issued by President Clinton in 1994: “Federal Actions to Address Environmental Justice in Minority Populations and Low-Income Populations.” The Executive Order directs each federal agency to develop strategies to
• Identify and address to the extent practicable disproportionately high and adverse human health or environmental effects of agency programs, policies, and actions on minority and low-income populations. • Promote enforcement of all health and environmental statutes in areas with minority populations and low-income populations. • Ensure greater public participation. • Improve research and data collection relating to the health of, and environment of, minority populations and low-income populations. • Identify differential patterns of consumption of natural resources among minority populations and low-income populations.
Many federal agencies are undertaking environmental justice-related activities to respond to this Executive Order. However, there is a lack of guidance on perhaps the most critical directive of this order: to assess disproportionate human health or environmental effects of agency programs, policies, and actions on minority and low-income populations. While there is no one single definition for disproportionate effects or impacts, disproportionality does suggest that the magnitude of the outcome of interest is higher than, more than, or different in a negative context from a comparison group or what is expected to occur. If the outcome is a positive attribute like health benefits or cleaner environment from a policy, then the community/population showing disproportionate impact would show less of the outcome. Such a condition would pose an environmental justice concern.
In spite of the lack of guidance, many state governments are now developing their own strategies for identifying disproportionate environmental health impacts and addressing environmental justice concerns. The purpose of this study is to review the diversity of state-level approaches and methodologies for conducting disproportionate environmental health impact evaluations. Knowledge of current approaches used by state agencies would be informative for EPA as it develops its own technical guidance on addressing EJ concerns in the analyses that support regulatory decision making, as companion to EPA's relatively new EJ in rulemaking process guide (U.S. EPA, 2010). Information on state evaluation approaches also sheds light on state agency capacity to analyze the impact of their EJ programs.
Methods
In surveying the state-level approaches, we primarily reviewed methodologies that were characterized by their state sponsors as “environmental justice analyses,” since environmental justice analyses and disproportionate environmental health impact evaluations are related and the terms are sometimes used interchangeably. For this study we define “populations/communities with disproportionate impacts” as being exposed to environmental health hazards to a significantly greater degree than other comparable populations/communities. In addition we use the term “populations/communities with potential for disproportionate impacts” to indicate population groups or communities having high susceptibility3 or high vulnerability4 to disproportionate environmental health impacts.
We first reviewed the report by the University of California Hastings College of Law and the American Bar Association entitled Environmental Justice for All: A Fifty State Survey of Legislation, Policies and Cases (2010). This report compiles 300 environmental justice initiatives undertaken by states, and includes historical as well as current initiatives. We used this report to identify states and programs that might have developed disproportionate environmental health impact evaluation methodologies. In order to do this, we first selected a subset of initiatives that appeared likely or possibly to be relevant for further investigation. For those initiatives, we conducted a literature review of publicly available reports and other documentation, interviewed state and agency representatives through phone calls and/or e-mails, and searched websites for more information. Our goal was to compile information on the following characteristics of each program:
• Definition of environmental justice and/or disproportionate environmental health impacts used by the state • Status of the environmental justice or disproportionate impact policy (e.g., recommendation, mandate) • Purpose of the program or initiative • Types of data collected (e.g., census information, public health records, monitoring data) • Strategies used for collecting the data (e.g., historical knowledge, surveys, national databases)
As we reviewed the initiatives, we categorized them according to (1) the general approach, (2) the type of indicators, and (3) the analysis methods.
Results and Discussion
We identified 23 states with 36 specific methodologies to evaluate disproportionate environmental health impacts associated with their EJ initiatives and programs. Shown in Table 1 are the number of state EJ initiatives described in the Hastings Report, additional state EJ initiatives identified through other sources (web searches, literature searches, and contact with state agencies) and related disproportionate environmental health impact evaluation (aka “environmental justice analysis”) methodologies.
The approaches we found under the heading of “environmental justice analysis” ranged from simple qualitative evaluations of demographic indicators, such as race and income, to complex quantitative analyses of environmental health hazards such as statistical modeling across populations and geographic regions. These disproportionate impacts evaluation methods were associated with EJ initiatives that had varying purposes, e.g., to support specific state decisions such as transportation planning or permit reviews, or to develop a broad conceptual framework which could be applied to identify disproportionate or cumulative impacts of any environmental hazard. However, the main purpose of most state methods was to identify “EJ communities” located in specific areas, usually based on demographic info—although sometimes analyses included environmental hazard information. Once these “EJ communities” are identified, they may be targeted by the state agency for more public outreach and enhanced community participation efforts, and/or for heightened scrutiny such as enforcement actions against the local polluters.
The approaches we found can be categorized in a variety of ways. One categorization that we found useful pertains to the general configuration of the analysis, which in turn was driven by its goals. For example, one category of approach starts with an exposure or health risk assessment of the impact of one or more hazards and/or one or more pollutants. This is followed by a demographic analysis of the affected population to determine if any population group is disproportionately affected. We refer to this as a hazard-based approach. It may be used as part of a new facility permitting process or to supplement a National Environmental Protection Act (NEPA) review for a new facility or major construction project. Although the exposure and health risk assessment procedures are often applied to a single hazard or pollutant at a time, they can be and have been used to address multiple hazards (aggregate impact) and multiple pollutants (cumulative impact).
A contrasting approach starts by profiling a community with respect to demographics, community resources, and/or the presence of one or more environmental hazards/pollutants to determine whether the community is currently disproportionately impacted, is highly vulnerable to being disproportionately impacted, or has a highly susceptible population. If so, it may be given special consideration with respect to any proposed new environmental hazards, especially in terms of participation in decision making. We refer to this as a community-based approach.
Our review found the community-based approach was more commonly used by states than the hazard-based approach (see Table 2). The community-based approach is often limited to a demographic analysis only (e.g., racial/ethnic and income composition), which requires fewer resources than a quantitative exposure or health risk assessment. This limited community-based approach is used to imply vulnerability of a community to disproportionate environmental health impacts. Although it is not always stated explicitly, the implied connection to vulnerability is likely based on historical evidence of actual disproportionate environmental health impacts among minority and low-income communities.
For population susceptibility indicators, •=Race/income data only;  =Vulnerability factors assessed in addition to race/income;
Evaluation of disproportionate environmental health impacts requires comparison of communities or populations, which in turn requires quantifying environmental health hazards in some meaningful way. In principle both the hazard-based and community-based approaches could include quantitative estimates of environmental health hazards. However, our review found that quantitative estimates of hazards were more common with the hazard-based approach.
On the other hand, the community-based approach more often includes consideration of quality of life issues that are not easily quantifiable. For example, the New Mexico Department of Health worked with the Southern Area Health Education Center to create a Community Environmental Health Assessment Tool Box that allows stakeholders to evaluate the environmental health of their small community by considering several factors including quality of life issues (e.g., odors, neighborhood safety, medical care availability), alongside issues of environmental health hazards (NM DOH, 2004).
Within these two general categories, hazard-based and community-based, we found a wide variety of methods that state agencies use to identify “EJ communities” or populations otherwise disproportionately impacted. These methods included accessing community knowledge, using indicators, and strategies to analyze quantitative data.
Accessing community knowledge and citizen complaints
Overall, we found that many states identified disproportionately impacted areas by relying to some degree on local knowledge of existing environmental issues within a community with staff dedicated to responding to citizens' complaints about environmental issues (e.g., Alabama's Environmental Management Commission, Arizona's Office of Administrative Counsel, Connecticut's Department of Environmental Protection, Illinois EPA's Environmental Justice Complaint Officer, Texas' Commission on Environmental Quality, Environmental Equity Office, West Virginia Department of Environmental Protection's Environmental Advocate).
Complaints filed by the affected community can provide support for identifying a community as disproportionately impacted. However, an important limitation of this reactive approach is the likelihood that many communities with disproportionate environmental health impacts may be overlooked without a more systematic process for identification. And inversely, some communities may be misclassified as disproportionately impacted simply because the number of complaints is disproportionate.
Other states used historical knowledge to identify disproportionately impacted communities, based on the demographics of the community. An example is the District of Columbia Comprehensive Plan (DC, 2006), which specifies a policy to “[a]ddress the over-concentration of industrial uses in the District's lower income communities.” Another example is the Colorado Environmental Performance Partnership Agreement (CEPPA) between the Colorado Department of Public Health and Environment (CDPHE) and EPA. The agreement states, “Because some minority and low-income communities may often be exposed disproportionately to environmental risks, CDPHE works to increase awareness at the staff level on this issue to better protect these communities from adverse public health and environmental impacts” (CDPHE and U.S. EPA, 2008).
Using indicators
Several of the methods used by states to identify disproportionate environmental health impacts involved the use of indicators5 to “assess health status or risk as it relates to our environment.”6 According to the Centers for Disease Control and Prevention, indicators should be well-defined, collected on a regular basis, and reflect established relationships, for example between environmental hazards and public health.
We found that indicators used by states to identify disproportionate environmental health impacts could generally be grouped into the following three categories:
(1) Indicators of hazard (e.g., presence of hazardous waste cleanup sites, contaminated water bodies, and open-dumping sites; number of waste management permits; proximity to major infrastructure; monitored or modeled levels of pollutants in air, water, soil; age of housing); (2) Indicators of health effects (e.g., mortality, birth rate, top causes of morbidity, asthma rates); and (3) Indicators of population susceptibility or vulnerability, i.e., demographic indicators (e.g., presence of children, elderly, people with pre-existing health conditions, and pregnant women; household income; race; poverty; access to health care; educational attainment).
Indicators of hazard (1) and indicators of population susceptibility or vulnerability (3) are the most relevant to this discussion. Although many health effects (2) are related to environmental exposures, the presence of a specific health effect may be the result of any number of factors, and not necessarily related to environmental hazards alone.
Analyzing data
Strategies for analyzing data by the state agencies to identify disproportionate environmental health impacts vary in degree of development from a conceptual framework, through a proposed methodology, to implementation of a methodology.
At the conceptual stage, the state agency identifies the data, context (e.g., hazard-based or community-based), and spatial domain7 requirements for the most appropriate method for identifying disproportionate environmental health impacts, as well as the criteria for disproportionate impact determination (e.g., determination of what is considered “adverse”). At least one state—New York—has developed multiple conceptual frameworks through their Disproportionate Adverse Environmental Impact Assessment Work Group (NYSDEC DAEIA Work Group, 2004). However, none of these frameworks have been implemented.
The more developed state-level methodologies found during our research make use of one or more of three analysis categories that we have identified and define below: 1) demographic threshold analysis (Table 3), 2) community snapshot and indicator analysis, and 3) quantitative ranking analysis. However, there is overlap among these three general categories and the components of a given methodology may cover more than one category.
Case study text boxes (Figures 1–4) are also presented for each of the more complex methodology categories to provide more detailed descriptions of state-level approaches to making disproportionate impact determinations using these methodologies.
Demographic threshold analysis
A common method for identifying communities likely to be vulnerable to disproportionate environmental health impacts is the comparison of a community's demographic profile to a threshold value. For example, many states have established percent minority or percent poverty thresholds in pre-defined geographic areas, that when exceeded, indicate potential areas of concern. The specific thresholds vary from state to state and can include criteria other than minority or income data (see examples in Table 3). Justifications for the selection of demographic thresholds were often not provided.
The results of these threshold approaches can be displayed with interactive maps generated using geographic information system (GIS) technologies, which the states (e.g., the New York Department of Environmental Conservation8) then use to convey information to the public, inform the analysis of disproportionate environmental health impacts, or prioritize resource allocations.
While this basic methodology does not identify or quantify specific disproportionate environmental health impacts on communities, it does provide a simple, cost-effective method whereby the states can utilize readily available data (e.g., U.S. census data) to quantitatively identify areas that are likely to be more vulnerable to experiencing disproportionate environmental health impacts.
Community “snapshot” and indicator analysis
Some states identify potentially disproportionately impacted areas by collecting a variety of indicator data. These indicators are used to create a “snapshot” of the community's environmental and human health baseline which can provide insight into how likely that community may experience disproportionate environmental health impacts. Community snapshots can utilize single or multiple indicators, and often involve some type of mapping component to visualize and identify social and environmental stresses on the community.
The snapshot process is a community-based approach that either examines an entire community to identify disproportionately impacted areas within a community (Roe et al., 2003) or creates community snapshots of multiple communities for comparison (see Figure 1) (OEHHA, 2010a). Comparisons of indicators within and between communities can be either quantitative or qualitative (as proposed by MD CEJSC, 2006). Qualitative comparisons often make use of the mapping component. New York State, for example, has proposed a “burdened area analysis” to identify areas “that house significant and multiple environmental insults” (see Figure 2). These data can then be overlaid with demographic data to better understand where indicators of disproportionate environmental health impacts are concentrated and demographic composition of the exposed populations.
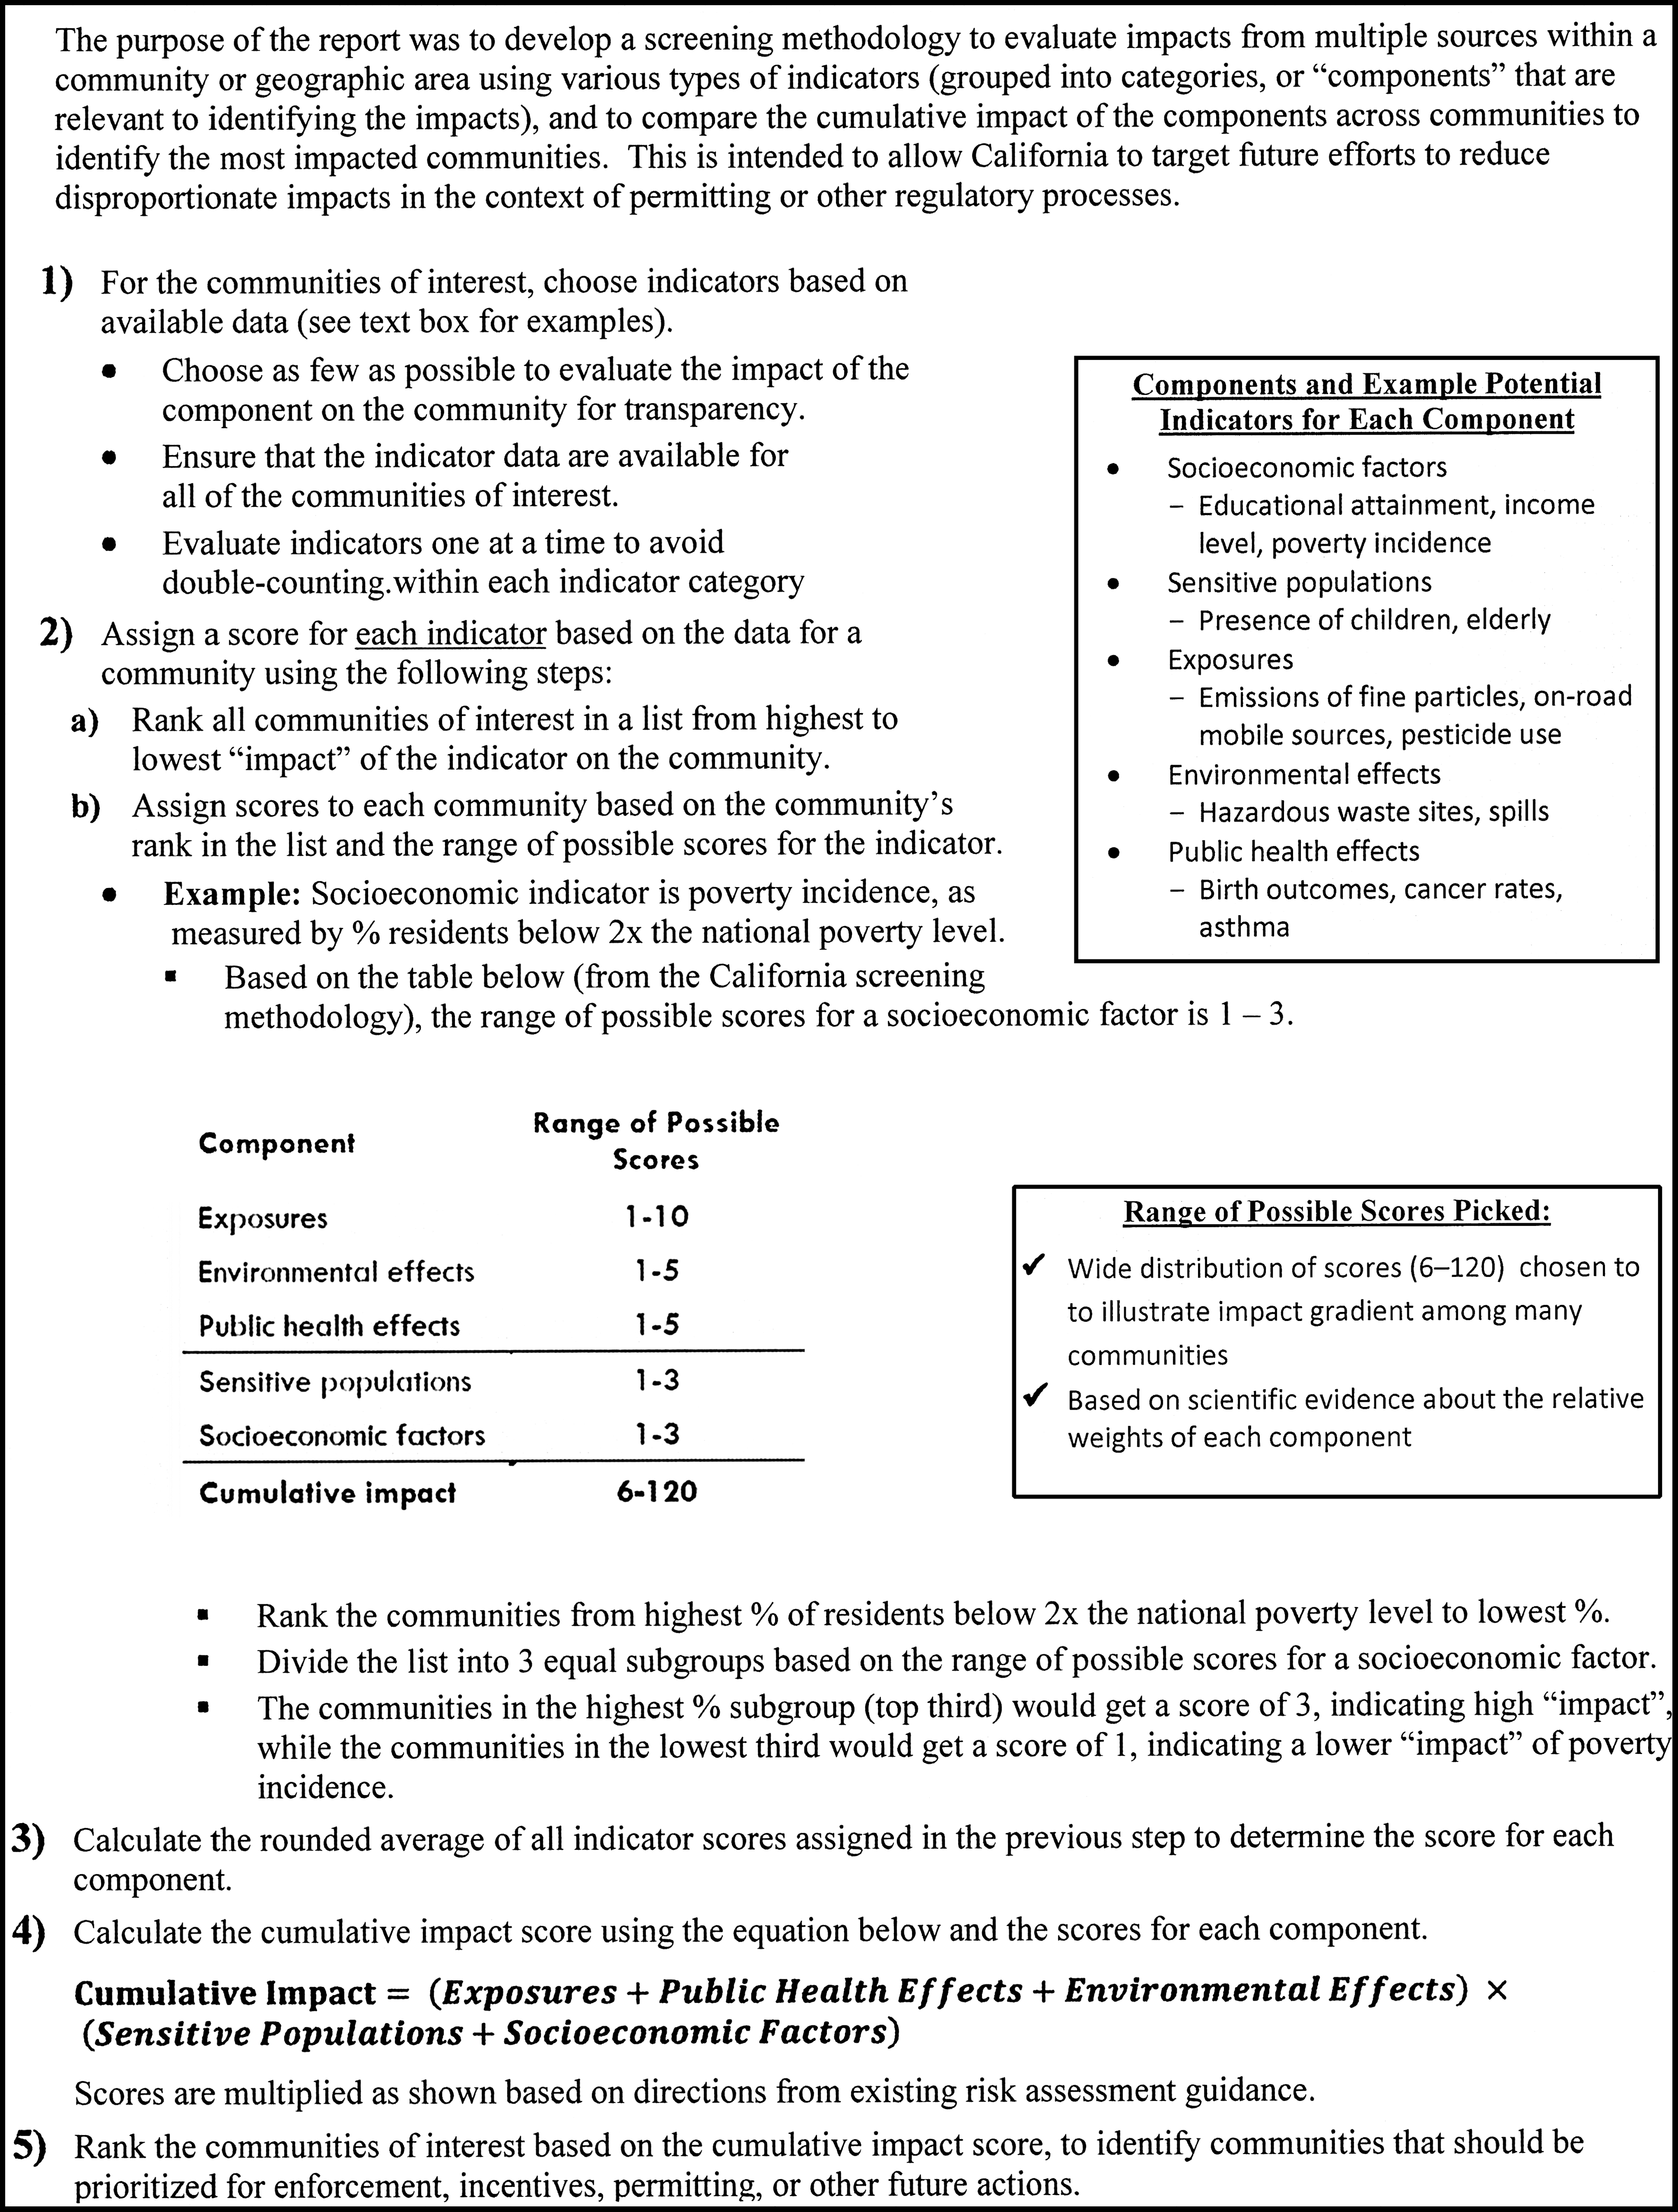
California cumulative impacts assessment methodology (OEHHA, 2010a).
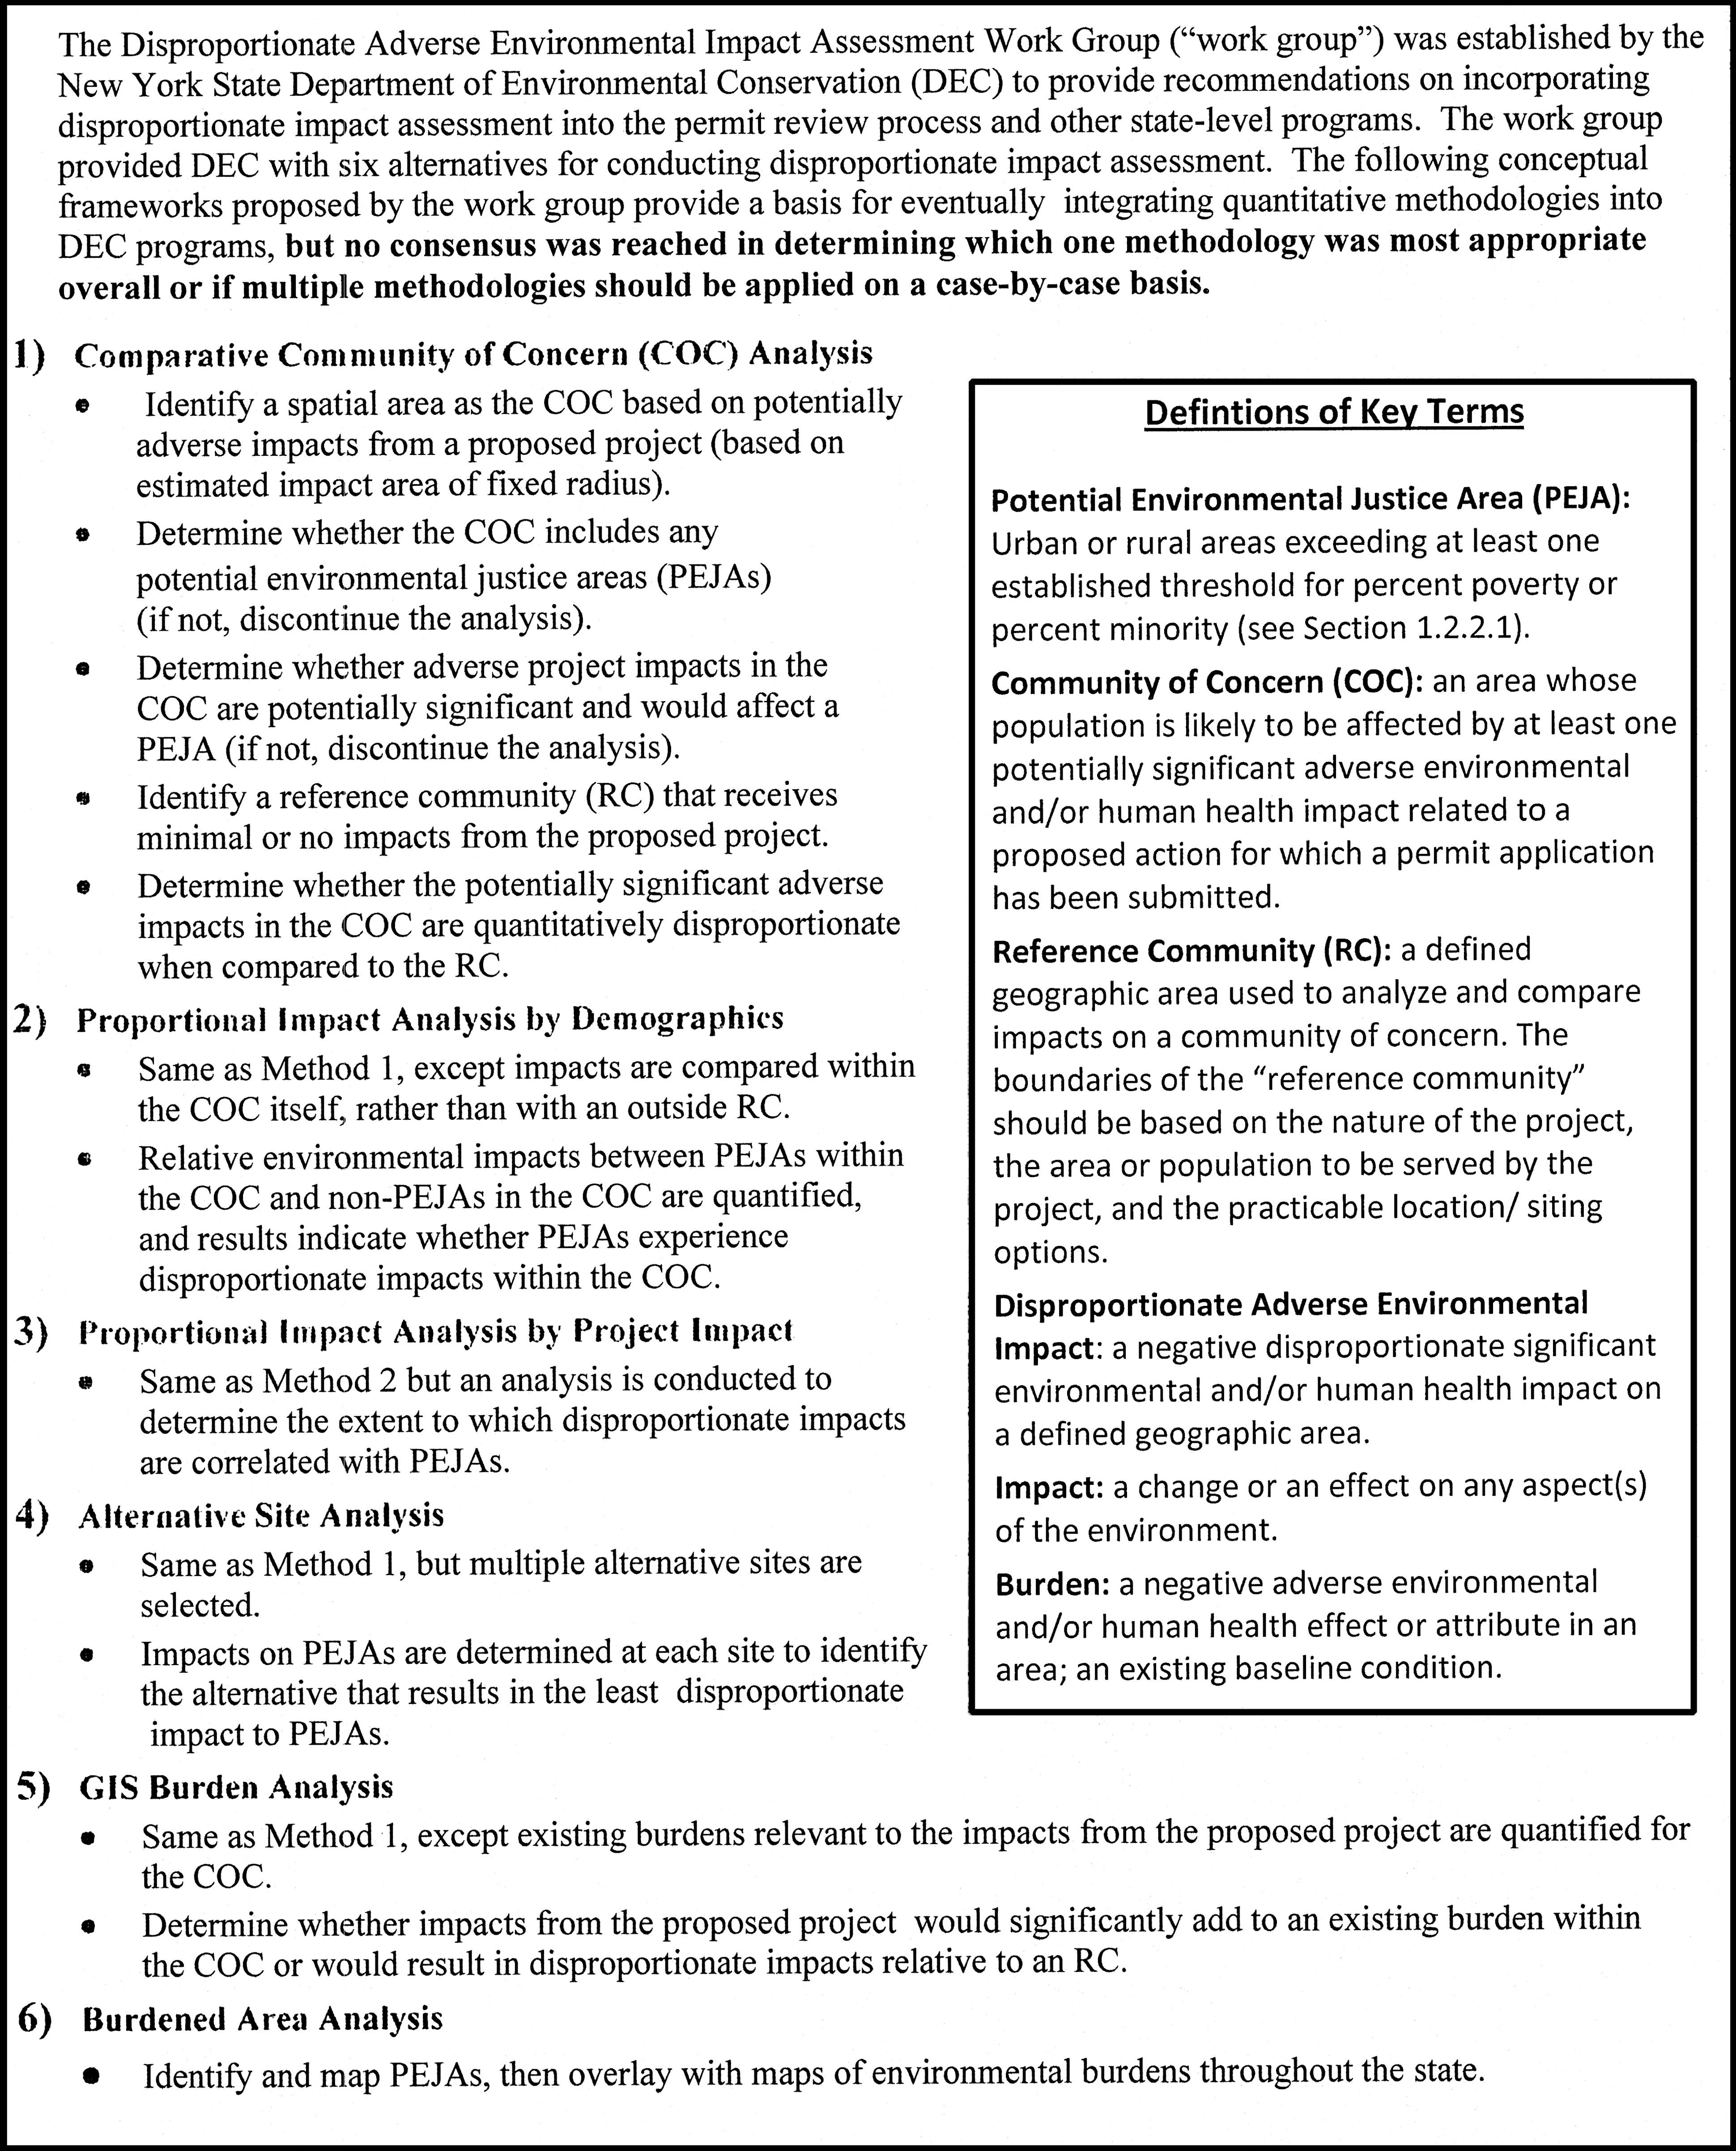
New York conceptual frameworks for conducting disproportionate adverse environmental impact assessment (NYSDEC DAEIA Work Group, 2004).
A community snapshot can also be used to educate the community and policymakers on current issues that impact the community, and can provide a comprehensive document that integrates multiple information sources and reports (Roe et al., 2003).
Quantitative ranking analysis
Some states, such as California, Massachusetts, and New Jersey (see Figs 1, 3, and 4) (Faber and Krieg, 2005; OEHHA, 2010a; NJDEP EJAC, 2009), collect indicator data for community snapshots to be used in quantitative disproportionate impact analyses. These analyses take the form of rankings based on quantitative data, which are used to identify the most highly impacted areas and communities.
California
The California ranking methodology (see Figure 1) uses multiple indicators of various types to estimate a cumulative environmental health impact index. The index is based on a set of discrete indicators that are grouped into categories: exposure, public health, environmental effects, sensitive populations, and socio-economic factors.
Each community being studied is ranked for each selected indicator and then assigned to a quantiles based on the rankings (e.g., 1, 2, or 3 for tertiles). For each community the quantile scores within each category are averaged to provide a category score. Then the final community score is calculated from the category scores as follows.
That is, the cumulative environmental health impact index is calculated as the sum of the quantile scores of the exposures, public health effects, and environmental effects, with the sum then scaled by the sum of the quintile scores of sensitive populations and socio-economic factors. The consideration of sensitive subpopulations is consistent with the notion that such populations are more susceptible to environmental health hazards, so that a larger impact would be expected. California also cites evidence that socio-economic factors may modify the response to pollutant exposure, and thus result in higher susceptibility.
Note that because the number of quantiles varies by indicator category, the various categories have different weights in the equation. For example, the exposure category has 10 quantiles so the exposure score can range from 1 to 10. The public health and environmental categories have only 5 quantiles each, so their scores range from 1 to 5.
Massachusetts
The purpose of the Massachusetts ranking methodology (see Figure 3) was to determine whether there was a relationship between the number or density of hazardous land uses (e.g., waste disposal sites, industrial facilities, Superfund sites) in a town and the minority or poverty proportion of the town residents. Each town's hazard ranking was determined simply by the number and hazard level of each such facility in the town. The hazard density of each town was also calculated.

Identifying disparities in proximity to environmental hazards in Massachusetts (Faber and Krieg, 2005).
Socio-economic factors were incorporated into the analysis by exploring the relationship between either percent non-white or median household income and the hazard ranking or hazard density ranking. The towns were divided into quartiles according to their socio-economic ranking, and then the hazard ranking or hazard density ranking of each quartile was graphed. No statistical analysis was presented.
New Jersey
The New Jersey ranking methodology (see Figure 4) can also use multiple indicators of various types to estimate a cumulative environmental health impact index. In contrast to the California approach, the New Jersey method results in a continuous index metric.
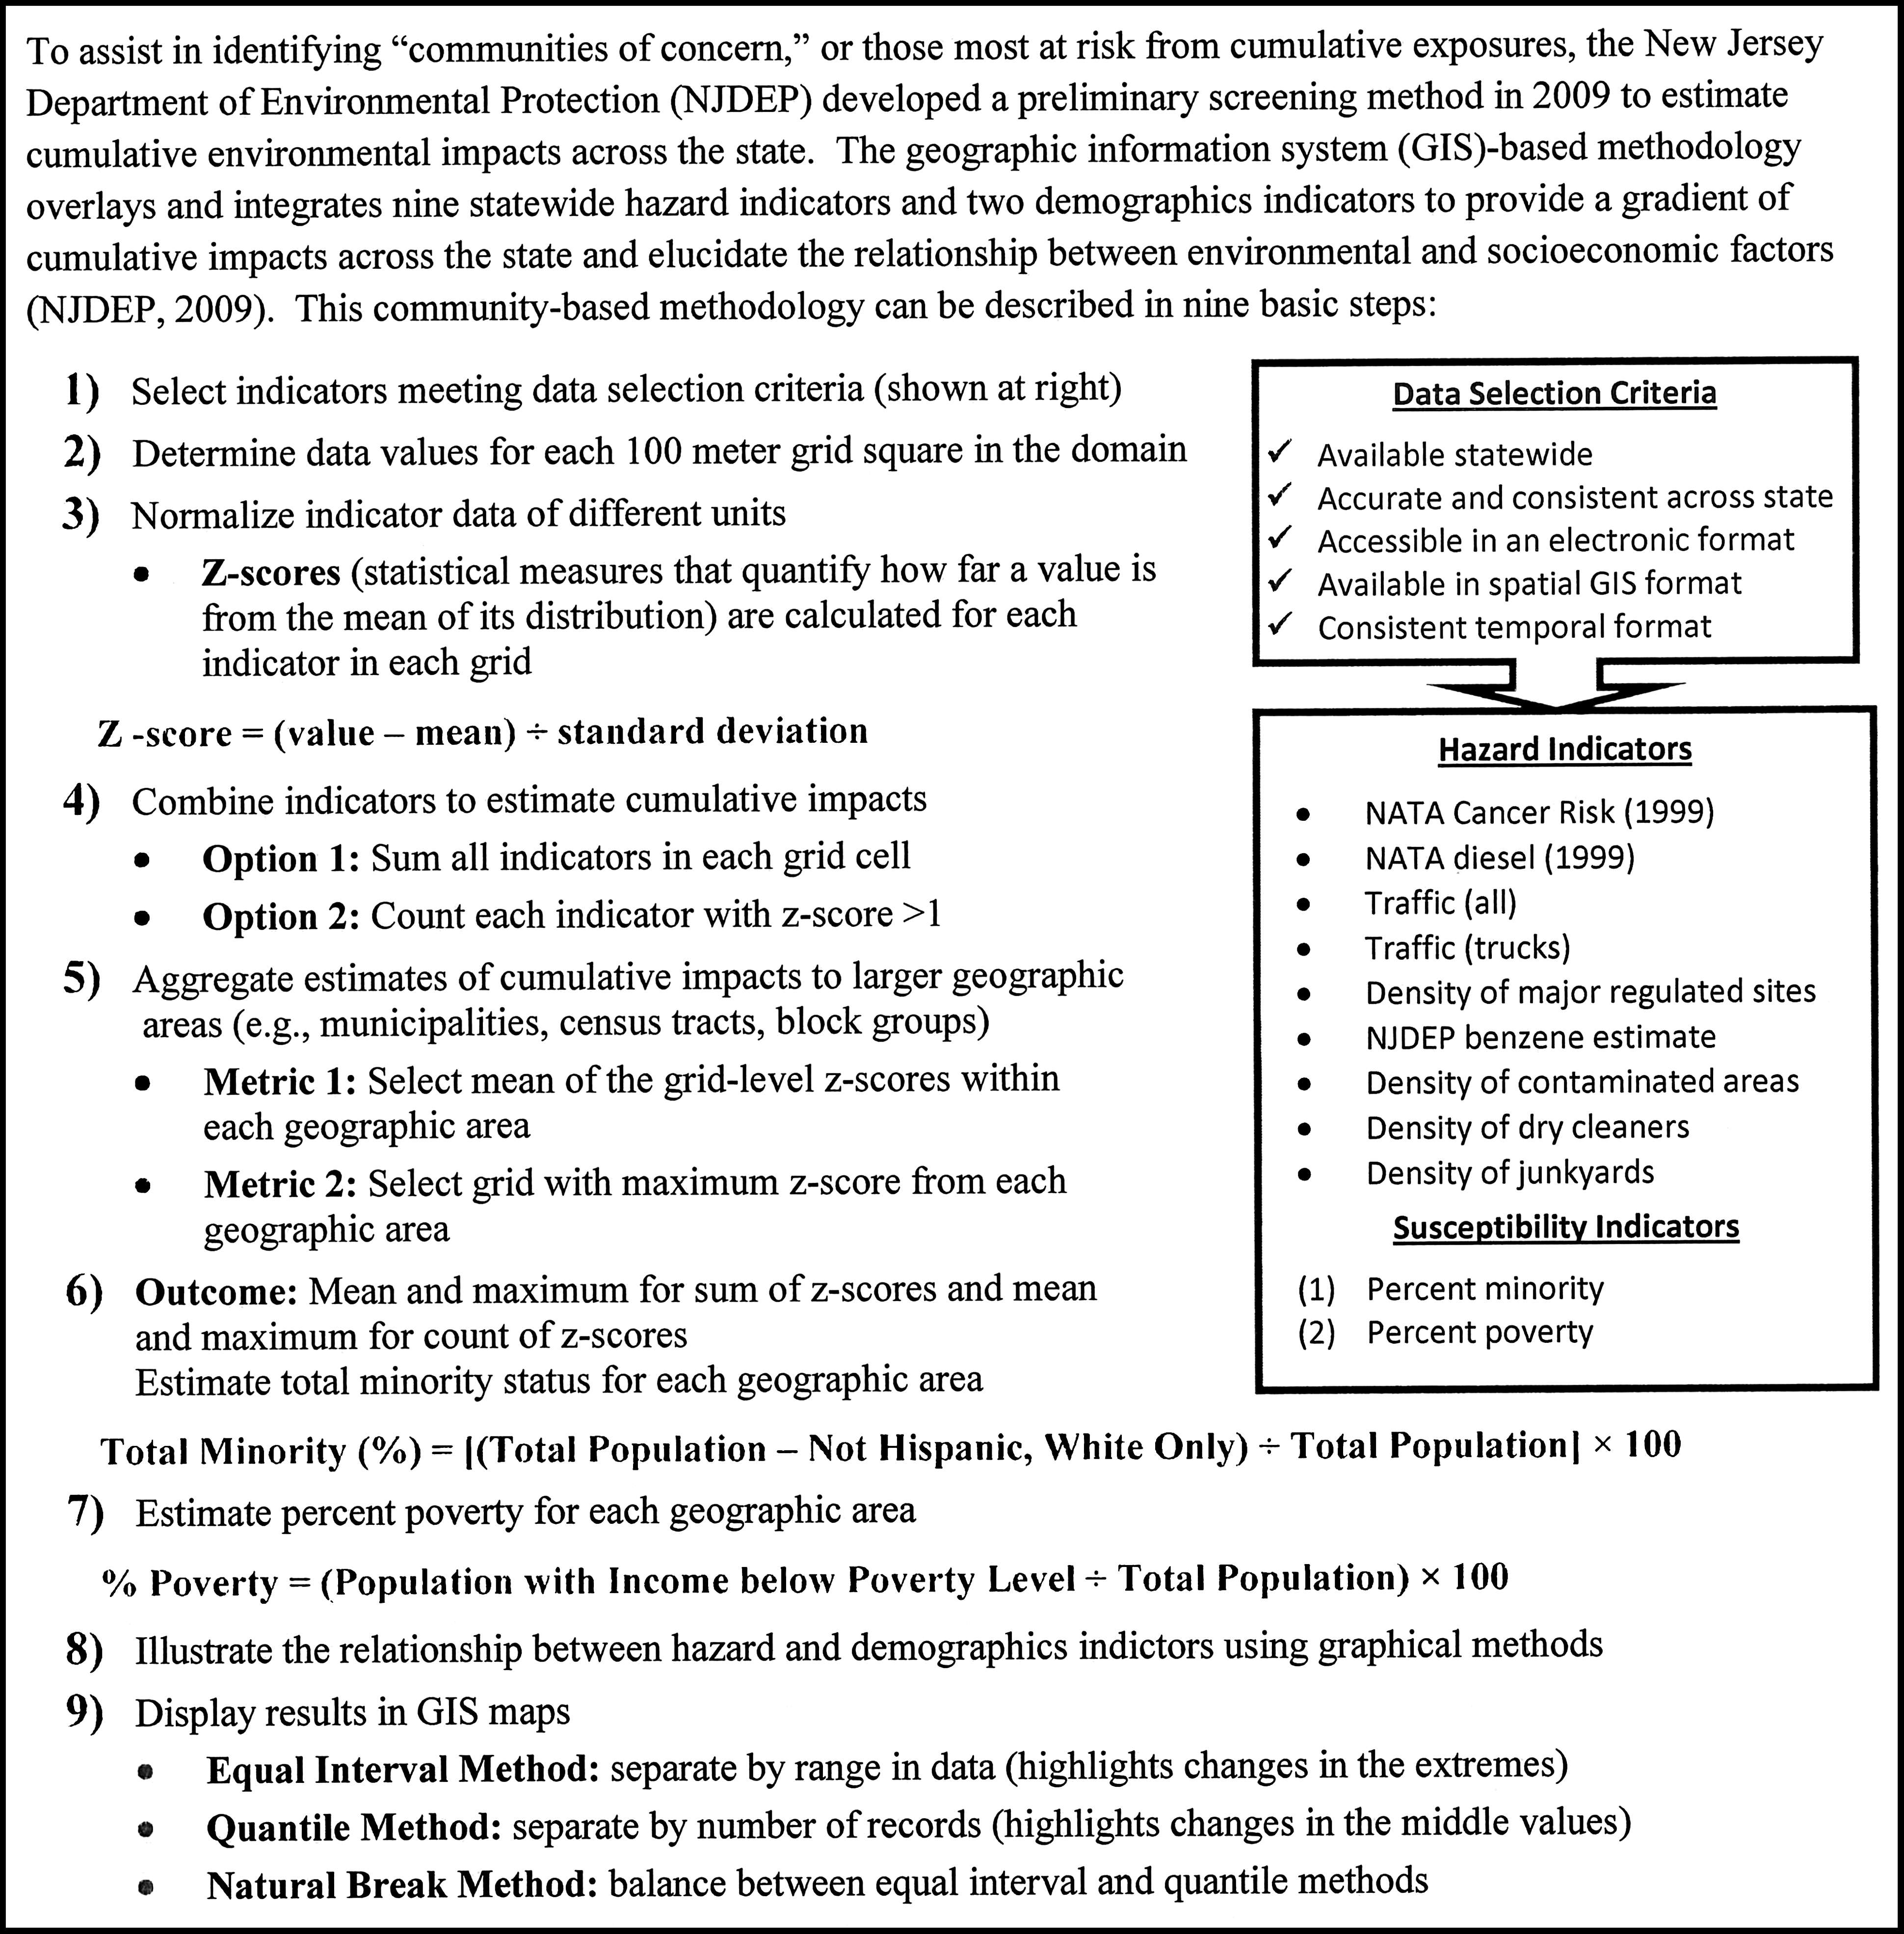
New Jersey Department of Environmental Protection geographic information systems screening methodology (NJDEP EJAC, 2009).
In this case the state is divided into 100 m×100 m grid squares, each of which is assigned a value for each indicator. The indicator values are then ranked by normalizing them to z-scores as follows.
For each grid square, either the z-scores, or the z-scores >1, are summed. The z-score totals are aggregated for larger geographic areas (e.g., census tracts, census block groups), either by averaging or selecting the maximum grid square value. The results are displayed on color-coded maps.
Similar to the Massachusetts approach, considerations of susceptibility are incorporated into the analysis by exploring the relationship between socio-economic factors and the index value. Socio-economic factors are not incorporated into the score. Instead the New Jersey and Massachusetts methods address the question of how the environmental impacts are distributed among socio-economic groups. Each geographic area is ranked according to the socio-economic indicator (percent poverty or percent minority) and divided into deciles. The average index score of each decile is then graphed. No statistical analysis is presented.
Conclusion
For this study we reviewed methodologies used by states to identify disproportionate environmental health impacts. We reviewed reports and other documentation and interviewed state representatives by telephone or e-mail. In doing so we also reviewed methodologies generally characterized by states as “environmental justice analyses” since these are closely related to disproportionate environmental health impact evaluations. We use the term “populations/communities with disproportionate impacts” to refer to populations/communities that are exposed to environmental health hazards to a significantly greater degree than other comparable populations/communities, generally due to proximity to one or more environmental health hazards. We also use the term “populations/communities with potential for disproportionate impacts” to refer to communities that are highly susceptible or vulnerable to environmental health hazards.
We described several types of approaches used by states to identify disproportionate environmental health impacts including threshold analysis, community “snapshot” and indicator analysis and quantitative ranking analysis. We also highlighted some of the more advanced state programs using case studies. More generally we found that the approaches could be categorized as either hazard-based or community-based.
We found that states are at different stages in the development of methodologies for disproportionate impact evaluation, ranging from generating concepts for a methodological framework (see New York case study), through development of a methodology (see California case study), to the implementation of the methodology (see Massachusetts and New Jersey case studies).
In order for disproportionate environmental health methods to be useful in setting environmental standards and regulations, they should meet certain criteria. They should be objective (i.e., replicable), and ideally tied to health outcomes or health risk. Such methods can help target scarce resources to communities and environmental issues where they can do the most good. The operational definition of disproportionate or disparity should be clearly stated. The methods should help demonstrate differences in environmental and/or health conditions between social groups (e.g., the “EJ gap”) so decision makers can evaluate whether the “EJ gap” or differences are increasing or decreasing.
Another desirable trait is transparency so that the process and outcome can be easily explained and understood. This makes it more likely that decision makers will use the methods and that the public will support the decisions on which the methods are based.
Most of the methodologies we encountered are designed to identify vulnerable or susceptible communities, but are not directly linked to identifying disproportionate health outcomes or health risk. For example, the great majority of the methodologies we identified simply used demographic thresholds to define vulnerable communities, but do not document health impacts or health risk.
We identified four examples for case studies that represent the most sophisticated attempts to date to investigate and define disproportionate environmental health impacts, but each has limitations with respect to being incorporated into environmental decision making. New York State has developed several conceptual frameworks that may prove to be useful for identifying and addressing disproportionate impacts, but has not yet developed or implemented specific methodologies.
The California methodology has made progress toward ranking communities relative to one another, but the ranking metrics are not proportional to health risk or health outcomes. This presents a barrier to the development of statistical methods for evaluating whether differences in health risks among communities are both statistically significant and substantial. Also, there is an element of subjectivity in the selection from the diverse set of indicators incorporated into the method and in the variable weighting of different factors. And mixing indicators of different types into a single metric can undermine transparency.
The Massachusetts methodology mixes proximity to solid waste and hazardous waste disposal facilities that generally pose low health risk (U.S. EPA, 2012a, b) with proximity to other types of environmental hazards that pose higher risks, such as Superfund sites and industrial facilities. Combining different indicators whose links to health risk vary in strength creates an aggregated metric that is unlikely to be proportional to health risk without weighting each hazard according to risk.
However, the methodology probably could be implemented easily in other states or nationally for hazardous land uses for which links to adverse health outcomes have been established. If links have been quantified then hazards could be combined into aggregate indices that are approximately proportional to health risk by proper weighting. Although the results are mixed, a recent review of proximity and health studies have found significant relationships between residential proximity to environmental hazards and adverse health outcomes, such as adverse pregnancy outcomes, asthma hospitalizations, stroke mortality, PCB toxicity, end-stage renal disease, and diabetes (Brender et al., 2011). While populations living close to environmental hazards appear more likely to have adverse health outcomes, proximity does not necessarily equate to individual-level exposure (Brender et al., 2011).
The New Jersey methodology comes closest to meeting the criteria of being linked to health risk in the choice of indicators. However, it has some of the same limitations as California's methodology in that the selection from the diverse set of indicators incorporated into the method can introduce some subjectivity. And although the method avoids some of the pitfalls of ranking with respect to proportionality, combining different indicators whose links to health risk vary in strength means that the aggregated metrics may not be proportional to health risk without proper weighting.
One of the most important barriers to development of methods for disproportionate environmental health impact evaluation is a scarcity of appropriate data. Many data and resource needs have been identified by the states to further develop disproportionate environmental health impact analyses. The most common needs include a greater quantity and variety of robust data sets at the proper spatial resolution, increased funding to implement programs over the long-term, and collaboration across agencies. For example, for detection of disproportionate impacts of many environmental hazards, such as air pollution, fine spatial resolution is required in order to detect potential differences that can occur at the level of neighborhoods or census tracts. Data and tools that have been suggested include larger emissions inventories, air quality monitoring networks, modeling software, and pollution inventories expanded to unregulated operations (NY DEC and NY DOH, 2006; NYSDEC DAEIA Work Group, 2004; MPCA, 2008; New Jersey Comparative Risk Project, 2003). Data that are available at the national level must be collected at a fine enough resolution in order to be useful for identifying locations that are highly impacted.
Another limitation to states developing robust methodologies for identifying disproportionate environmental health impacts is lack of funding. Maryland, for example, spent several years developing a community profile tool and environmental justice framework to identify potentially disproportionately impacted areas. But these initiatives were sidelined after 2004 when Maryland Commission on Environmental Justice and Sustainable Communities (MCEJSC) faced funding shortages (personal communication with Lisa Nissley, 2011).
Many states emphasize that collaboration across agencies is necessary to increase the efficiency, effectiveness, and consistency of approaches to identify disproportionately impacted areas and potentially disproportionately impacted areas. While some states have established departments that focus on environmental justice concerns and attempt to implement programs across state agencies, other states have no dedicated staff for these issues and it is not clear what department is responsible for identifying disproportionate impacts.
Identification of communities that are disproportionately impacted or potentially disproportionately impacted by environmental health hazards can help states design policies and programs to mitigate, anticipate, and prevent such impacts, may help establish baselines from which to conduct evaluation of policies and other interventions and better protect public health. U.S. EPA could assist states in improving methodologies by developing spatially resolved national data bases of environmental health impacts similar to National-Scale Air Toxics Assessment (NATA) for other environmental hazards. Additionally, development, testing, and deployment of rigorous qualitative and quantitative methods for assessing cumulative risk and impacts that include non-pollutant stressors are needed. This would facilitate states moving beyond simple demographic thresholds to indicators of exposure and/or health risk and impacts, and thereby allow resources to be targeted more efficiently for protecting public health and allow evaluation of the success of state EJ programs to reduce and prevent environmental health disparities.
Footnotes
Author Disclosure Statement
The authors have no conflicts of interest or financial ties to disclose. The views expressed in this document are solely those of the authors and do not necessarily reflect those of the U.S. Environmental Protection Agency or ICF International.
1
See <http://www.epa.gov/ncer/events/news/2010/03_17_10_calendar.html>.
2
Throughout this manuscript we use the term “disproportionate environmental health impact evaluation” broadly, not limited to the more formal process of health impact assessment.
3
We use the term “susceptible” to refer to population groups at higher risk of suffering an adverse health effect from an environmental hazards, either due to intrinsic factors (e.g., age, sex, genetics), non-intrinsic factors (e.g., chronic medical conditions, lack of health care access, poor nutrition, or fitness), or other concurrent stressors, such as other pollutant exposures. A special case of susceptibility may be due to psycho-social stress as a result of low socio-economic status (Couch and Coles 2011).
4
We use the term “vulnerable” to refer to population groups at higher risk of being exposed to environmental hazards due to lack of physical or social resources.
5
The term “indicators” is used throughout this article, because it is the most common term used by states to refer to a piece of data incorporated in the state methodologies; however, other terms used by states include “factors” or merely “information” or “data,” with further descriptions such as “health outcome data.”
6
CDC Environmental Public Health Indicators Project at <http://www.cdc.gov/nceh/indicators/introduction.htm>; accessed on May 26, 2011.
7
A spatial domain is a geographic area of study. For disproportionate environmental health impact analysis, the size of the domains should be small enough to capture the differences in metrics of interest, i.e., demographic and environmental variables.
8
New York data from the NY Department of Environmental Conservation at <http://www.dec.ny.gov/public/911.html>; accessed on May 26, 2011.