
Abstract
Abstract
Despite increasingly stringent environmental regulations, industrial and transportation emissions continue impact public health. Since vulnerable populations bear a disproportionate burden of environmental risks, spatial differentials in environmental exposure contribute to social disparities in health outcomes. Environmental Justice (EJ) analyses tend to focus either on the location of selected point or nonpoint pollution on a whole territory (the geography of toxic waste sites, atmospheric pollution) or on local disproportionate impacts of multiple exposures (demographics near specific industrial clusters). We lack tools that can identify present spatial environmental inequalities and take into account multiple environmental risks through different media over large territories. To address this gap, this study proposes an original, comprehensive, replicable, and scalable spatial environmental deprivation (SED) index. The SED index is applied in the French context. We validate the robustness and usefulness of the index by confronting its outputs to local mortality rates and verifying that it is a significant predictor of health outcomes. The application of the SED index targets environmental interventions (e.g., facility siting and decontamination prioritization) and policies that seek to reduce spatial and social inequalities.
Introduction
Despite increasingly stringent environmental regulations, industrial and transportation emissions continue to affect public health (e.g., see the ongoing emissions of toxic substance listed in the U.S. Toxic Release Inventory and in the European Pollutant Emissions Register). Environmental justice (EJ) analyses in North America and Europe show that vulnerable populations (particularly low income and minority communities) bear a disproportionate burden of environmental risks. 1 Environmental exposures can contribute to health inequalities through differentials in vulnerability and/or in exposure levels.2,3,4,5 Given the disproportionate exposures consistently observed in the EJ literature, spatial differentials in pollution levels must contribute to social disparities in health outcomes.
Analyses that investigate environmental inequalities tend to focus either on the spatial concentration of specific point or nonpoint pollutions on a whole territory (e.g., the spatial distribution of toxic waste sites or of atmospheric pollution in relation to local socio-demographics) or on the disproportionate impacts of multiple exposures at the local level (e.g., the local health impacts of pollution concentrations near specific industrial clusters or transportation axes). We currently lack generally applicable analytical tools to assess the spatial concentration of multiple environmental risks (e.g., industrial risks, noise, poor housing quality) through multiple media (e.g., air, water, and soil contamination) over large territories. 6 Such a tool would facilitate large scale comprehensive, i.e., multi-risk and multi-media, EJ analyses.
This study proposes a new comprehensive spatial environmental deprivation (SED) index to identify spatial environmental inequalities on a large territorial scale. This original, replicable, and scalable index allows the identification of disproportionate spatial distributions for multiple sources of environmental risks. It is based on the concept of “deprivation,” which refers to an accumulation of environmental risks and is conceptually close to the notion of environmental injustice. The term “deprivation” emerged in Britain in the 1980s in studies of social inequalities and is defined as “a state of observable and demonstrable disadvantage relative to the local community or the wider society or nation to which the individual, family or group belongs.” 7
Many studies have shown the links between social deprivation and environmental exposure. These studies focus on exposures to (and effects of) industrial emissions, atmospheric pollution, and noise, but rarely take into account multiple or cumulative exposures.8,9 Thus, little consideration has been given to the spatial distribution of multiple environmental risk factors, and to the health impacts of exposure to multiple environmental risks.10,11
Environmental disparity indices can assist researchers and policymakers to better identify areas likely to present environmental injustices and to understand the environmental determinants of local health outcomes. 11 This type of information is necessary for EJ analyses, ecological epidemiology studies, and policies designed to strategically target interventions to reduce inequalities.
Caveats of Existing Indicators and SED Principles
Two recent attempts to create environmental justice and environmental deprivation indicators have advanced research in this domain. They suffer several caveats that are addressed by the SED we propose.
First, the U.S. Environmental Protection Agency (EPA) recently drafted an Environmental Justice Strategic Enforcement Assessment Tool (EJSEAT) to systematically identify EJ areas. 12 This index includes a very limited set of environmental indicators (air quality data on toxic carcinogenic and non-carcinogenic substances), health indicators (infant mortality and low birth weight births), the density of regulated polluting facilities, compliance with environmental regulations (inspections at major facilities, violations) and socio-demographic factors (poverty, minority, education, age distribution). An additive score is calculated for each census tract (county data are applied to census tracts for variables where tract-level data is not available). The indicator has the advantage of including environmental, socio-demographic, and health data and of identifying regulated facilities and non-compliance events. However, although it aims for comprehensiveness, it includes a very narrow set of environmental indicators (air pollution only). In addition, by pre-selecting the environmental indicators to be included (based either on undisclosed theoretical considerations or, more likely, on data availability), the index excludes many other potentially important risks (e.g., water quality, indoor environments, etc.). Finally once a local is calculated, end users cannot easily identify where their community “lost” points without going back to the original data.
Second, the Center for Research on Environment Society and Health recently developed more comprehensive indices of multiple environmental deprivation, the MEDIx (multiple environmental deprivation index) and NZ-MEDIx, for the UK and New Zealand. 11 As the EJSEAT, these two indices were constructed using a deductive design, 13 include only a small number of variables (air pollution, climate, ultraviolet (UV) radiations, and green space) and exclude many potentially health-relevant environmental factors (e.g., water pollution, housing quality, noise, a variety of facilities emitting toxic substances). Also as the EJSEAT, they do not allow end users to identify the relative contribution of each factor to the final index score. Therefore, policymakers may know that an area scores high, but do not know why.
We propose an alternative index which remedies some of these shortcomings. The spatial environmental deprivation (SED) index differs from the EJSEAT and MEDIx in three significant ways. First, the SED incorporates a wider set of factors that are deleterious to health including air pollution and populations affected by high air pollution levels, water pollution, housing conditions, radon, noise, and a wider variety of polluting facilities and sites with contaminated soil. Second, it is constructed based on an inductive approach whereby many variables are reduced to a smaller number of latent variables aggregated into an index. 14 Third, the SED reveals the relative contribution of each environmental variable to the overall index. This is an important advantage considering its goal to inform public health and environmental policies. The SED facilitates the targeting of EJ and public health interventions not only toward the geographical areas that present the most health risks, but also toward the factors that contribute to deprivation within each area.
We present the methodology used to construct the SED index and demonstrate its applicability and use with French data. To validate its robustness as a predictor of health outcomes, we examine the correlation between SED index outputs and mortality rates and verify the independent effect of SED on mortality controlling for socioeconomic factors. We conclude by suggesting how the index can be used to target policies aimed at reducing existing inequalities.
SED Index Development Methodology
Spatial deprivation indices for the measurement of economic and social disadvantages were proposed in the 1980s7,15 and have been used to analyze health inequalities.16,17,18 To estimate environmental spatial deprivation, we apply similar principles for exposure to pollution via different environmental media.
The SED index integrates a wide range of environmental variables and identifies the most statistically discriminant ones. Baseline variables will vary based on local environmental monitoring practices and with the geographical level of analysis selected. While we demonstrate the application of the methodology for France at the departmental level, the methodology is replicable where data on local or regional environmental quality and/or risks is collected. The methodology used to develop the SED index includes four steps.
Step 1: Elimination of redundant variables and normalization
First, we collected all available health-relevant environmental data on air and water quality, toxic sites, polluted soils, housing quality, and noise, based on a combination of national and international research findings to identify characteristics of the physical environment that are relevant for health. 19 For air pollution two kinds of variables were used: concentrations of major pollutants and the percentage of each locality's population that lives in urban areas where concentrations exceed World Health Organization (WHO) air-quality standards.
The correlation matrix for these initial environmental variables was analyzed to eliminate redundant information. All pairs of variables with a Pearson correlation coefficient greater than 0.6 were identified and we deleted one of the variables in each of these pairs. 20 To fit with statistical analysis preconditions, we checked the normality of the variables distribution with the Kolmogorov-Smirnov's test. Variables were normalized using Log (X), Log (X+1) (for variables with zero data) or log (X+1/10γ) transformations (where Y represents a constant that depends on the scale of the variable).
Step 2: Variable standardization
All initial variables were standardized (i.e., centered and reduced) to remove the influence of measurement units. Variables were not weighted because the literature on environmental factors of health does not provide sufficient information to determine which types of exposures and cumulated effects have the greatest health effects, and because relative impacts vary based on sub-population's vulnerabilities.
Step 3: Principal component analysis
The principal component analysis (PCA) synthesizes the information contained in multiple variables by constructing new and independent synthetic variables, the principal components. These new variables are linear combinations of some of the initial variables, using a variance maximization criteria. The key advantage of this method is that it considers the relationships between variables, and attributes to each a weight that accounts for the relationships between variables (that is, treating them as coefficients or eigenvectors of the linear combinations). To facilitate the use of this index in a public health context, we chose to construct a single index that maximizes the variance of the first principal component. Successive PCAs were performed and only the significant variables (p<5%) were retained to construct the index.
Step 4: Construction of the SED index
A linear combination of standardized variables with corresponding eigenvectors values were used to form the SED index. Figure 1 presents the formula developed to calculate the index. The statistical analysis was conducted using Stata 11 (<
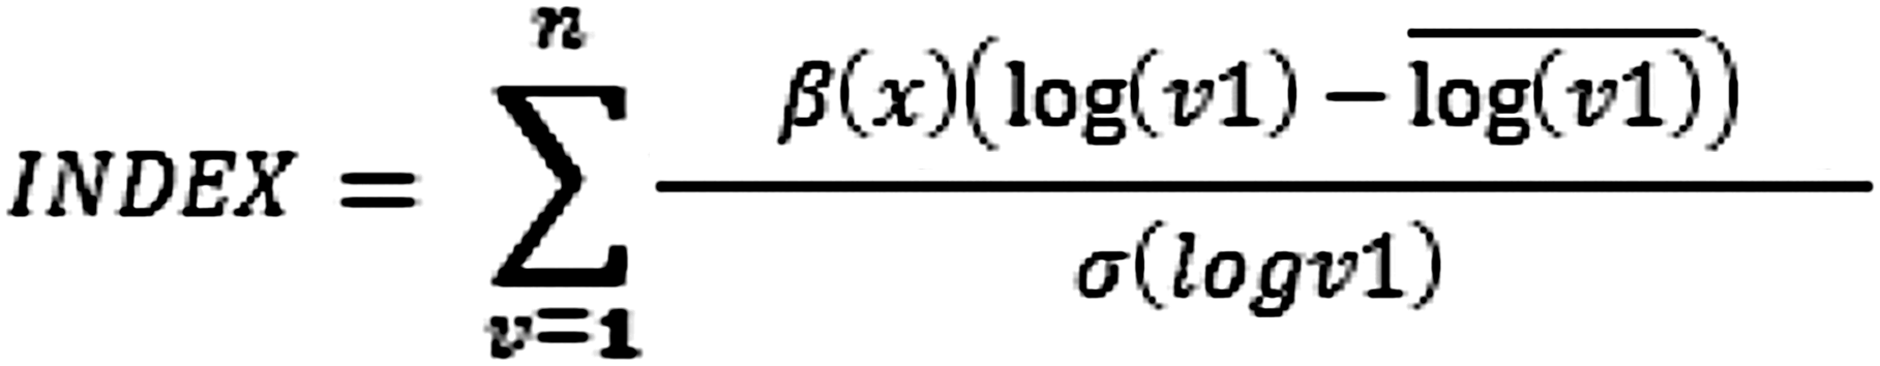
Spatial environmental deprivation index formula. Where β is the eigenvector value for each variable and v is the variable before normalization.
External Validation: The SED Index and Health Outcomes
To verify the reliability of the Spatial Environmental Deprivation index as a predictor of health outcomes, we analyzed the relationship between local SED values and mortality rates using 2008 mortality records. We focussed on all-cause mortality rates, excluding external causes such as accidents. To assess the contribution of environmental deprivation to health outcomes, we verified that this relationship is not driven solely by underlying socio-economic factors. We checked the correlations between socio-economic variables and mortality rates and assessed (via regression analysis) whether SED values have an impact on mortality independent of socio-economic factors.
Application and Results in France
The study area for the application of the SED index is mainland France. We developed the index at the departmental scale (France is divided into 96 departments). The free public-access databases used and our definition of the environment tally with the WHO environmental health definition 21 and the literature on the environmental factors of health. We include data on water quality, air quality, polluted soils, old industrial sites, radon, noise, and characteristics of the local housing stock. Data was collected at various scales and scaled back to the department level.
After variables pertaining to natural risks (e.g., floods) and variables with old, imprecise, or too much missing data were excluded, 63 variables remained and were classified by environmental exposure media: (1) air quality, (2) water quality, (3) industrial and polluted sites, and (4) noise and housing. These databases were consulted between May 3, 2010 and June 28, 2010 and we collected data for year 2008. We also conducted a sensitivity analysis to ensure that the findings are representative of disparities over time. (Using data from 2003 to 2007 did not change the patterns of SED observed.) After eliminating redundant variables (using correlation coefficients of 0.6 as a cutoff point), 27 variables were retained. On these 27 variables, we ran as many PCAs as there were insignificant variables. 14 Thus, 14 variables were finally selected through 13 successive PCAs. These 14 variables represent each exposure medium, and explain significant differences across the French territory. Table 1 presents the 14 variables retained by the principal component analysis to form the SED index, the contribution of each factor to the index (eigenvalues) and data sources.
ICPE sites (Installation Classée Pour la Protection de l'Environnement) are facilities regulated to protect the environment from industrial risks. They entail medium risk levels (<
Seveso sites are facilities regulated because they present high environmental risk levels.
<
The final SED index includes four variables for air quality, one for water quality, five for industrial risks, and four for noise and housing. Eigenvectors (ß) indicate the extent to which each variable is “discriminant,” i.e., its relative contribution to the index. We observed negative eigenvectors for water quality, radon, and percentage of homes built before 1949. Discrimination between these factors thus distinguishes French departments along opposite axes. Table 2 presents descriptive statistics for the SED index.
Using the SED index, we stratified all French departments into five quintiles 22 to map environmental disparities across departments (see Figure 2). Departments with the highest scores correspond to historical and contemporary industrial clusters. For instance the map highlights spatial environmental deprivation in the northern and northeastern older industrial regions, in the Paris region and the Seine Valley between Paris and the Channel, in the Rhone Valley between Lyon and Marseille, as well as in the more recently industrialized regions in the Southwest Atlantic coast and Southeast Mediterranean coast.

Spatial environmental deprivation index in France. The insert represents Paris and its region (the City of Paris is at the center of the insert).
Given the inherent flexibility of the SED construction, we also developed media-specific SED indices to refine our explanation of the total spatial variance in environmental deprivation. We used the same methodology and conducted successive PCAs based on the initial variables for each of the four sub-groups of exposure media: (1) air quality, (2) water quality, (3) industrial and polluted sites, and (4) noise and housing. Some variables that were not significant when we reasoned globally became significant when we assessed by media. Using this more refined approach, a clearer set of gradients emerges across the territory.
Figure 3 presents the maps obtained for these sub-indices and highlights different spatial patterns. For air quality, we observe a spatial distribution similar to the one observed for the overall index, with the exception that Paris proper has worse air quality than its surrounding region. (This was not true for the overall index). Industrial and polluted sites are disproportionately found in the industrial regions mentioned for the overall index, as well as the Atlantic coastal regions. For water quality, the pattern is entirely different due to agricultural runoff largely in some departments.

Environmental deprivation sub-indices in France.
To investigate the reliability of the SED index, we assessed whether it is a good predictor of mortality rates. We found that mortality rates increase with environmental deprivation. Figure 4 shows the strong and significant correlation between mortality rate and SED index for men and women and for different age groups. We present here the relationship for men and women of all ages, and for both genders combined for all ages and for those over 60. The relationship is also significant, although slightly weaker, for other age groups (not represented). The correlation coefficients between SED and mortality rates are highly significant and range from 0.445 for all ages, men and women combined, to 0.27 for men and women combined over age 60.

Association between mortality rate and SED index in France. We excluded one outlier (the City of Paris with high SED but low mortality) because of its specific density and urbanization. The department with the high mortality rate is the “Creuse.
The correlations between mortality rates and each of these socioeconomic variables are all statistically insignificant and under 0.08.
The relationship between the SED and mortality rates holds true even when controlling for socioeconomic factors (proportion of persons with a high school degree or less, proportion of households whose income is below the national median income, unemployment rate, and proportion of workers in industrial occupations). Regressing local mortality rates as a factor of local SED value and socioeconomic variables reveals that the SED is a significant predictor of mortality even when controlling for socioeconomic factors. 23 These results demonstrate the usefulness of this index in capturing environmental factors of health outcomes.
Discussion
In order to facilitate large-scale comprehensive environmental justice analyses, we developed and presented a new SED index. It is based on the concept of deprivation commonly used to create social indicators, 24 accounts for variations in multiple environmental risks and exposure media, and reveals spatial disparities in environmental exposure across spatial units. It also identifies the independent contributions, or deprivation impact, of each environmental factor to local environmental deprivation. 25 We validated the robustness of the SED by comparing SED outputs to local mortality rates (overall and by sex and age). The SED is a strong predictor of local mortality rates, even when controlling for socio-economic factors.
This index can be used and interpreted at the national, regional, and local scales to identify the factors that contribute most to environmental exposure disparities. This feature of the SED facilitates the use of the index for targeting and prioritizing environmental justice and public health interventions (e.g., regulations, siting policies, incentives, funding for cleanups). This approach is reproducible for each environmental media (water, air, toxic sites, and indoor environment). The SED index is thus flexible and can be used for exploratory environmental justice analyses, descriptive spatial epidemiology studies, and to evaluate the effects of environmental health plans and interventions over time.
The index, however, does not investigate the causes underlying the inequalities observed. These mechanisms could include historical patterns of industrial and urban development, land market dynamics, and procedural injustices in the sitting of polluting facilities or infrastructure. Some studies point to unequal exposure by income, race, and immigration status in France, 26 in the United Kingdom 27,28,29 and in the U.S. 1 Other studies noted inequitable enforcement of environmental regulations30,31 and unfair siting procedures for polluting facilities.1,32,33,34 While the socio-political forces that generate environmental inequalities are best investigated through in-depth local-level analyses, the SED index points to geographical areas of cumulated risks where such investigations are most needed.
In addition, the SED does not seek to account for the actual health impacts of environmental risk, but only describes disparities in exposure. Different environmental risks, their accumulation and interactions, generate health impacts which are difficult to ascertain and best investigated using indicators of burden of disease such as years of life lost, years of potential life lost, disability-adjusted life year, or quality-adjusted life year. Nonetheless, the correlations between the SED and local mortality rates and the impact of SED scores on mortality rates even when controlling for socio-economic factors indicate that the SED is a good predictor of cumulative environmental risks.
We envision the application of the SED index to target environmental interventions (e.g., facility siting and decontamination prioritization) and policies that seek to reduce spatial and social inequalities. The media-specific environmental deprivation indices point to potential different mechanisms at play in the generation of environmental risks. The SED can also be used to investigate risk-specific disparities and related health outcomes.
The SED uses a different methodology from the EJSEAT 12 and the MEDIx. 11 It will be interesting to compare the performance of these indices over the same territory. Future research in this domain will also need to investigate where spatial environmental deprivation is accompanied by social, economic, and/or health disadvantages, and the causal mechanisms that lead to these spatial environmental inequalities. The SED index provides a tool to launch a systematic research program in this direction.
Footnotes
Author Disclosure Statement
The authors declare they have no competing financial interests.
1
The concept of environmental justice (EJ) was developed in the U.S. in the 1980s and in applied in Europe since the early 2000s. While EJ studies vary in terms of their spatial scales, types of pollutions considered, and analytical refinement, they find that overall poor and minority populations bear a disproportionate burden of total environmental risks.
2
Deguen, S., Zmirou-Navier, D. 2009. Social Inequalities Resulting from Health Risks Related to Ambient Air Quality—A European Review. European Journal of Public Health 20(1): 27–35.
3
Pearce, J.R., Richardson, E., Mitchell, R., Shortt, N. 2011. Environmental Justice and Health: A Study of Multiple Environmental Deprivation and Geographical Inequalities in Health in New Zealand. Social Science and Medicine 73(3): 410–420.
4
Evans, G.W., Kantrowitz, E. 2002. Socioeconomic Status and Health: The Potential Role of Environmental Risk Exposure. Annual Review of Public Health 23: 303–331.
5
O'Neill, M.S., McMichael, A., Schwartz, J., Wartenberg, D. 2007. Poverty, Environment, and Health: The Role of Environmental Epidemiology and Environmental Epidemiologists. Epidemiology 18(6): 664–668.
6
Fairburn J., Butler, B., and Smith, G. 2009. Environmental Justice in South Yorkshire: Locating Social Deprivation and Poor Environments Using Multiple Indicators. Local Environment 14(2): 139–154.
7
Townsend, P. 1987. Deprivation. Journal of Social Policy 16(2): 125–146.
8
Harner, J., Warner, K., Pierce, J., Huber, T. 2004. Urban Environmental Justice Indices. The Professional Geographer 54(3): 318–331.
9
Pye, S., Skinner. 2008. Addressing the Social Dimensions of Environmental Policy—A Study on the Linkages Between Environmental and Social Sustainability in Europe. European Commission Directorate-General. “Employment, Social Affairs and Equal Opportunities,” p. 148.
10
Evans, G.W., Kantrowitz, E. 2002. Socioeconomic Status and Health: The Potential Role of Environmental Risk Exposure. Annual Review of Public Health 23: 303–331.
11
Pearce, J.R., Richardson, E., Mitchell, R., Shortt, N. 2011. Environmental Justice and Health: A Study of Multiple Environmental Deprivation and Geographical Inequalities in Health in New Zealand. Social Science and Medicine 73(3): 410–420.
12
U.S. Environmental Protection Agency (EPA). 2010. A Screening Tool for EJ Concerns. Strengthening Environmental Justice Research and Decision Making Symposium March 18, 2010 (by Andrew Schulman, Region 3). Available at <
13
Tate, E. 2012. Uncertainty Analysis for a Social Vulnerability Index. Annals of the Association Geographers. DOI: 10.1080/00045608.2012.700616. Epub ahead of print.
14
Ibid.
15
Havard, S., Deguen, S., Bodin, J., 2008. A Small-area Index of Socioeconomic Deprivation to Capture Health Inequalities in France. Social Science and Medicine 67: 2007–16.
16
Carstairs, V. 1995. Deprivation Indices: Their Interpretation and Use in Relation to Health. Journal of Epidemiology and Community Health 49 (Suppl. 2): 3–8.
17
Eibner, C., and Sturm, R. 2006. US-based Indices of Area-Level Deprivation: Results from HealthCare for Communities. Social Science and Medicine 62: 348–359.
18
Niggebrugge, A., Haynes, R., Jones, A., Lovett, A., and Harvey, I. 2005. The Index of Multiple Deprivation 2000 Access Domain: A Useful Indicator for Public Health? Social Science and Medicine 60: 2743–2753.
19
Richardson, E., Mitchell, R., Shortt, N., Pearce, J., and Dawson, T. 2009. Evidence Based Selection of Environmental Factors and Datasets for Measuring Multiple Environmental Deprivation in Epidemiological Research. Environmental Health 8(supp1.1): 18.
20
Koutsavlis, A.T., Wolfson, C. 2000. Elements of Mobility as Predictors of Survival in Elderly Patients with Dementia: Findings from the Canadian Study of Health and Aging. Chronic Diseases in Canada 21(3): 104–113.
21
World Health Organization (WHO) Regional Office for Europe. 1985. Target for Health For All: Targets in Support of the European Regional Strategy for Health for All (Copenhagen: WHO).
22
Beguin, M., Pumain, D. 1994. La Représentation des Données Géographiques. (Paris: Armand Colin), p. 192.
23
The results of these tests are not presented here, but are available upon request.
24
Pampalon, R., Raymond, G. 2000. A Deprivation Index for Health and Welfare Planning in Québec. Chronic Diseases in Canada 21(3): 104–113.
25
The relative contribution of each environmental factor to the overall SED score for each department has been identified by the authors.
26
Viel, J.F., Hagi, M., Upegu, E., Laurian, L. 2010. Environmental Justice in a French Industrial Region: Are Polluting Industrial Facilities Equally Distributed? Health and Place 17: 257–262.
27
D. McLaren, O. Cottray, M. Taylor, S. Pipes, and S. Bullock. 1999. The Geographic Relation Between Household Income and Polluting Factories. A Report for Friends of the Earth (London: Friends of the Earth (FOE)).
28
Friends of the Earth. 2001. Pollution and Poverty—Breaking the Link (London: FOE).
29
McLeod, H., Langford, I.H., Jones, A.P., Stedman, J.R., Day, J.R., Lorenzoni, I., and Bateman, I.J. 2000. The Relationship Between Socio-economic Indicators and Air Pollution in England and Wales: Implications for Environmental Justice. Regional Environmental Change 12: 78–85.
30
Lavelle, M., Coyle, M. 1992. Unequal Protection. National Law Journal Sept. 21, 1992, S2.
31
Mennis, J., 2005. The Distribution and Enforcement of Air Polluting Facilities in New Jersey. The Professional Geographer 57(3): 411–422.
32
Mitchell, J., Thomas, D.S.K., Cutter, S.L. 1999. Dumping in Dixie Revisited: The Evolution of Environmental Injustices in South Carolina. Social Science Quarterly 80(2): 229–243.
33
Been, V., Gupta, F. 1997. Coming to the Nuisance or Going to the Barrios—A Longitudinal Analysis of Environmental Justice Claims. Ecology L.Q. 1.
34
Jerrett, M., Burnett, R.T., Kanaroglou, P., Eyles, J., Finkelstein, N., Giovis, C., Brook, J.R. 2001. Environmental Justice Analysis of Particulate Air Pollution in Hamilton, Canada Environment and Planning A 33: 955–973.