
Abstract
Abstract
In 2011, concentrated animal feeding operations (CAFOs) produced 500 million tons of manure in the United States, causing surface water contamination, toxic gas emissions, and reduced quality of life for surrounding residents. Historically, CAFOs have been disproportionately sited near communities with large populations of minority groups, low-income families, and vulnerable groups such as children and the elderly, and the number of CAFOs in the midwestern U.S. is growing. This study uses the Moran's I and Getis Ord Gi* statistics to explore the spatial distribution of CAFOs in the state of Ohio, which experienced a 6.5% decrease in the number of livestock producing farms and a 28% increase in the number of animals per farm from 2000 to 2007. A two-tailed t-test was used to compare the mean demographic profiles in CAFO-dense census tracts to tracts without CAFOs. The study finds that Ohio CAFOs are primarily clustered along the western border of the state, and that black and Hispanic populations, as well as households with relatively low incomes, are disproportionately exposed to CAFOs compared to other populations. These populations may be highly exposed to environmental risks resulting from CAFO waste production, and likely experience reduced quality of life as a result of CAFO proximity.
Introduction
Concentrated animal feeding operations (CAFOs) are animal feeding operations of at least 1,000 animal units (for example, 2,500 large pigs or 100,000 chickens), where animals are confined indoors for at least 45 days during a growing season in an area that does not produce vegetation.5 In 2011, CAFOs produced more than 500 million tons of manure in the United States, resulting in substantial air and water pollution.4 Workers and neighbors of CAFOs experience high levels of respiratory problems, including asthma, and poorly treated waste may result in contamination of nearby surface waters with dangerous levels of bacteria, fungi, viruses, and nutrients.6
Even more concerning, studies have shown that CAFOs often have a disproportionate impact on low-income and nonwhite populations.7 In North Carolina, studies have found that hog operations tend to be disproportionately located near poor, African American communities.7,8 Similarly, Wilson et al. (2002)9 found that swine CAFOs in Mississippi cause inequitable health and socioeconomic impacts on African American and low-income communities. In Iowa, a study by Merchant et al. (2005)10 suggests that children living on or near swine-producing farms have higher rates of asthma compared to other children. Although the rapid rise in CAFOs impacts rural development and community health in almost every state, little research has looked beyond the highest meat-producing states.
This study explores the spatial distribution of CAFOs in the state of Ohio, one of the largest egg-producing states in 2007 and a state that experienced a 6.5% decrease in the number of livestock producing farms and a 28% increase in the number of animals per farm from 2000 to 2007.11 Rural areas with high densities of CAFOs are compared to other rural areas to determine whether minority, low-income, and vulnerable populations (children and elderly) are unequally exposed to CAFOs. The study is completed using a geographic information system (GIS), incorporating spatial statistical analysis of populations at the census tract level.
Methods
Data
Ohio CAFOs data were provided by the Ohio Environmental Protection Agency (EPA) and updated to 2010. Data included facility names, permit status, geographic coordinates, and the type and number of animals at each of the original 212 documented Ohio CAFO facilities. Ten CAFOs were removed because they were marked as either “not built,” “no longer permitted,” or “empty,” leaving 98 poultry facilities, 52 swine facilities, 41 dairy facilities, 8 beef facilities, and 3 horse facilities. To avoid redundancy in spatial information, all facilities producing more than one type of animal were counted only once in overall spatial cluster analysis, but each facility location was counted for cluster analysis of individual animal types. Ten CAFOs produced more than one type of animal, resulting in 191 individual CAFO locations. The study was conducted at the census tract level due to the homogeneity of tract population,12 the strong reflectance of the structure of local communities,13 and because environmental hazards caused by CAFOs are likely experienced beyond the boundary of smaller units such as block or block groups. Select demographic characteristics from the 2010 U.S. Census included percent African American, percent Hispanic, and percent Asian populations, percent elderly (over 65), and percent children. In this study, children are defined as those 15 and younger, following EPA's standard where women of child-bearing age are considered to be between the ages of 16 and 49 years.14 This study aggregated population statistics for all age groups 15 and younger, so as not to include the EPA's 16-year minimum age of child-bearing women. Median household income in 2011 inflation-adjusted dollars was collected from the 2007–2011 American Community Survey (ACS) 5-year estimates. The coefficient of variation (CV), a data reliability measure, for ACS data yielded 2,091 tracts (71.2%) with median household income estimates that are highly reliable (CV ≤12), 812 tracts (27.6%) with estimates of medium reliability (12<CV ≤40), and 34 tracts (1.2%) with low reliability (CV>40); reliability thresholds were suggested by ESRI.15
Pre-processing of data included the projection of all spatial data into NAD 1983 UTM Zone 17N and the removal of urban areas. It has long been observed throughout the United States that rural communities have lower wages, lower median incomes, and higher poverty rates than metropolitan areas.16,17 Therefore, all census tracts within designated urban areas (as defined by the U.S. Census Bureau Urban Areas data layer) were removed from the analysis, resulting in the exclusion of 50.7% of Ohio census tracts, 4.1% of the land area in Ohio, and one CAFO location. Furthermore, the number of CAFOs per tract was normalized according to census tract size and converted to the density of CAFOs, or the number of CAFOs per square kilometer. Finally, Beef- and Horse-producing CAFOs were eliminated from the study because of their low numbers.
Spatial autocorrelation of CAFO facilities
The global Moran's I statistic tested for spatial autocorrelation of CAFO densities in Ohio. The Getis Ord Gi* statistic then located clusters or “hot spots” of high CAFO densities. Additionally, the data were broken up according to the type of animal being produced (poultry, pork, or dairy) to test for clustering of particular livestock operations. An inverse distance function defined the neighborhood following the logic that high-density CAFO areas are more impactful on health and environment when close together than spaced farther apart.
Environmental justice analysis
Once spatial clustering was confirmed and located, a basic assessment of the demography of those census tracts exhibiting clustering of CAFO density was completed, using the following six socioeconomic variables: percent black, percent Hispanic, percent Asian, percent elderly, percent children, and median household income. All census tracts with Z-scores ≥1.96 in the Getis Ord Gi* results (indicating significant clustering with 95% confidence) were extracted and their socioeconomic variables were compared to the averages for rural census tracts with Z-scores<1.96. For each variable and within each animal-production group, a two-sampled Welch's t-test was calculated to determine whether the populations living in clusters of census tracts with high CAFO density are significantly different from those in rural census tracts outside of these clusters. The Welch's t-test18 is an adaptation of the Student's t-test to account for samples with unequal variances, and is computed as follows:
where Xc is the mean of a socioeconomic variable in CAFO density hot spots, Xn is the mean of a variable in Ohio Census tracts that are not CAFO density hot spots, varc is the variance of a variable in CAFO density hot spots, varN is the variance of a variable in tracts that are not CAFO density hot spots, and n is the number of tracts in each category. If the probability of obtaining the calculated t-statistic is less than 0.05, the demographic means of the two samples are significantly different at the 95% confidence level, indicating unequal exposure to CAFOs.
Local indicators of spatial autocorrelation
For those variables that exhibited a positive statistically significant Z-score (Z ≥1.96) in the demographic t-test, a bivariate local indicator of spatial autocorrelation (LISA) analysis was performed using GeoDa open source GIS software in order to locate regions demonstrating the relationships between CAFO density and socioeconomic variables described by the t-test analysis. An inverse distance function defined the spatial neighborhood of analysis. Each variable was paired with the CAFO density in each census tract, and the following clusters were extracted:
High-High (HH): Clusters with high values of a given socioeconomic variable and a high CAFO density Low-Low (LL): Clusters with low values of a given socioeconomic variable and a low/zero CAFO density High-Low (HL): Clusters with high values of a given socioeconomic variable and a low/zero CAFO density Low-High (LH): Clusters with low values of a given socioeconomic variable and a high CAFO density
Results
Spatial autocorrelation of CAFO facilities
The Moran's I analysis indicates that census tracts with all types of CAFOs, except for those with dairy facilities, are clustered at 99% confidence level (Table 1). Hot Spot Analysis (Getis-Ord Gi*) identifies the location of census tract clusters with higher densities of CAFOs than one would expect by random chance. Figure 1 exhibits the spatial distribution of CAFO-dense census tracts for all CAFOs, Poultry, Swine, and Dairy. The most consistent pattern is several tracts with high densities of CAFOs along the western border of Ohio. In particular, Wyandot, Putnam, Van Wert, Shelby, and Hardin Counties are all impacted by CAFO placement due to the large area taken up by CAFO-dense census tracts in these counties. Despite showing a random distribution in the global Moran's I analysis, Dairy facilities with Z-scores greater than 1.96 (95% confidence) in the Gi* analysis are located in the northwest corner of the state, primarily impacting Williams, Mercer, Van Wert, and Defiance Counties. The number of Poultry facilities exceeds that of Dairy and Swine facilities combined, yet the Poultry CAFO-dense census tracts are clustered in fewer locations throughout the state. Mercer County and Darke County, on the western border of the state, contain eight hot spot census tracts with Z-scores ranging from 2.05 to 21.66, indicating significant clustering of high-density Poultry CAFOs. Mercer County is also impacted by Swine facilities, with Gi* Z-scores in census tracts ranging between 2.60 and 11.62. Paulding, Crawford, Darke, and Shelby Counties also contain hot spots of Swine facilities (Z-scores between 2.02 and 14.17), and Pickaway County, Madison County, and Fairfield County, three counties immediately south of heavily populated Columbus, exhibit hot spots of Swine CAFOs (Z-scores ranging from 2.44 to 3.51).
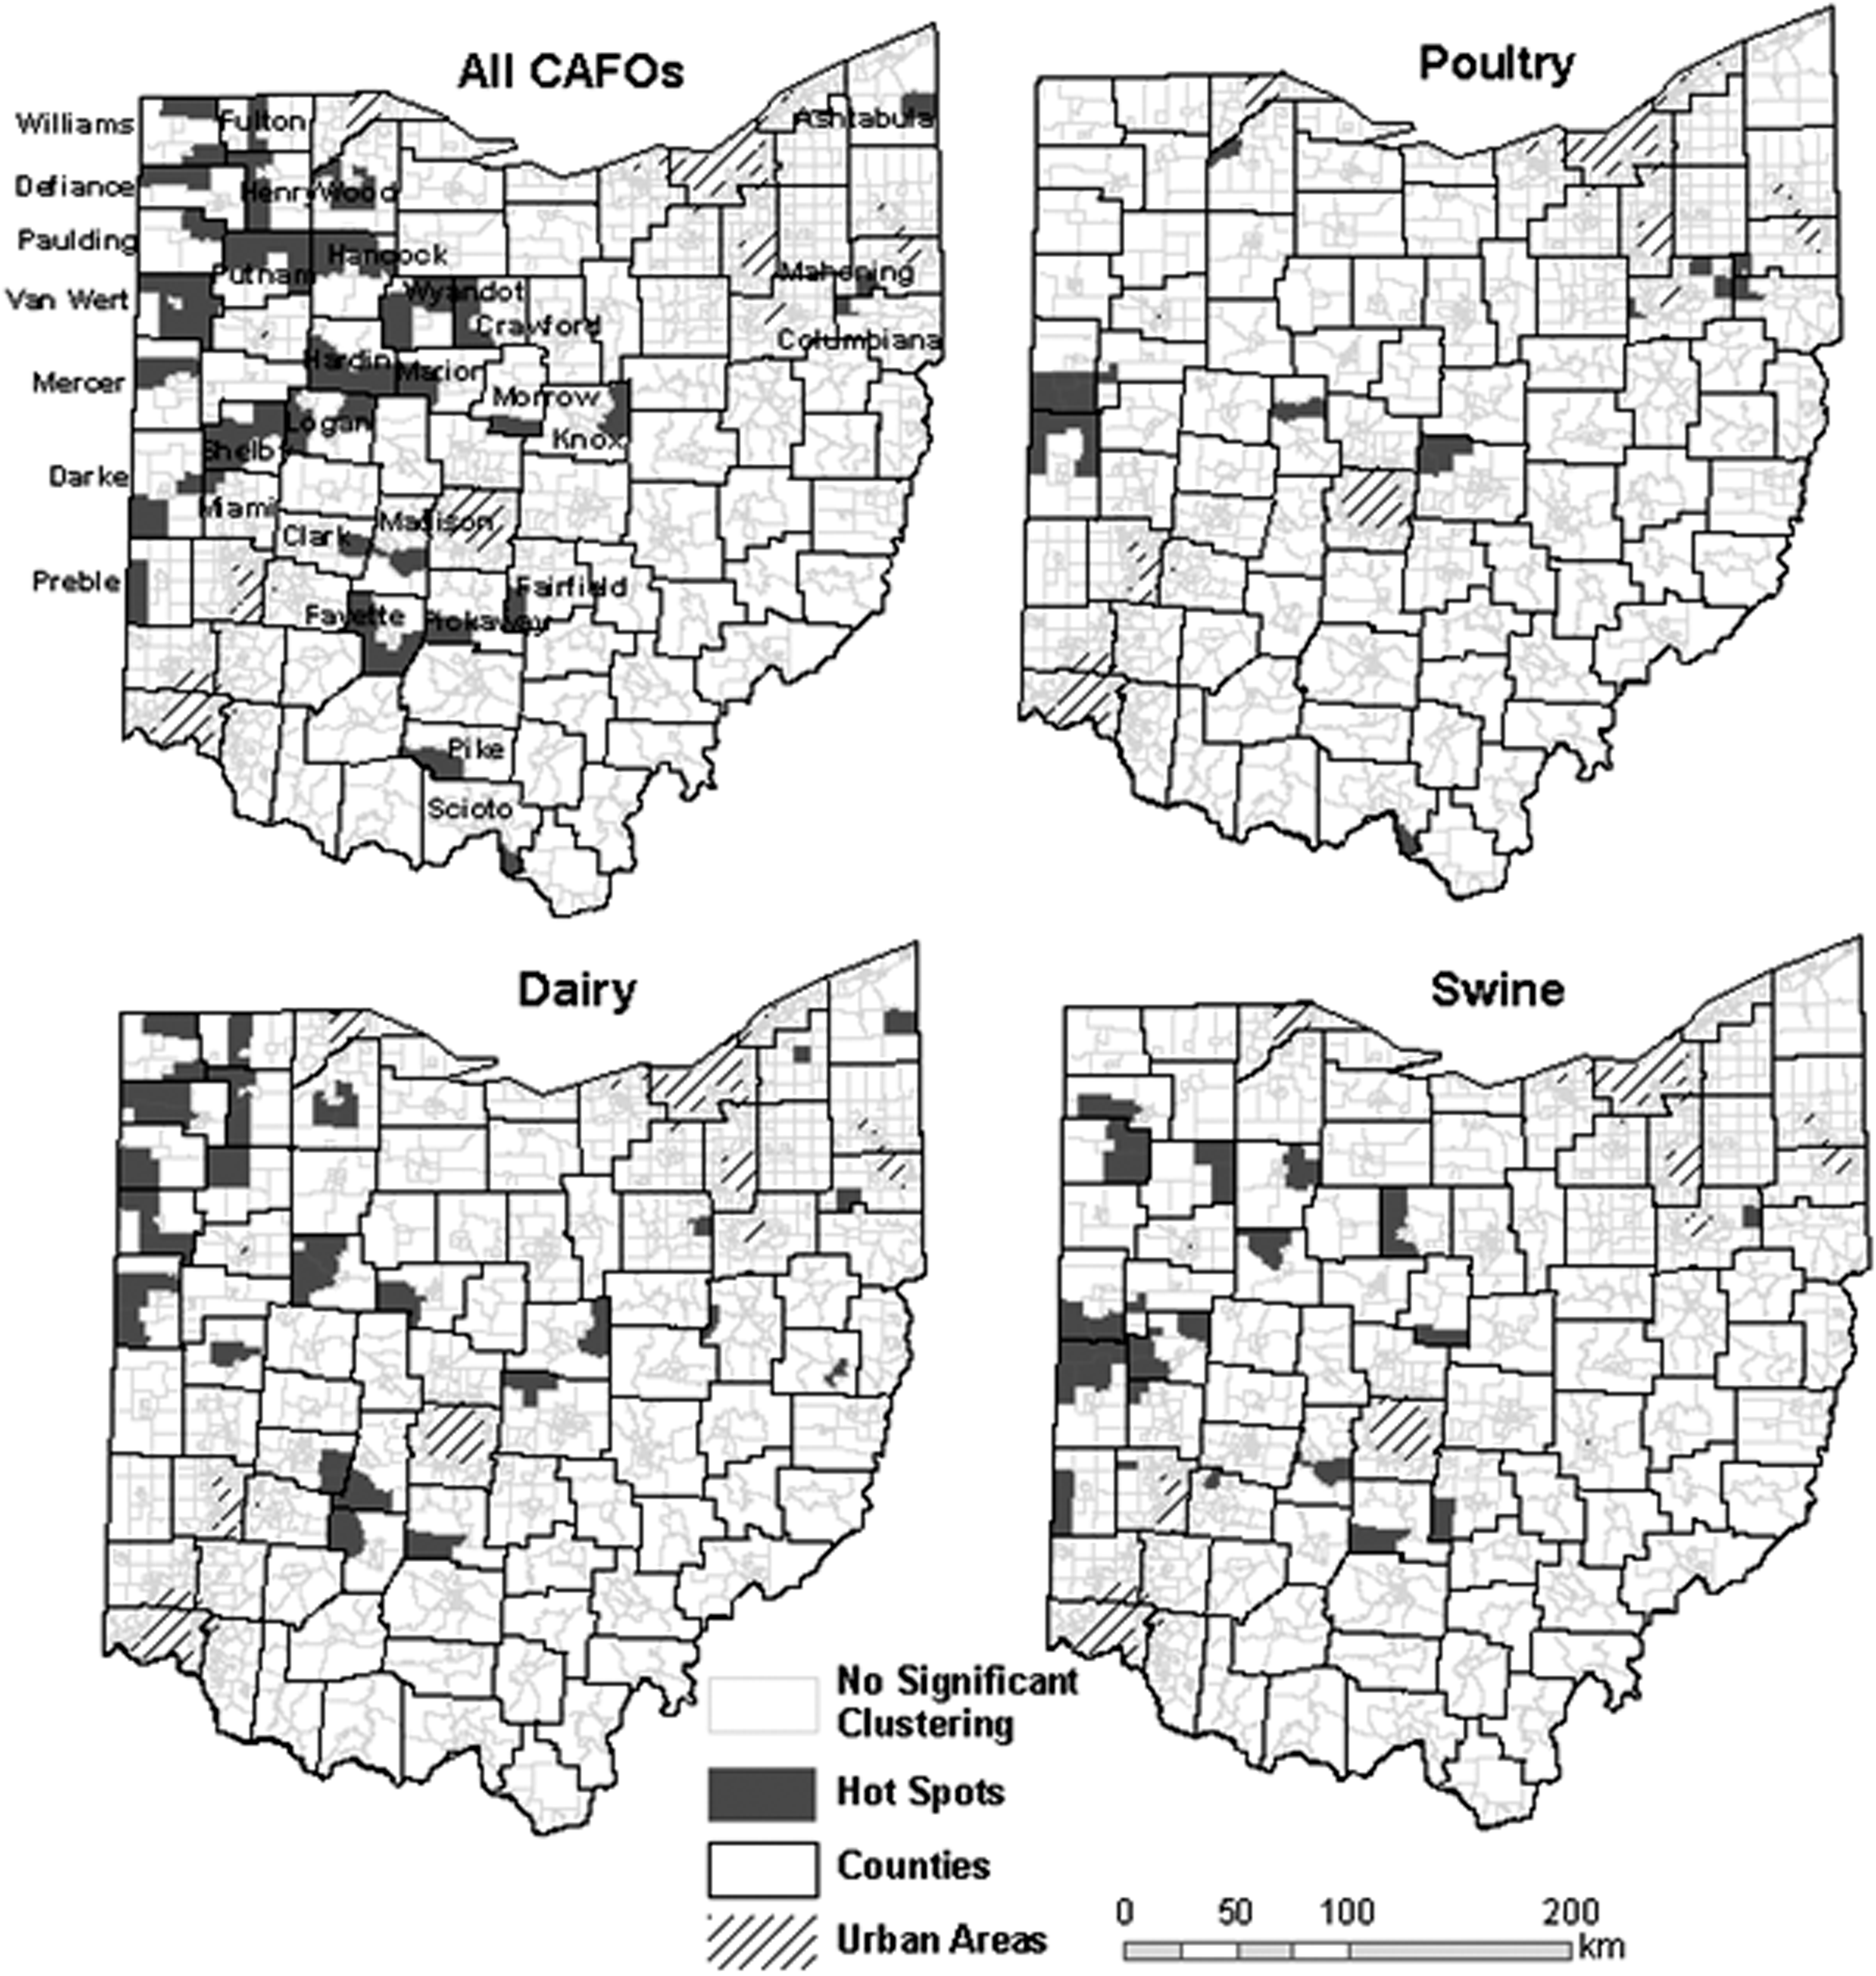
Getis Gi* results indicating density hot spots of (a) Concentrated Animal Feeding Operations for all species types, (b) Poultry facilities, (c) Dairy facilities, and (d) Swine facilities.
Environmental justice analysis
The t-values and p-values associated with the mean differences between hot spots of CAFO-dense census tracts and non-hot spots census tracts for minority, elderly, and child populations, and median household incomes are listed in Table 2. The black population living in CAFO-dense census tracts is significantly smaller than in census tracts without CAFOs, regardless of the species produced. Similar results are found for Asian populations, although the statistical difference between population means is greater in magnitude. No significant relationship exists for median household income or elderly. Hispanic populations are higher in census tracts with high densities of all CAFOs, Dairy CAFOs, and Swine CAFOs, although the relationships are only significant at the p<0.1 confidence and are therefore less certain. The number of children under 15 years of age is significantly higher (p<0.05) in CAFO-dense census tracts, for all animal species excluding Poultry.
A bivariate LISA analysis was performed using the percent children under 15 years of age measured against CAFO density due to the level of significance in the assessment-test results (Figure 2). Percent Hispanic population was also included in a bivariate LISA for additional analysis because it shows higher values in census tracts with all CAFOs, Dairy CAFOs, and Swine CAFOs, although it is not significant at the p<0.05 level, and because Hispanic population has previously been highlighted as a concern in environmental justice issues. For all animal species types, areas of densely located CAFOs correspond to census tracts with high populations of children under 15 primarily along the western border of the state. In particular, Mercer, Darke, and Defiance Counties contain census tracts designated as High-High clusters, where high densities of CAFOs correspond to high percentages of children. A similar pattern is observed for Hispanic populations, although the concentration of High-High clusters dominates in Defiance County. Dairy CAFOs do not exhibit a dominant spatial pattern for percent children, and High-High clusters are few and spread across the northern portion of the state. Hispanic populations, however, show a clear cluster of high densities of Dairy CAFOs in the northwest corner of Ohio, in Defiance and Fulton Counties. High densities of Swine CAFOs exist in census tracts with high percentages of children in a tight cluster of tracts in central-west Ohio, namely in Mercer and Darke Counties, and while Hispanic population shows clustering in the northwest corner of Ohio, there is not a dominant pattern of clustering.

Multivariate LISA results indicating clusters of CAFOs and population percentages. High-High indicates areas with both a high density of CAFOs and a high percentage of children or Hispanic population. High-Low indicates a high density of CAFOs and a low percentage. Low-High corresponds to low density of CAFOs in census tracks with high percentages of the given populations, and Low-Low regions have low density of CAFOs and population percentages.
Discussion
This study suggests that there is environmental discrimination with respect to the concentration of CAFOs and Hispanic populations and children. We used GIS and spatial statistics to examine the distribution of CAFOs in Ohio and their relationship to socioeconomic population groups in an environmental justice analysis. Poultry CAFOs are primarily clustered along the western border of the state, while Dairy and Swine CAFOs tend to be located in the northwestern corner. We find that, at the census tract level, there are higher proportions of children and Hispanic populations in regions with high densities of Dairy and Swine CAFOs. Black and Asian populations are significantly lower in CAFO-dense regions while median household income and elderly populations exhibit no statically significant relationship.
A previous study19 used a longitudinal analysis to show that greater percentages of Hispanic, low-education, and low-income populations live near CAFOs in eastern North Carolina when compared to random points throughout the same region. It is possible that higher Hispanic populations near CAFOs are explained by preferential employment of recent immigrants in CAFOs due to the taxing physical and mental conditions.20,21 This would indicate that not only are Hispanics disproportionately exposed to reduced quality of life due to proximity to CAFO facilities, but that they are also disproportionately exposed to the physical and environmental dangers of working in such a facility. The relationship between CAFO siting and proximity to children has been addressed and demonstrated in several previous studies.22,23 Concern for the relationship between CAFO siting and proximity to children arise from the high vulnerability of children to toxic emissions and airborne illnesses from concentrated livestock facilities.24,25,26
Our study found no relationships between CAFO density and income or the proportion of black populations—a finding that is contested by similar analyses which show that low-income and African American populations tend to be unequally exposed to CAFOs.27 It is possible that CAFOs are less clustered in low-income areas of Ohio and that African Americans are located primarily in urban areas that were not included in our analysis, but it is also likely that the scale of the analysis influenced the results of every relationship studied in this article. Scale plays an important role in environmental justice studies as relationships between toxic facilities and socioeconomic population groups may change or become more or less significant when moving from the census tract to the county or zip-code level.28 A limitation of this study, therefore, is that it can only describe relationships at the census tract level, and future research should include analysis of relationships at both finer (census block or block group) and coarser resolutions (county or zip code).
Conclusions
Ohio is one of the largest egg-producers in the country and a state that is experiencing a trend of intensification in livestock production. As a result, CAFOs are becoming more prominent on Ohio horizons, resulting in contamination of surface water, toxic airborne emission, and odor and aesthetic issues. Certainly, CAFOs do not only negatively impact the health and quality of life of surrounding residents. CAFOs in the United States strongly impact the local and regional economy, putting small, family farms out of business and driving away development in other economic sectors. At the global scale, meat production is responsible for up to 24% of the world's greenhouse gas emissions and the livestock sector uses approximately 8% of the world's entropic water resources,29 issues that have largely remained unaddressed in U.S. discussions of climate change and agriculture. Furthermore, the long-term confinement of thousands of animals in small spaces, where they are rarely able to turn around, see sunlight, or have physical contact with their offspring, has long been considered an inhumane and unethical practice.30 All of these impacts have long-lasting effects on the physical and emotional well-being of communities, nations, and our global society, and places like Iowa and North Carolina have sacrificed the well-being of their states in favor of CAFOs, likely with irreversible consequences. These arguments must be considered in future siting and construction of CAFOs in the midwestern United States, particularly in states like Ohio that have not yet passed the point of no return.
Footnotes
Author Disclosure Statement
The authors have no conflicts of interest or financial ties to disclose.
1
Steinfeld, H., Gerber, P., Wassenaar, T., Castel, V., Rosales, M., and C. De Haan. (2006). Livestock's Long Shadow: Environmental Issues and Options. Rome: FAO.
2
Donham, K. J., Wing, S., Osterberg, D., Flora, J. L., Hodne, C., Thu, K. M., and Thorne, P. S. (2007). Community Health and Socioeconomic Issues Surrounding Concentrated Animal Feeding Operations. Environmental Health Perspectives, 115(2), 317–320.
3
Thorne, P. (2007). Environmental Health Impacts of Concentrated Animal Feeding Operations: Anticipating Hazards—Searching for Solutions. Environmental Health Perspectives, 115(2), 296–297.
4
Imhoff, D. (2010). The CAFO Reader: The Tragedy of Industrial Animal Factories. Los Angeles: Watershed Media.
5
Osterberg, D., and D. Wallinga. (2004). Addressing Externalities From Swine Production to Reduce Public Health and Environmental Impacts. American Journal of Public Health, 94(10): 1703–1708.
6
Pew Commission. (2008). Putting Meat on the Table: Industrial Farm Animal Production in America. Baltimore, MD: Johns Hopkins Bloomberg School of Public Health. <http://www.ncifap.org/_images/PCIFAPSmry.pdf>.
7
Wing, S., Cole, D., and G. Grant. (2000). Environmental Injustice in North Carolina's Hog Industry. Environmental Health Perspectives, 108(3), 225–231.
8
Edwards, B. and Ladd, A., (2010). Environmental Justice, Swine Production and Farm Loss in North Carolina. Sociological Spectrum: Mid-South Sociological Association, 20(3), 263–290.
9
Wilson, S. M., Howell, F., Wing, S., and M. Sobsey. (2002). Environmental Injustice and the Mississippi Hog Industry. Environmental Health Perspectives, 110(2), 195–201.
10
Merchant, James A. et al. Asthma and Farm Exposures in a Cohort of Rural Iowa Children. Environmental Health Perspectives, 113(3), 350–356. <http://www.ehponline.org/ members/2004/7240/7240.pdf>.
11
U.S. Department of Agriculture. (2008). Livestock Slaughter. National Agricultural Statistics Service.
12
Liu, F. (2001). Environmental Justice Analysis: Theories, Methods and Practice. Boca Raton, FL: CRC Press LLC.
13
Bogue, D. (1985). Population in the United States: Historical Trends and Future Projections. New York, NY: Free Press.
14
U.S. Environmental Protection Agency. (2012). America's Children and the Environment, Third Edition. Washington, D.C.: U. S. EPA.
15
Esri. (2011). The American Community Survey. White paper. <http://www.esri.com/data/esri_data/literature> (last visited Mar. 23, 2013).
16
Kumar, C. M. (2002). GIS Methods for Screening Potential Environmental Justice Areas in New England. Submitted to the Department of Urban Studies and Planning in Partial Fulfillment of the Requirements for the Degree of Master in City Planning, Massachusetts Institute of Technology.
17
Maantay, J., Chakraborty, J., and Brender, J. (2010). Proximity to Environmental Hazards: Environmental Justice and Adverse Health Outcomes. Prepared for the U.S. Environmental Protection Agency. <http://www.epa.gov/ncer/events/calendar/2010/mar17/presentations/maantay.pdf>.
18
Welch, B.L. (1947). The Generalization of Student's Problem When Several Different Population Variances Are Involved. Biometrika, 34, 28–35.
19
Horton, J. (2012). The Siting of Hog CAFOs in Eastern North Carolina: A Case of Environmental Injustice? M.S. Thesis, University of Michigan, Ch.2.
20
Arcury, T. A., and Marín, A.J. (2009). Latino/Hispanic Farmworkers and Farm Work in the Eastern United States: The Context for Health, Safety, and Justice. In Latino Farmworkers in the Eastern United States, ed. Arcury and Quandt, 15–36. New York, NY: Springer Science+Business Media. DOI: 10.1007/978-0-387-88347-2_2.
21
Imhoff, D. (2010). The CAFO Reader: The Tragedy of Industrial Animal Factories. Los Angeles, CA: Watershed Media.
22
Donham, Kelley J. (2000). The Concentration of Swine Production: Effects on Swine Health, Productivity, Human Health, and the Environment. Veterinary Clinics of North America Food Animal Practice, 16(3): 559–598.
23
Sigurdarson, Sigurdur T., and Joel N. Kline. (2006). School Proximity to Concentrated Animal Feeding Operations and Prevalence of Asthma in Students. CHEST Journal 129(6), 1486–1491.
24
Committee on Environmental Health. (1993). Ambient Air Pollution: Respiratory Hazards to Children. Pediatrics, 91(6), 1210–1213.
25
Barrett, J.R. (2006). Hogging the Air: CAFO Emissions Reach into Schools. Environmental Health Perspectives, 114(4), A241.
26
Mirabelli, M., Wind, S., Marshall, S., Wilcosky, W. (2006). Asthma Symptoms Among Adolescents Who Attend Public Schools That Are Located Near Confined Swine Feeding Operations. Pediatrics, 118(1): 2005–2812.
27
Edwards, B. and Ladd, A. (2010). Environmental Justice, Swine Production and Farm Loss in North Carolina. Sociological Spectrum: Mid-South Sociological Association, 20(3), 263–290.
28
Sheppard, E., Leitner, H., McMaster, R., and H. Tian. GIS-based Measures of Environmental Equity: Exploring Their Sensitivity and Significance. (1999). Journal of Exposure Analysis and Environmental Epidemiology, 9, 18–28.
29
Steinfeld, H., Gerber, P., Wassenaar, T., Castel, V., Rosales, M., and C. De Haan. (2006). Livestock's Long Shadow: Environmental Issues and Options. Rome, FAO.
30
Imhoff, D. (2010). The CAFO Reader: The Tragedy of Industrial Animal Factories. Los Angeles, CA: Watershed Media.