
Abstract
Abstract
The presence of leaking underground storage tanks (LUST) may present environmental justice (EJ) concerns including groundwater contamination for communities with a number of USTs, other environmental hazards, and poor infrastructure. The purpose of this study is to assess ten years of residential LUST exposure data in Maryland across areas with varying sociodemographic composition. Methods: We linked ten years of site-specific LUST remediation data with 2010 Census data. Simple linear regression was conducted using R to predict increases in proximity to LUSTs based on independent sociodemographic variables as well as diversity and deprivation indices. Results: Consistently, across the state, census tracts with a higher composition of white residents demonstrated more resistance to decaying distance between adjacent LUSTs (Beta=0.003; p<0.05) than census tracts with higher composition of non-white (Beta=−0.003; p<0.05) and similar trends for % poverty, % < than high school (HS) education, % homes built before 1950, % black in poverty, and % black less than HS education (Beta=−0.012, −0.011, −0.006, −0.014, −0.015, −0.046, respectively, with p<0.05 in all these tests). Conclusion: Overall, results presented here show that the sociodemographic patterns related to race/ethnicity, poverty status, neighborhood, and dwelling measures tend to be associated with residential distance from one or more LUSTs.
Introduction
T
Groundwater is a source of drinking water for 50% of the U.S. national population and 99% of its rural population. 3 Since the major routes of aquifer contamination are from LUSTs, the consequences of a leak are potentially far-reaching. 4 Additionally, soil can be contaminated by noxious petroleum compounds emitted from a LUST.5–6 Volatile organic compounds (VOCs) may also be released, which are constituents of petroleum that readily evaporate into the air and soil.7–9 According to the USEPA, contaminants of concern include methyl tert-butyl ether (MTBE), benzene, toluene, ethylbenzene, and xylenes (BTEX).2,10–13 These contaminants pose an immense public health threat as some have been classified as carcinogenic, teratogenic, and/ or implicated in the etiology of other systemic symptoms.2,10–13
The first national study of UST leakage conducted by the USEPA (1995) revealed that there were over a million federally regulated USTs, producing 287,000 confirmed LUSTs. 3 Furthermore, close to 50% of the confirmed LUSTs had contaminants reach groundwater. 4 Another USEPA study revealed that while the number of confirmed LUST releases have risen to 510,000, 84% of sites have already been remediated or “closed.”7–8 The USEPA attributes the success of national remediation efforts to the initial responsiveness of their certified state UST/LUST programs. 14 However, the USEPA also reported in 2001 that in spite of the remediation gains nationally there were still over 81,000 LUSTs backlogged for remediation. 15 The Maryland Department of the Environment (MDE) Oil Control Program (OCP) has been responsible for monitoring regulated USTs and cleaning LUSTs in the state since the EPA sponsored the MDE-OCP in 1992, making it the second oldest UST/LUST remediation program in the nation. 16
The most recent LUST performance measures for the state of Maryland (MD) from 2012 reveal that 11,409 of the 11,771 confirmed LUSTs in the state have been cleaned (i.e., closed). Thus leaving 362 LUSTs open with cleanups backlogged for completion. The MDE takes a site-specific decision-making approach when deciding which LUSTs to remediate and in what order they should be addressed. 17
The presence of underground storage tanks whether cleaned or still leaking may present environmental justice (EJ) concerns for communities with a number of USTs, other environmental hazards, and poor infrastructure. This article explores this topic by assessing the distribution of LUSTs in Maryland across areas with varying sociodemographic composition.
Methods
Leaking underground storage tanks (LUSTs)
We obtained site-level LUST monitoring and remediation data for the state of MD (2001–2011) through a data sharing agreement with MDE in July 2011. Overall, 4,385 LUSTs were geocoded and mapped using geographic information systems (GIS). Sites were then classified by their remediation status, as being either open or closed. The sites classified as open were used in analyses highlighted in this manuscript (N=664).
Sociodemographic (SOD) measures
Tract-level data for MD (N=1,390) was utilized to describe the burden of LUSTs in census tracts based on sociodemographic composition. Sociodemographic (SOD) measures were derived from 2010 Census data and modeled using quartiles. SOD measures of interest included: race/ethnicity data (% white, % black, and % non-white) and housing tenure status (% owner occupied units). In this particular study, non-white was defined as any race/ethnicity other than white such as Asian and Pacific Islander, black, Native Hawaiian and Alaskan Native, and Latino. Furthermore, American Community Survey (ACS) five-year estimates were used to estimate socioeconomic status (SES) factors including: poverty status (% people below poverty line), room occupancy (% two or more people in a room), house construction (% homes built before 1950), unemployment (% unemployed), educational attainment (% less than high school [HS] education), and race-related interaction measures (% people below poverty and black, % less than HS education and black). Other income measures measured from ACS five-year estimates were median household income and per capita income.
In addition, 2010 TIGER MD census tract geography shapefiles were downloaded from the U.S. Census website. The census and geography data were linked by U.S. Census Federal Information Processing Standards codes (FIPS) in ArcMap 10 (Esri, Redlands, CA).
Deprivation and diversity indices
Townsend Index
The Townsend Index is a measure of socioeconomic deprivation within an area and is constructed by the percentage of households without a car, households with more than two people living in a room, house renters and unemployment:
18
Where μTi is the mean of Ti in the research area, and STi is the corresponding standard deviation, X1 and X2 are the percentage of unemployment and households with more than two people living in a room; and X3 and X4 are the percentage of households without a car and house renter. A high Townsend Index is indicative of high material deprivation. 18
USA Today Diversity Index
The USA Today Diversity equation measures the distribution of multiple races. It calculates the probability that any two people randomly selected in an area are from different races or ethnic groups:
where qh is percent Hispanics in an area and pi include percent white, African American/black, Asian, American Indian and Alaska Native, and Native Hawaiian and other Pacific Islander. The higher the diversity index, the more the population is diverse in a region. When the diversity index is 1, it means the probability of two people random selected from population from different race/ethnicity will be 1. This diversity index is easier to understand than other diversity-related indices. It only needs race data at the tract level, while other indices need geographic and sociodemographic data at the block group level which can make the computation complicated. In addition, the diversity index can be used with any census unit, which makes it more versatile than other diversity-related or segregation indices. 19
Statistical and geographic methods
We utilized GIS methods and statistical analysis to investigate the relationship between race, socioeconomic factors, and the mean distance between 2010 Census tracts and LUSTs in Maryland (2011). We calculated the distance between a census tract and the nearest LUST classified from this point forward as “LUST-CT” to assess possible burden disparities. Mean LUST-CT measurements were computed using the ArcMap 10 software package. If a LUST-CT distance measurement could not be obtained because the nearest LUST was located within a particular census tract, then by default the LUST was given a 0 km distance measurement and assigned to the LUST “host” group.
We grouped the census tracts based on their distance to the nearest LUST (also known as the buffer method) at 0, 0.5 km, 1 km, and 5 km. We calculated the population percentages within each group (Gper) which was used to compare the percentage of SOD (Pper):
For example, the percentage of all races (Pper) living within 1 km to LUST was compared with percentage of white in the buffer among all white in the states (Gper). The one-way proportionality test was used to test equality-based hypotheses. For indices, per capital income and median household income, the median of those features within the buffer was used to compare the median outside of the buffer.
We utilized a simple quartile-based model to dichotomize continuous SOD measures for contiguous table analyses with mean LUST-CT distance. First, discrete values for continuous SOD measures were derived from lower quartile (Q1) and upper quartile (Q4) boundaries. We then grouped census tracts by their relative SOD Q1 and Q4 values, and calculated a mean LUST-CT distance for each quartile category. Lastly, we assessed interquartile variation for each SOD measure.
We employed simple linear regression (SLR) to assess the direction and magnitude of the association between each LUST-CT distance (dependent variable) and corresponding composition of race and socioeconomic measures (i.e., each SOD feature represents an independent variable). Statistically significant (p<0.05) regression coefficients were used to estimate the average increase in LUST-CT distance associated with a 1% increase in the proportion of each SOD measure. The aforementioned calculations and hypothesis testing were performed using R version 2.15.0. 20
Results
According to 2010 survey data, there were 5,773,552 people living in MD with 61.1% white and 30.0% black. Of the total population, 8.6% live below the poverty line while 12.2% did not receive a HS education. There were 664 LUSTs located in 405 census tracts in Maryland which had 1390 census tracts available for sociodemographic assessment after deleting 16 census tracts without people. We constructed a choropleth map using ArcGIS 10 that shows the distribution of remediated (closed) LUSTs in relation to percent living in poverty in Maryland in 2011 (Figure 1). The map shows that as percent poverty increased, the number of LUSTs also increased.
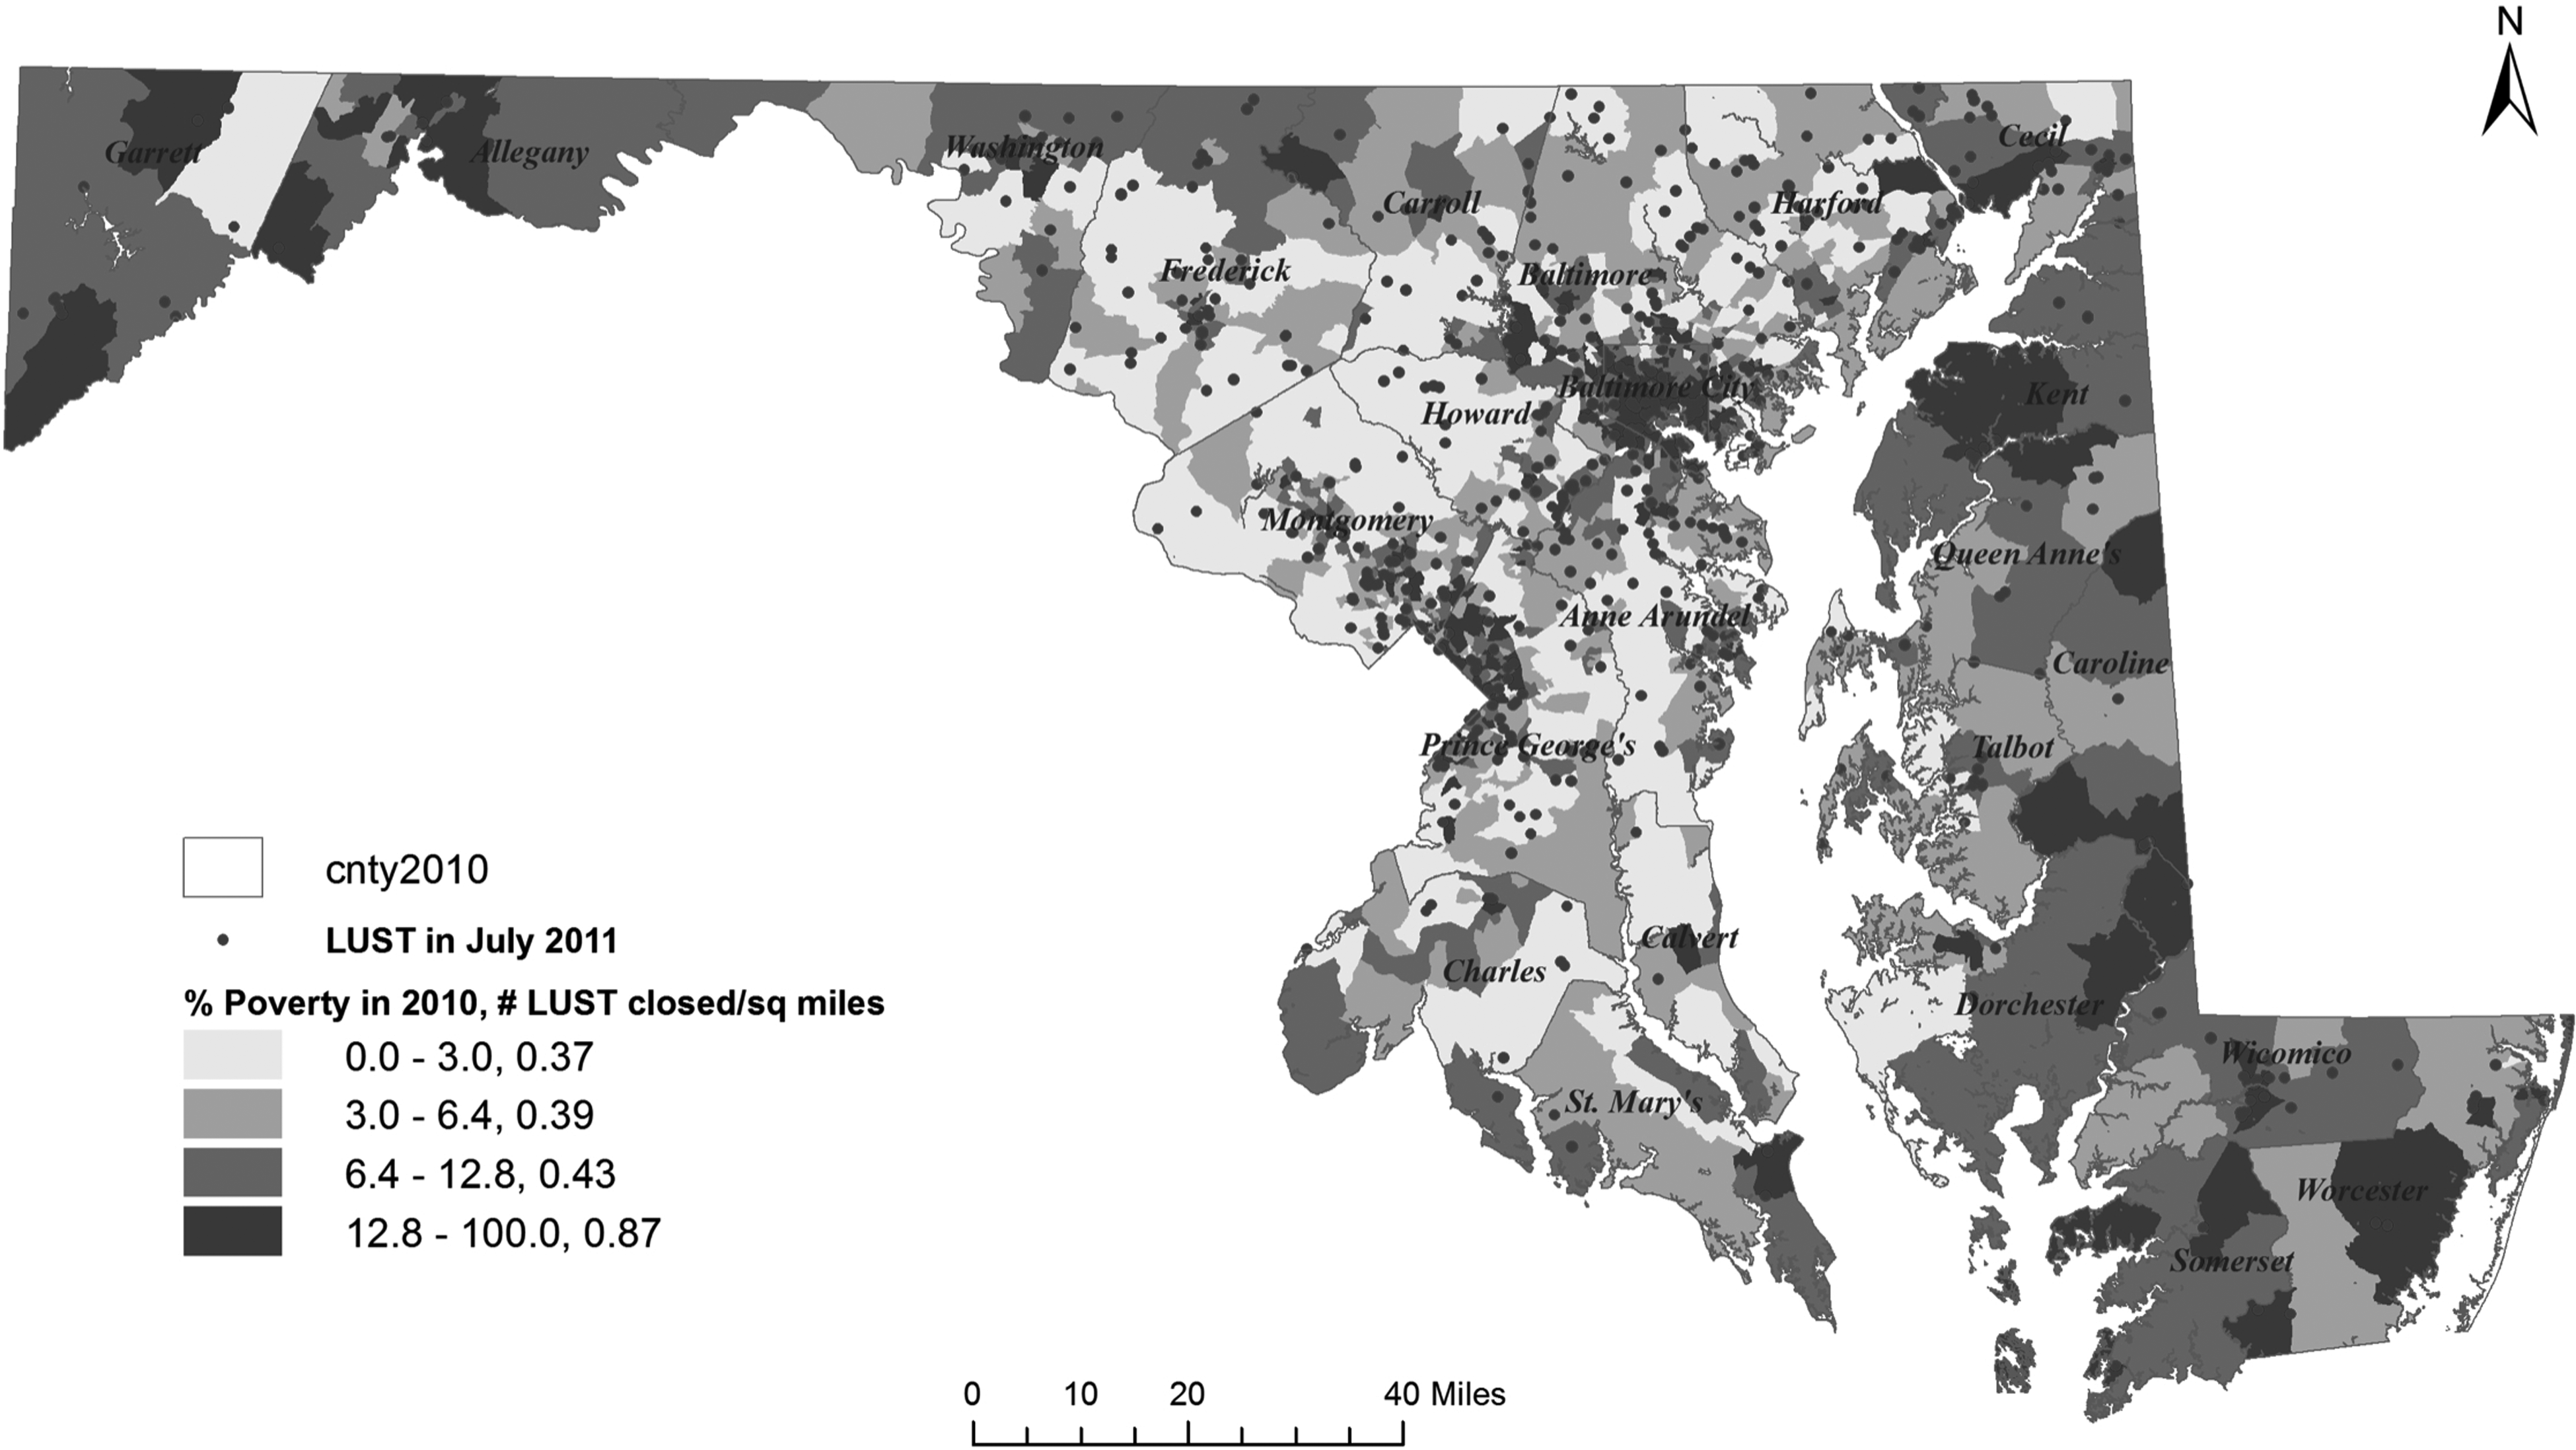
LUSTs in Maryland (2011) by percentage of residents living in poverty.
Buffer results
We did not observe a disproportionate burden of LUSTs for different racial/ethnic groups within host census tracts (Table 1). However, we did observe significant differences in burden by race/ethnicity in census tracts within 5 km to the nearest LUST (p-value<0.01). These results illustrate a “lag” in the effect of the association between LUSTs and race/ethnicity meaning the magnitude of the effect was greater in the 5 km buffer than in the host census tract. Additionally, the Gper homes built before 1950 was the only SOD measure higher than the Pper for all distance bands. Conversely, Gper homeownership was the only SOD measure significantly lower than Pper except for host tracts.
p-value<0.01, # XX(YY), XX is the median of SOD in census tracts within the buffer, YY is the median outside of the buffer.
HS, high school.
Turning to the deprivation and diversity indices in Table 1, the median Townsend Index was almost two times lower (−0.96 vs −1.88) when we compared census tracts within 5 km of a LUST to tracts 5 km or more from a LUST (Table 1). While both values indicate relative material affluence, census tracts located farther away from LUSTs had a higher percentage of affluent individuals. The median Diversity Index was not appreciably different within or outside of the host census tract, .5 km buffer, and the 1 km buffer. However, it was 50% higher in tracts within 5 km of the nearest LUST compared to other areas more than 5 km from the nearest LUST. For median household income (MHH), the median MHH of census tracts within 5 km to the nearest LUST was $10,000 lower than the median MHH of tracts located more than 5 km to the nearest LUST.
Mean distance quartile results
Results in Table 2 indicate how mean LUST-CT distance values were correlated with increasing percentages of key SOD measures, modeled as low (Q1) and high (Q4) quartiles. When considering race, mean LUST-CT distance by % white in Q1 and Q4 was 0.75 km and 0.89 km, respectively. These results indicate that census tracts with a higher percentage of white residents were located farther from LUSTs. Similarly, positive correlations were also observed between mean LUST-CT distance and median household income (0.76 km to 0.87 km for Q1 and Q4, respectively) and for % homeownership (0.59 km to 0.93 km for Q1 and Q4, respectively).
HS, high school.
In contrast, to the trend previously noted, Table 2 demonstrates an inverse correlation between census tracts with a higher percentage of black and non-white residents and decreasing mean LUST-CT distance. Specifically, Q1 and Q4 mean LUST-CT distance values for % black were 0.85 and 0.76 and 0.9 and 0.73 for % non-white. Moreover, similar inverse correlations between decreasing mean LUST-CT distance and increasing SOD quartiles were also evident for other SES measures including: % homes built before 1950, poverty, unemployed, and persons with less than HS education. For % poverty, the mean distance from LUSTs to census tracts in Q1 (0.94 km) was almost 50% farther than the mean distance to census tracts in Q4 (0.65 km). We also observed inverse correlations for per capita income, deprivation index, and diversity index. Per capita income exhibited the smallest change in distance between quartiles (average distance of 0.8 km for Q1 and 0.78 km for Q4) and the Townsend Index (average distance of 0.98 km in Q1 and 0.6 km in Q4) showed the highest change, followed by the Diversity Index (average distance of 0.81 km in Q1 and 0.74 km in Q4).
Regression results
Results from simple linear regression revealed statistically significant (p<0.05) associations for most race/ethnicity and socioeconomic factors (Table 3). The SOD measures for which power was insufficient to eliminate associations based on chance alone, were limited to: % black, Diversity index, per capita income, and median household income. Conversely, statistically significant positive associations were observed for % white and % homeownership. Overall, these findings show that for every unit increase in distance from a LUST, socioeconomic status decreased for individuals in that census tract. As for the effect of race, for every 1% increase in white population, there was an increase of 0.003 km to the nearest LUSTs (Table 3). Conversely, we observed the opposite for % non-white (Beta=−0.003; p<0.05) and similar trends for % poverty, % < than HS education, % homes built before 1950, % black in poverty, and % black less than HS education (Beta=−0.012, −0.011, −0.006, −0.014, −0.015, respectively).
HS, high school.
For income-related variables, a statistically significant (p<0.0001) decrease in deprivation was observed with an increase of distance between a census tract and the nearest LUST (Beta=−0.050) (Table 3). Furthermore, we observed a positive relationship between homeownership and distance to the nearest LUST. Specifically, for a 1% increase in percent homeownership in a census tract, the distance to the nearest LUST increased by 0.006 km. In regards to diversity, though the change was not statistically significant (p=0.152) for every 0.1 unit increase in diversity, the distance between a census tract and the nearest LUST decreased by 0.023 km.
Discussion
This study employed GIS-based approaches to investigate the influence of race and socioeconomic status on residential proximity to one or more LUSTs across MD 2010 census tracts. It documents the geospatial burden of LUSTs in Maryland for host census tracts and also areas within 5 km of the nearest LUST. We observed statistically significant inverse relationships between proximity to the nearest LUST and % non-white, % persons in poverty, % less than HS education, and economic deprivation. This work builds on and extends our previous work in Maryland and South Carolina documenting and assessing burden disparities of pollutogens (e.g., TRI facilities, brownfields, Superfund sites, LUSTs, industrial animal operations, NPDES permitted facilities) along the lines of race, class, and place.21–26
Overall, results presented here show that the sociodemographic patterns related to race/ethnicity, poverty status, neighborhood location, and dwelling measures tend to be associated with distance from one or more LUSTs. Residents who live in neighborhoods with one or more LUSTs may have potential exposure and health risks. In urban communities, plumes from leaking underground storage tanks may contaminate soil, rivers and streams, and groundwater. Individuals who recreate in rivers and streams particularly through low contact activities (e.g., kayaking, rowing, paddling, canoeing, and boating) and high contact (e.g., swimming) may be exposed to chemicals through ingestion, inhalation, or skin resulting in deleterious acute effects (i.e., skin rashes) and chronic effects (i.e., cancer). Additionally, fish can accumulate harmful LUST chemicals in their fatty tissue presenting health risks for subsistence fishers who consume contaminated fish. Furthermore, individuals who live in rural areas near LUSTs also have exposure and health risks particularly those individuals whose well water is used for drinking may have been contaminated by leakage from one or more nearby LUSTs.
To assure these results were accurate, we first had to select the most appropriate scale and approach for assessing the association between the location of a LUST and SOD composition. Therefore, we selected 2010 census tract data for the analysis. Next, we selected mean distance measurement, as the most reliable area-weighting method for describing differential burden of LUSTs based on the composition of each tract's population. 27 Given that all GIS-based approaches to this end have limitations and uncertainties that could result in the misclassification of people based on their distance from a particular LUST, we adopted mean LUST distance because it is the approach least susceptible to misclassification bias. 28
Future research should examine the interrelationships among race, socioeconomic status, dwelling and neighborhood status (rural or urban) in more detail using multivariate regression. This research should also further characterize these relationships by using in-depth groundwater contamination and site-specific LUST remediation data. In addition, more information is needed about why specific LUSTs were backlogged for remediation when the vast majority of sites in the state have been cleaned and closed. Finally, more assessment of residential proximity to a LUST, exposure to chemical plumes, and relevant health outcomes is required.
Conclusion
This study has shown that there are racial/ethnic and SES disparities in the distribution of LUSTs in the state of Maryland in host census tracts and areas located 5 km of the nearest site. Additional research is required to further understand how the disproportionate burden of LUSTs may lead to differential exposure risks for nearby populations and compound existing health disparities. In future research, site-level exposure modeling and remediation data will be included in analyses to further characterize the burden of LUSTs in host communities. Future investigations will include hydrogeological determinants of exposure risks from LUSTs still backlogged for remediation in Maryland, especially for rural counties in the state where populations utilize groundwater for drinking water supply. Additional research will be performed to understand the potential economic impact and community benefit of including the redevelopment of closed LUSTs in comprehensive revitalization programs in environmental justice communities in the state of Maryland.
Footnotes
Author Disclosure Statement
The authors have no conflicts of interest or financial ties to disclose.