
Abstract
Abstract
This study aims to contribute to environmental justice research by examining how Native Hawaiians and Pacific Islanders (NHPIs), a relatively small minority group, are disproportionately impacted by environmental toxins. Proximity to three different environmental hazards is considered: toxic waste, industrial air pollution, and freeways. 2010 U.S. Census, Superfund, Toxic Release Inventory, and Los Angeles Department of Regional Planning data are used to analyze where NHPI populations live relative to these environmental hazards in Los Angeles County, California. Findings show that NHPI neighborhoods have high rates of being located near toxic waste, industrial air pollution, and freeways when compared to non-Hispanic whites and other racial/ethnic groups. Further analysis reveals that high percentages of the total NHPI population in Los Angeles are potentially exposed to toxic waste, industrial air pollution, and freeway pollution, placing them at risk for experiencing poor health due to environmental degradation.
Introduction
T
However, minorities that make up a small percentage of the population are often overlooked in studies of environmental justice because it is more difficult to develop methods to accurately characterize their communities in order to compare their level of exposure with that of other groups. Native Hawaiians and Pacific Islanders (NHPIs) are one such group. NHPIs make up only 0.4% of the total U.S. population. However, this population has already been impacted greatly by the effects of climate change and human-induced ecosystem degradation. This study contributes to the environmental justice movement by highlighting how NHPI communities are disproportionately impacted by environmental toxins.
Native Hawaiians and Pacific Islanders in the United States
NHPI is defined as people having origins in any of the original peoples of Hawaii, Guam, Samoa, or other Pacific Islands. 8 There were 1.2 million NHPIs living in the United States in 2010. Los Angeles County, California has the largest population of NHPIs in the United States outside of Honolulu, Hawaii with a population of over 54,000. Because NHPIs are a small proportion of the total U.S. population, they are usually combined with Asians in demographic research. However, NHPIs have different migration histories, settlement patterns, and health outcomes than Asians. Since 2000, NHPIs have been considered as a separate racial group from Asian Americans per Directive 15 of the Office of Management and Budget.
NHPIs have been shown to have worse cancer outcomes, higher rates of respiratory disease, and high rates of cardiovascular disease in comparison to other racial/ethnic groups. 9 NHPIs tend to have lower median family income: $59,521 in comparison to $67,892 for non-Hispanic whites. NHPI families also experience greater levels of poverty: 17% in comparison to 10.6% of non-Hispanic white families.
Throughout history, NHPIs have been victims of human-induced environmental degradation. U.S. military testing of nuclear bombs in Micronesia in the 1940s and 50s resulted in the exposure of thousands of Pacific Islanders to nuclear fallout. 10 The Pacific Islands have also experienced the harsh effects of rapid climate change, with severe storms and rising sea levels completely altering the traditional way of life. To date, there are no studies that have evaluated environmental justice issues for this racial group in the United States.
Previous research indicates that Asians/Pacific Islanders experience environmental injustice. In U.S. metropolitan areas, Asians/Pacific Islanders make up 6.8% of the population in neighborhoods hosting hazardous waste facilities, compared to 4.4% in non-host neighborhoods. 11 Asians/Pacific Islanders in the U.S. are more likely to live in counties with high levels of chemical emissions from Toxic Release Inventory sites than whites. 12 In addition, Asian/Pacific Islander mothers are twice as likely to live in the most polluted counties as white mothers. 13 One study revealed that low-income Asians/Pacific Islanders in southern California have the highest estimated lifetime cancer risk from air pollution exposure when compared to other groups across race and socioeconomic status. 14
However, it is important to note that none of the above studies examine Pacific Islanders separately from Asians. One study that disaggregated Pacific Islanders from Asians found that a higher proportion of Pacific Islanders live in counties with pollution exceeding the federal air quality standards as compared to Asians and other ethnic groups at all income levels. 15 Therefore, this study aims to contribute to existing literature by investigating environmental justice for NHPIs separately from Asians and other ethnic groups.
Residential proximity to environmental hazards
This study examines NHPI residential proximity to three different environmental hazards: toxic waste sites, industrial air pollution, and freeway air pollution. Toxic waste sites are synonymous with Environmental Protection Agency (EPA) Superfund sites in this study. 16 Living near Superfund sites may cause reproductive harm and poor birth outcomes.17,18,19 Industrial air pollution has been associated with increased risk of cancer and respiratory disease. 20 Exposure to air toxins from major transportation routes is extremely detrimental to health, increasing risk of asthma, heart disease, and lung cancer.21,22,23,24 The toxicity of the air around freeways is largely due to high levels of particulate matter—a complex mixture of extremely small particles and liquid drops released from car and truck movement on major freeways. 25 Research conducted in Los Angeles has shown that areas within a 150 meter distance from freeways are most impacted by harmful particulate matter. 26
Methods
Four datasets were merged for this analysis. Data come from the 2010 U.S. Census, the EPA Superfund, the EPA Toxic Release Inventory (TRI), and the Los Angeles County Department of Regional Planning. The locations of toxic waste sites, TRI sites, and freeways were geocoded to maps using the geographic information systems (GIS) software ArcGIS v. 10.1. 27
Mapping environmental hazards
Toxic waste sites that were not cleaned up and still being monitored as of August 2011 were geocoded (954 Superfund sites). One mile Euclidean buffer zones were created around toxic waste sites. 28 Industrial air polluters in Los Angeles County in 2010 that pose some estimated health risk were also geocoded (391 industrial air polluters). Half mile Euclidean buffers were created around industrial air polluters; these areas are likely the most affected by airborne chemical emissions.29,30 Lastly, buffer zones of 150 meters along freeways were created. Research has shown that concentrations of fine particulate matter are highest in the 150 meters closest to freeways.31,32
U.S. Census blocks, the smallest geographic units publicly available, are the main units of analysis. 33 Any larger geographic unit, such as census tracts or zip codes, would cover too large of an area and total population to make accurate predictions of where NHPIs live. Islands and Census blocks with no inhabitants were excluded, resulting in 75,030 blocks used for analysis. If any part of a block fell in the buffer zone of at least one hazardous site, it was considered affected by that environmental hazard.
Defining and describing NHPI neighborhoods
Defining and describing where NHPIs live proved to be a challenge in itself. On average, blocks in Los Angeles County contain only 0.3 NHPIs, far fewer than to other groups such as Asians (mean=18) or African Americans (mean=11). Many studies comparing neighborhoods define a minority neighborhood as one in which over 50% of the population identifies with the racial/ethnic group of interest. This is problematic for NHPIs, since this 50% cutoff excludes some blocks with the largest populations of NHPIs. For example, the largest population of NHPIs (124 people) makes up only 15% of the total population of the block.
Therefore, this study employs a novel approach: defining NHPI neighborhoods as census blocks with the top one-percent largest populations of NHPIs. Of all census blocks containing at least one NHPI resident, the 99th percentile for NHPI population size was identified (23 NHPIs). Any census block with 23 or more NHPI residents is considered an NHPI neighborhood using this criterion. This provides a more accurate picture of where NHPIs live, since the largest NHPI populations may still make up less than 50% of the total population of a block. This also allows for comparisons to other racial/ethnic groups in census blocks. I used this method to define non-Hispanic white neighborhoods (blocks with 324 or more non-Hispanic whites), black neighborhoods (blocks with 164 or more blacks), Hispanic/Latino neighborhoods (blocks with 500 or more Hispanics/Latinos), and Asian neighborhoods (blocks with 258 or more Asians).
Comparing exposed areas to total area
In addition to determining which racial/ethnic neighborhoods were exposed, I wanted to determine if the racial/ethnic composition of populations living near to environmental hazards differs from that of the total population in the study area. For this analysis, the study area was confined to the South Bay and South Service Planning Areas (SPAs) where the NHPI neighborhoods tend to cluster. SPAs are county divisions used to implement public health policies and programs in Los Angeles County. Focusing on this region of Los Angeles County limited analysis to a highly diverse urban area, excluding areas in Los Angeles County that are sparsely populated and more rural. This area includes the coastal areas of southwest Los Angeles, including the Port of Los Angeles in Long Beach and the cities of Inglewood, Hawthorne, Torrance, Carson, Compton, Lynwood, and Paramount.
I used areal interpolation to estimate population characteristics in affected areas. Areal interpolation allows for the extraction of demographic data at the census block-level to the areas affected by environmental hazards. This method has been described in detail by Goodchild et al. 34 Briefly, it involves transferring spatial data from one set of polygons to another. Using this method, comparisons could be made between the populations living near environmental hazards to the total population.
Data from ArcGIS was exported to StataSE v.12 for statistical analysis. 35 T-tests were used to determine if the demographics inside the buffer of environmental hazards are different from the demographics of the total population in South Bay and South SPAs. In addition, the proportions of all people within each race group that live by each environmental hazard were calculated. Chi-square tests determined whether the frequencies of living near hazards for the various race groups are significantly different from one another. If they were, this would suggest that the burden of environmental hazards is not equally or randomly distributed among race groups.
Results
NHPI blocks in Los Angeles County
There are 81 blocks with that have 23 or more NHPI residents. The locations of these blocks are shown in Figure 1. The largest clusters of NHPI neighborhoods are in the South Bay and South SPAs, in and around the cities of Carson, North Long Beach, and Hawthorne.
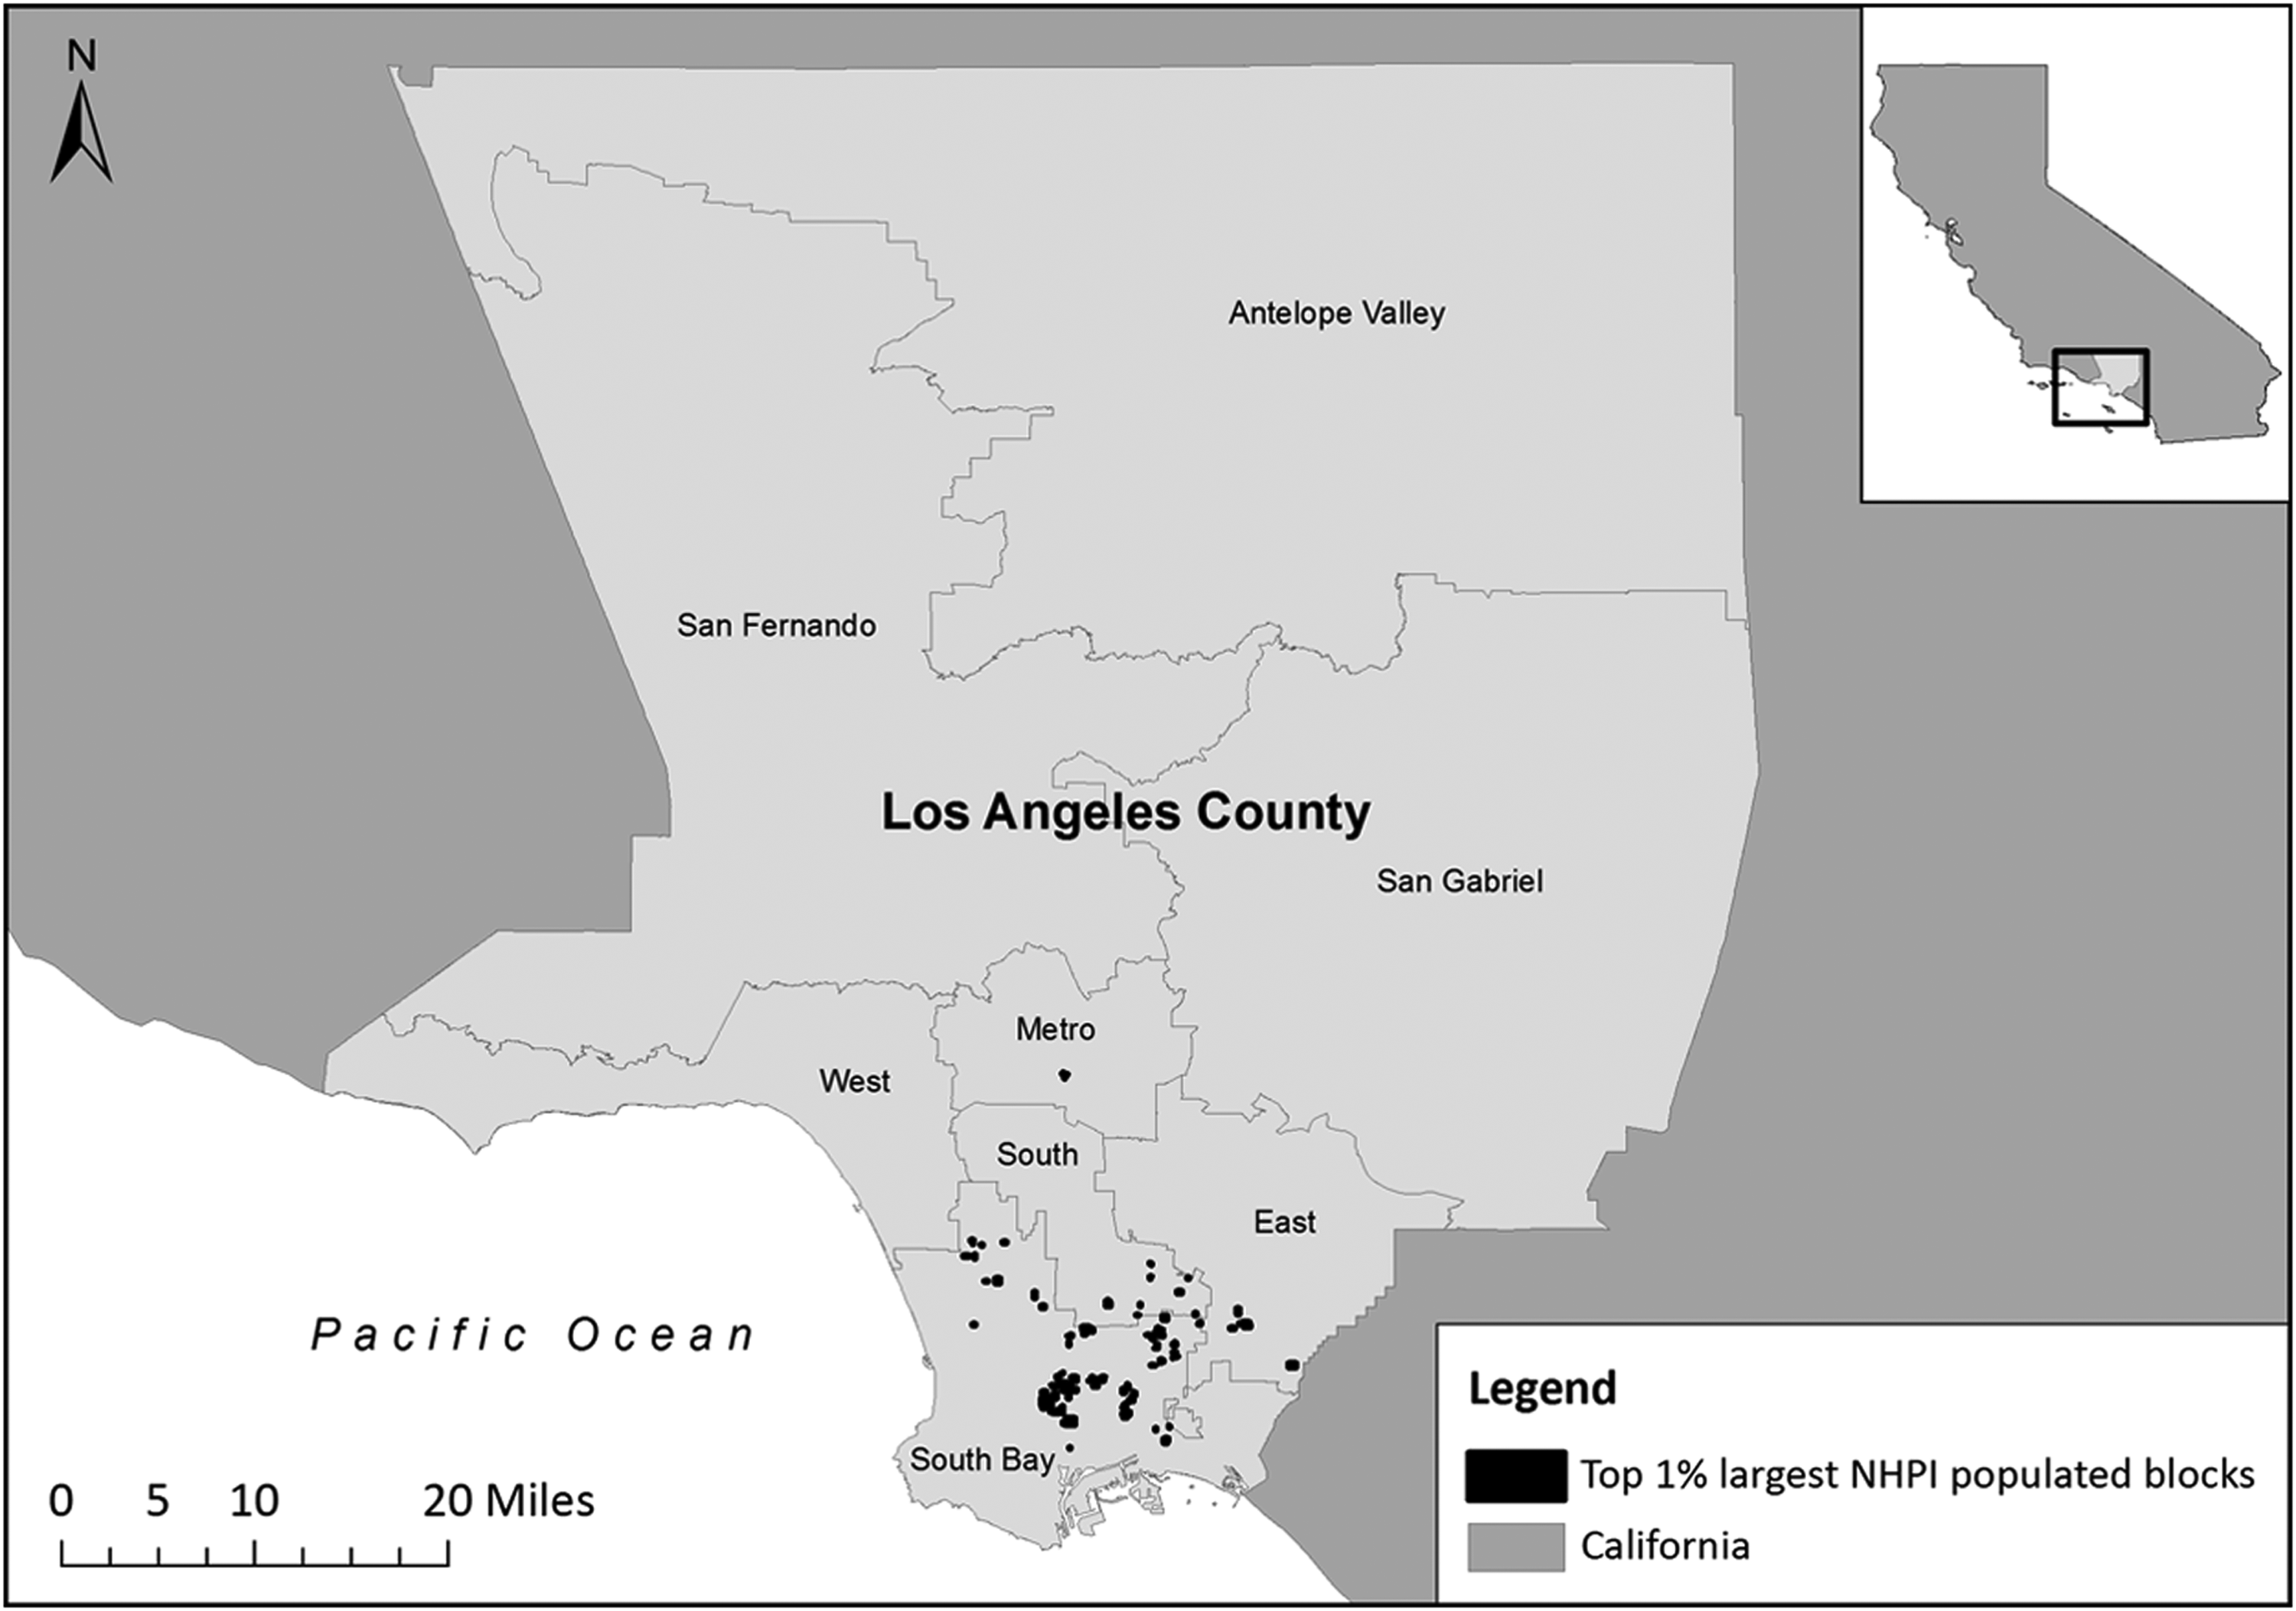
Map of NHPI neighborhoods in Los Angeles County. NHPI: Native Hawaiian and Pacific Islander. Note: NHPI neighborhoods are defined blocks with NHPI population size in the 99th percentile or higher in Los Angeles County (i.e., blocks with 23 or more NHPIs).
Table 1 compares the descriptive statistics in NHPI blocks compared to all populated blocks in Los Angeles County. NHPI blocks tend to have greater population density and have larger populations of other minorities (blacks, Hispanics/Latinos, and Asians) than the average Los Angeles County block. NHPI blocks also have a greater proportion of renters than the average Los Angeles County census block, indicating that these neighborhoods may have lower socioeconomic status. These initial findings indicate that NHPIs follow a similar pattern as many other minority groups in Los Angeles, tending to live in more diverse and densely populated urban areas with lower socioeconomic status.
NHPI, Native Hawaiian and Pacific Islander; SD, standard deviaiton.
Note: NHPI blocks are defined blocks with NHPI population size in the 99th percentile or higher in Los Angeles County (i.e., blocks with 23 or more NHPIs).
Neighborhood proximity to environmental hazards
Figure 2 compares the rates of proximity to environmental hazards across the following racial/ethnic neighborhoods: NHPI, black, Hispanic/Latino, Asian, and non-Hispanic white. These racial/ethnic neighborhoods are defined as Census blocks that contain a population of residents of a particular race that is in the 99th percentile or above for the largest population for that racial/ethnic category in a block.
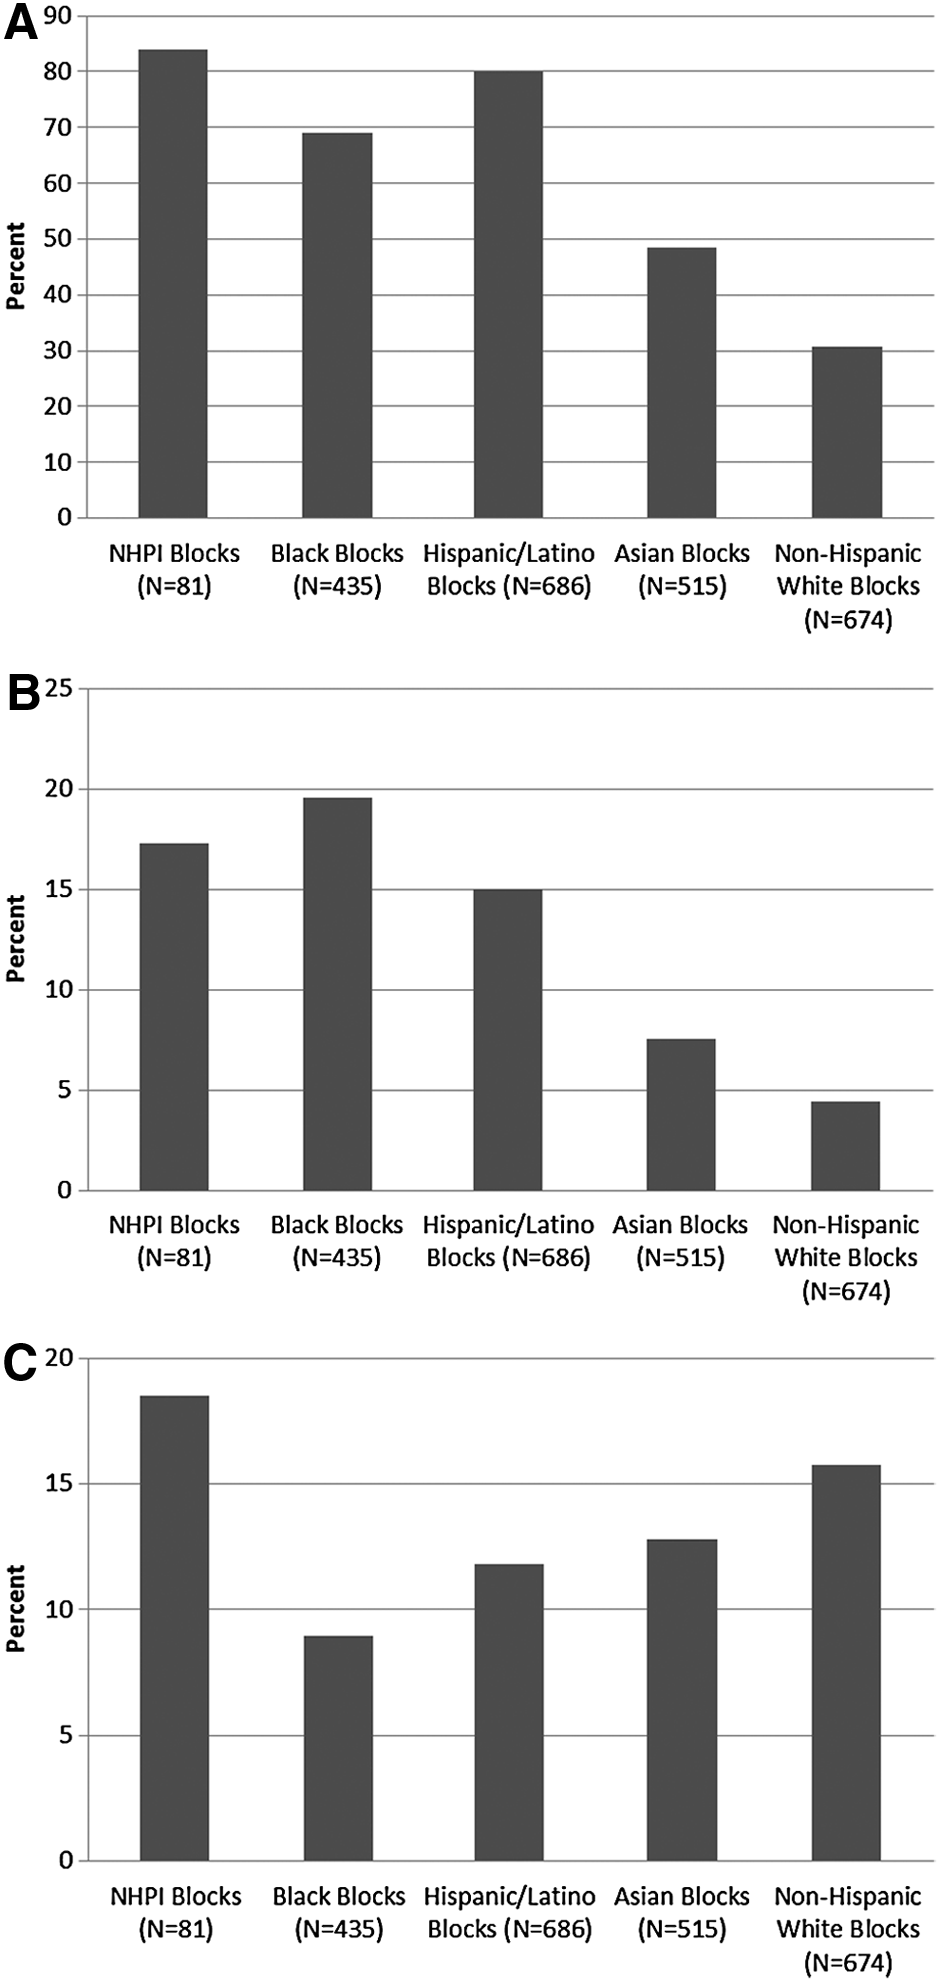
Percentages of blocks by race that are proximal to environmental hazards. Note: Blocks fall into one of the above race categories if the population size of that race is in the 99th percentile or higher for that racial category. EPA: Environmental Protection Agency; NHPI: Native Hawaiian and Pacific Islander.
NHPI neighborhoods are greatly impacted by all three environmental hazards. Figure 2A shows that 84% (68 out of 81) of NHPI neighborhoods are located within one mile of a Superfund site. By comparison, 69% of black, 80% of Hispanic/Latino, 49% of Asian, and 31% of non-Hispanic white neighborhoods are within this proximity. Figure 2B shows that NHPIs have the second highest rate of being located within one-half mile of industrial air polluters (17%), behind blacks (20%). Fifteen percent of Hispanic/Latino neighborhoods, 8% of Asian neighborhoods, and 5% of non-Hispanic white neighborhoods are near industrial polluters. Figure 2C indicates that 19% of NHPI neighborhoods are located within 150 meters of a freeway, compared to 9% of black, 12% of Hispanic/Latino, 13% of Asian, and 16% of non-Hispanic white neighborhoods. As noted earlier, proximity of 150 meters to a freeway confers high exposure to fine particulate matter. 36 Many of the NHPI neighborhoods are clustered around major freeways, especially around the 110, 405, 710, and 91 freeways. These freeway routes are known to emit high levels of diesel pollution from trucks moving cargo from the ports of Los Angeles to the rest of the United States. 37
Population characteristics in exposed areas versus total area
Table 2 shows the demographic characteristics of all of South Bay and South SPAs and for the areas that are affected by environmental hazards. South Bay and South SPAs cover a land area of 697 square kilometers with 2.5 million residents.
SPA, Service Planning Area; NHPI, Native Hawaiian and Pacific Islander.
The population that lives within one mile of Superfund sites consists of a higher proportion of Asians, NHPIs, and all other races, and a lower proportion of non-Hispanic whites and blacks than the total population in South Bay and South SPAs. There is a higher rate of renters and slightly higher vacancy rate, indicating lower socioeconomic status.
The population that lives within a half mile of industrial air polluters has a higher proportion of NHPIs and all other races, and a lower proportion of non-Hispanic whites and blacks than the total population. There are smaller proportions of renter occupied and vacant housing within a half mile of industrial air polluters than the total area, indicating slightly higher socioeconomic status.
The population that lives within 150 meters of freeways has a higher proportion of blacks, NHPIs, and all other races, and a lower proportion of non-Hispanic whites and Asians than the total population. There are slightly fewer renter occupied housing units nearby freeways than all of South Bay and South SPAs. The vacancy rate near freeways is not significantly different than the overall vacancy rate. It is unclear whether the areas near freeways have higher or lower socioeconomic status.
The total percentages of each race that lives near to the environmental hazards are shown in Table 3. The chi-square analysis shows that the frequency of living in areas nearby environmental hazards is not randomly distributed among race groups. NHPIs have very high proportions of the population living near Superfund sites (82%), industrial air polluters (12%), and freeways (5%) in Los Angeles County. Other minority groups including blacks and Asians also have high rates. Non-Hispanic whites tend to have relatively lower rates of living near environmental hazards. NHPIs have rates that are among the highest in regards to residing in areas potentially affected by sources of environmental pollution.
SPA, Service Planning Area; NHPI, Native Hawaiian and Pacific Islander.
Discussion
This study shows that NHPI neighborhoods in Los Angeles County are greatly proximal to toxic waste sites, industrial air polluters, and freeways. The largest NHPI neighborhoods have among the highest rates of proximity to toxic waste, industrial air polluters, and freeways when compared to other race groups. Further analysis shows that in particular, NHPIs are overrepresented in areas affected by environmental hazards. This result is similar to findings that Asians and Pacific Islanders are over-represented in counties with high levels of pollution.38,39,40 However, the present study is unique in that it examines NHPI rates of proximity separately from Asians and other minority groups.
Given their high likelihood of living near environmental hazards in Los Angeles County, it is possible to speculate that exposure to environmental toxins may help to explain some of the poor health outcomes seen among NHPIs. 41 There is still much work to be done to make this connection. In addition, we need to account for health behaviors and routes of exposure beyond place of residence. Nevertheless, living in these neighborhoods may have direct impact on health and quality of life.
Limitations
One limitation of this study is the inability to test environmental exposure. Although I am able to show residential proximity to environmental hazards, this does not indicate that the populations living within buffer zones are actually exposed to toxins or experience poor health as a result. An underlying assumption of this study is that NHPIs are affected by environmental hazards where they live. I do not take into account how much time these individuals spend in their place of residence versus place of work or transportation to work. Some research suggests that the people who are most likely to be affected in the place of residence are young children and the elderly, who spend more time in the home and are likely to be sensitive to pollution. 42 That said, working adults do spend some time at home and even short term exposures to some pollutants may be hazardous.
This study did not use data on topography, wind patterns, or exact types of chemicals released from each hazardous site. Further analysis using these more refined measures is warranted. I relied on Euclidean buffers that were the same size for each type of hazard. This assumes that each toxic site has a similar level of toxicity and that risk is uniform within the buffer zones. However, I based my choice of buffer sizes based on relevant research and attempted to be conservative by choosing smaller buffer zones to determine exposed areas.
Finally, this study is cross-sectional. It examines environmental exposures at one point in time, which raises questions about self-selection into neighborhoods. This does not negate the fact that this study shows that currently, NHPI communities seem to be heavily proximal to environmental pollutants. This information may be informative to local communities for future planning.
Policy and research implications
Efforts should be made to promote NHPI participation in processes that create environmental policies. Policymakers in Los Angeles County and elsewhere should be aware of groups like NHPIs that, although small, are significantly affected by environmental degradation. NHPI communities can be strengthened through increasing capacity to combat and/or mitigate environmental polluters. By increasing community capacity, NHPI communities can advocate for their own desires for safe neighborhoods, thriving economies, and healthy environments.
Footnotes
Acknowledgments
I thank my mentors Gilbert C. Gee, Ph.D. and Leobardo Estrada, Ph.D. for their continual guidance and support, and for providing feedback on previous versions of this manuscript. I also thank Helene Chokron Garneau, M.P.H. for her input on a prior version.
Author Disclosure Statement
The author has no conflicts of interest or financial ties to disclose. This research was supported by the University of California, Los Angeles (UCLA) Graduate Division, Graduate Summer Research Mentorship Program.
1
R.D. Bullard, Unequal Protection: Environmental Justice and Communities of Color (1994).
2
R.D. Bullard, Dumping in Dixie: Race, Class and Environmental Quality, 3rd ed. (Westview Press, 2000).
3
R.D. Bullard et al., “Toxic Wastes and Race at Twenty: 1987–2007,” United Church of Christ Justice and Witness Ministries (2007).
4
Commission for Racial Justice: United Church of Christ, “Toxic Wastes and Race in the United States,” McGurty, 1987.
5
G. W. Evans and E. Kantrowitz, “Socioeconomic Status and Health: The Potential Role of Environmental Risk Exposure,” Annual Review of Public Health 23 (2002).
6
U.S. General Accounting Office, “Siting of Hazardous Waste Landfills and Their Correlation with Racial and Economic Status of Surrounding Communities,” (Washington, DC: U.S. Government Printing Office, 1983).
7
G. C. Gee and D. C. Payne-Sturges, “Environmental Health Disparities: A Framework Integrating Psychosocial and Environmental Concepts,” Environmental Health Perspectives 112 (2004).
8
L. Hixson, B.B. Hepler, and M.O. Kim, “The Native Hawaiian and Other Pacific Islander Population: 2010,” 2010 Census Briefs (U.S. Census Bureau, 2012).
9
U.S. Department of Health and Human Services Office of Minority Health, “Native Hawaiians and Pacific Islanders Profile,”<
10
J. Dibblin, Day of Two Suns: U.S. Nuclear Testing and the Pacific Islands (New Amsterdam, 1988).
11
Bullard et al., “Toxic Wastes and Race at Twenty: 1987–2007.”
12
Susan A. Perlin et al., “Distribution of Industrial Air Emissions by Income and Race in The United States: An Approach Using the Toxic Release Inventory,” Environmental Science & Technology 29 (1995).
13
T. J. Woodruff et al., “Disparities in exposure to air pollution during pregnancy,” Environmental Health Perspectives 111 (2003).
14
R. Morello-Frosch, M. Pastor, and J. Sadd, “Environmental Justice and Southern California's “Riskscape,” Urban Affairs Review 36 (2001).
15
Lauren Gordon, Devon Payne-Sturges, and Gilbert Gee, “Environmental Health Disparities: Select Case Studies Related to Asian and Pacific Islander Americans,” Environmental Justice 3 (2010).
16
U.S. Environmental Protection Agency, “Superfund: Cleaning Up the Nation's Hazardous Wastes Sites,”<
17
A. Baibergenova et al., “Low Birth Weight and Residential Proximity to PCB-contaminated Waste Sites,” Environmental Health Perspectives 111 (2003).
18
Aftab Ala et al., “Increased Prevalence of Primary Biliary Cirrhosis Near Superfund Toxic Waste Sites,” Hepatology 43 (2006).
19
L. Suarez et al., “Maternal Exposures to Hazardous Waste Sites and Industrial Facilities and Risk of Neural Tube Defects in Offspring,” Annals of Epidemiology 17 (2007).
20
C. Arden Pope et al., “Lung Cancer, Cardiopulmonary Mortality, and Long-term Exposure to Fine Particulate Air Pollution,” JAMA: The Journal of the American Medical Association 287 (2002).
21
N. Fann et al., “Estimating the National Public Health Burden Associated with Exposure to Ambient PM2.5 and Ozone,” Risk Analysis 32 (2012).
22
J. Lepeule et al., “Chronic Exposure to Fine Particles and Mortality: An Extended Follow-up of the Harvard Six Cities Study from 1974 to 2009,” Environmental Health Perspectives 120 (2012).
23
K. E. Nachman and J. D. Parker, “Exposures to Fine Particulate Air Pollution and Respiratory Outcomes in Adults Using Two National Datasets: A Cross-sectional Study,” Environmental Health 11 (2012).
24
Pope et al., “Lung Cancer, Cardiopulmonary Mortality, and Long-term Exposure to Fine Particulate Air Pollution.”
25
U.S. Environmental Protection Agency, “Particulate Matter (PM),”<
26
Yifang Zhu et al., “Concentration and Size Distribution of Ultrafine Particles Near a Major Highway,” Journal of the Air & Waste Management Association 52 (2002).
27
ESRI, ArcGIS Desktop: Release 10, (Redlands, CA: Environmental Systems Research Institute, 2011).
28
Suarez et al., “Maternal Exposures to Hazardous Waste Sites and Industrial Facilities and Risk of Neural Tube Defects in Offspring.”
29
J. Chakraborty, “The Geographic Distribution of Potential Risks Posed by Industrial Toxic Emissions in the U.S,” Journal of Environmental Science & Health; Part A, Toxic/hazardous Substances & Environmental Engineering 39 (2004).
30
Suarez et al., “Maternal Exposures to Hazardous Waste Sites and Industrial Facilities and Risk of Neural Tube Defects in Offspring.”
31
Zhu et al., “Concentration and Size Distribution of Ultrafine Particles Near a Major Highway.”
32
L. Perez et al., “Chronic Burden of Near-roadway Traffic Pollution in 10 European Cities (APHEKOM network),” European Respiratory Journal 42 (2013).
33
U.S. Census Bureau Geography, “Geography: 2010 Geographic Terms and Concepts,”<
34
Michael F Goodchild, Luc Anselin, and Uwe Deichmann, “A Framework for the Areal Interpolation of Socioeconomic Data,” Environment and Planning A 25 (1993).
35
Stata Statistical Software: Release 12, StataCorp LP, College Station, TX.
36
Zhu et al., “Concentration and Size Distribution of Ultrafine Particles Near a Major Highway.”
37
Kathleen H Kozawa, Scott A Fruin, and Arthur M Winer, “Near-road Air Pollution Impacts of Goods Movement in Communities Adjacent to the Ports of Los Angeles and Long Beach,” Atmospheric Environment 43 (2009).
38
Perlin et al., “Distribution of Industrial Air Emissions by Income and Race in The United States: An Approach Using the Toxic Release Inventory.”
39
Woodruff et al., “Disparities in Exposure to Air Pollution During Pregnancy.”
40
Gordon, Payne-Sturges, and Gee, “Environmental Health Disparities: Select Case Studies Related to Asian and Pacific Islander Americans.”
41
Gee and Payne-Sturges, “Environmental Health Disparities: A Framework Integrating Psychosocial and Environmental Concepts.”
42
Michael Gochfeld and Joanna Burger, “Disproportionate Exposures in Environmental Justice and Other Populations: The Importance of Outliers,” American Journal of Public Health 101, no. S1 (2011).