
Abstract
Abstract
Scholars, policymakers, and activists widely accept that low-income neighborhoods tend to lack amenities such as healthy food and employment opportunities. Most studies concerning access to these amenities assume that residents either drive a personal vehicle or walk to their destination, yet many low-income urban residents rely on public transit systems to access supermarkets and employment. This is especially true in Baltimore, a city where 11% of households do not own a personal vehicle. This study provides a methodological approach to incorporate these concerns into spatial analyses of food deserts and employment access. The method uses metropolitan planning organization-defined transportation analysis zones (TAZ) as the unit of analysis and evaluates public transit access to healthy food (i.e., supermarkets) and employment opportunities from each TAZ. This analysis can be used by decision makers to identify areas for improvement and ensure that transit-dependent individuals have good access to employment and healthy food sources. Twenty-four TAZs are identified as high-priority for transit improvements, many of which include former industrial areas and company towns, demonstrating the impact of historical development patterns on current populations in Baltimore. Considering budget constraints of transit agencies, this methodological approach can be used to make cost-effective and impactful transit improvements that address the needs of transit-dependent residents.
Introduction
Experts and environmental justice (EJ) advocates increasingly acknowledge that EJ must consider not only exposure to environmental harms, but also access to amenities. 1 Consequently, access to healthy food and jobs has become a focus of EJ inquiry 2 and practice.3,4 Much of the research regarding issues of food and inequity has focused on food deserts. 5
However, two recent studies suggest the issue of food deserts is overstated,6,7 finding poor urban neighborhoods actually have more, not fewer, supermarkets than higher income neighborhoods. Studies such as these neglect two key considerations: first, they do not acknowledge the access limitations faced by public transit-dependent households and second, because they employ a national or regional scalar extent, they neglect neighborhood and street-level access issues. To better understand food deserts, we must examine context-specific conditions in areas where many residents are dependent on public transportation.
The literature overwhelmingly supports the idea that low-income neighborhoods tend to be amenity-poor. Nationally, low-income individuals often live in areas with few employment opportunities8,9,10,11,12,13 and few supermarkets that provide healthy food.14,15,16 Because of limited income, these individuals cannot relocate to wealthier areas where these necessities are located 17 or afford personal transportation 18 to travel to these areas. As a result, they spend considerable time and money to access jobs and healthy food using public transit. 19 This situation is well documented in cities across the country,20,21,22 including Baltimore. 23 Because of this dependence on public transit, it is essential to evaluate urban transit systems to find where gaps exist and improvements should be made.
This study examines public transit access to employment and healthy food within the Baltimore metropolitan area (Figure 1). Baltimore City includes 620,961 individuals, 20.1% of whom live below the poverty line 24 and 10.1% of whom are unemployed 25 (compared to U.S. averages of 13.8% and 7.9%, respectively). Once a thriving industrial center, the city now struggles with economic development. Previous research has found a correlation between industrial facilities and low-income residents; this research explores similar EJ patterns within the context of public transit accessibility. 26 Because a well-established multimodal transportation system exists and 11% of metro-area households do not own a car, Baltimore is an appropriate place to examine public transit access to jobs and healthy food. Several public transit options exist: a single light rail route running from the northern suburbs (through the urban core to the southern suburbs), a single metro line running from the center of the city eight miles northwest, and 73 bus routes throughout the region. The proposed east-west light rail line (Red Line) is also included in this study. Previous studies have found that food deserts affect both low-income and predominantly African American neighborhoods in Baltimore, 27 but no comprehensive study has yet examined public transportation access to healthy food and jobs in the region.
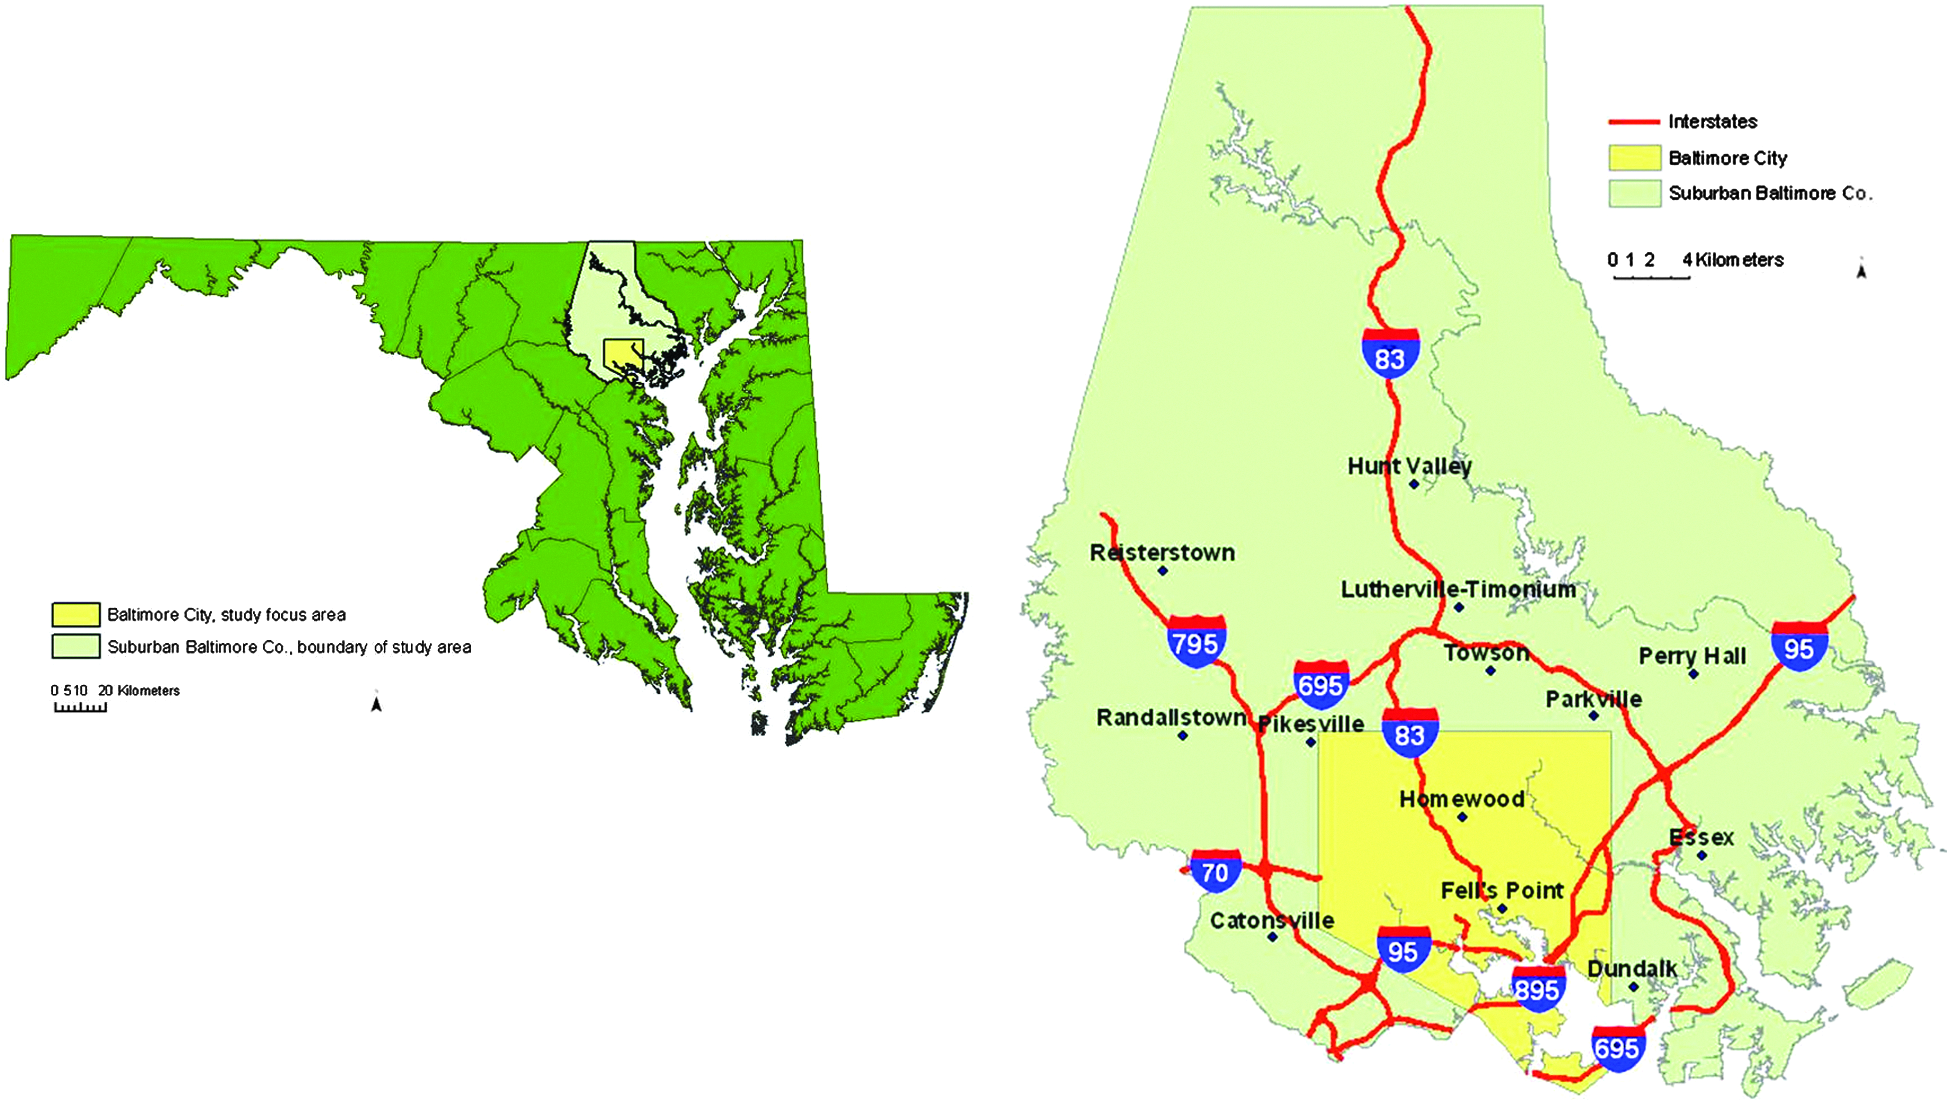
Map of the state of Maryland showing the study city of Baltimore and Baltimore County, the surrounding suburban county included in the study to reflect actual mobility patterns that originate in the city and may extend into the suburbs (left). The study area in close-up with sample areas identified (right). A color version of this figure is available in the online article at
We wanted to look deeper into the problem of transit-disadvantaged individuals within the Baltimore metropolitan region to identify areas that contain a high percentage of disadvantaged (low-income and transit-dependent) households that also have poor access to jobs and healthy food sources via public transit. The small study area allows meaningful conclusions to be drawn, enabling constructive application to the problems identified. Our novel and straightforward methodological approach that we applied to Baltimore can also be used by local governments and non-governmental organizations (NGOs) in other urban areas to identify neighborhoods in need of public transit development.
Methods
This study uses ArcGIS Desktop 10.0 to assess transit accessibility to employment and healthy food for low-income residents of Baltimore, MD by applying the extensive research concerning the lack of accessibility that low-income people have to transit. Transportation analysis zones (TAZs) serve as our unit of study28,29 and were created by the Baltimore Metropolitan Council (BMC) as part of their ongoing traffic and transit prediction modeling. They do not overlap jurisdictional boundaries and generally follow census tract boundaries, making it relatively easy to overlay census demographic data. 30
We joined median household income, total population, and supermarket counts to the TAZ dataset (Table 1). Supermarket data was obtained from the Center for a Livable Future at Johns Hopkins University. According to their store type definitions, 31 only supermarkets consistently offer food that would allow individuals to fulfill U.S. Dietary Guidelines. 32 Because farmers' markets operate seasonally and with limited hours, they are not a reliable option and were not included. 33 BMC employment data was already connected to the TAZ file by category (retail, office, industrial, other); these data were summed to get a total employment value for each TAZ.
In the past 12 months in 2009 inflation-adjusted dollars.
We determined how many TAZs were accessible from a particular origin TAZ within 30 minutes34,35 on public transit by relating a database (provided by Parsons Brickerhoff, Inc.) containing travel times between TAZs to another database containing demographic data from the Census by TAZ and querying the resultant database. Travel time considers headway, transfer time, and other factors that create a realistic representation of a transit user's experience; however, this data assumes travel between centroids of TAZs that may not represent actual mobility patterns. Once accessible TAZs were identified, we averaged supermarket and employment density in these areas and rated employment density on a four-point scale of equal intervals (Table 2). Because 217 of 559 total TAZs had accessible supermarket densities of zero, these TAZs were assigned a value of 1 and remaining data was divided into thirds (Table 2). These initial values were summed to provide a relative sense of overall access from each TAZ in the region on an 8-point scale, where a higher score equates to higher access to healthy food and employment.
TAZs in the lowest four categories of access (2, 3, 4, or 5) were identified and low income TAZs were selected from this subset. Median household incomes below $31,105.90 were considered low income. This value is calculated for a household of 2.6 people, the average household size across all incomes in the study area, at 185% of the 2009 Health and Human Services Poverty Guidelines. 36 Maryland Transit Administration service within Baltimore City and Baltimore County, including the Central Light Rail Line, Metro, proposed Red Line, and core bus routes, were used in this study; MARC train service, Charm City Circulator, and commuter bus service were not used.
The data supporting our work and code implementing our analyses are available online under free and open licenses at <
Results
The results of this analysis provide a relative ranking of transportation analysis zones in order to prioritize public transit improvements and guide planners and policymakers in improving access to healthy food and employment opportunities. Of 559 TAZs, 24 low income TAZs rated in the bottom four categories of access. Residents in these TAZs tend to not live within a 30-minute transit trip to grocery stores and tend to have many fewer job opportunities than residents within a 30-minute transit trip (Table 3). Approximately 5% of the study area population, or 73,012 people, live in these TAZs (Table 3). The TAZs with lowest access scores are mainly located in western, eastern, and southern Baltimore City; only two were located outside of the city, covering University of Maryland Baltimore County and Dundalk, which borders the city line and other poor-access TAZs within the city.
Forty percent of the study area population, or 564,060 people, have no access to healthy food within a 30-minute public transit trip. While much of this population lies in relatively wealthy TAZs, 32,578 people, or 2.3% of the study area population, live within low income TAZs who completely lack access to healthy food by our definition. The two TAZs with the best access to healthy food have a supermarket density of 1.91 and 2.14 stores per km2 within a 30-minute transit trip. So, while this study identifies areas of concern, it also suggests that food and employment access might be an issue region-wide.
However, 125,682 people, or 8.8% of the study area population, live in low income TAZs with access ratings of 6 or above. Low-income TAZs in the bottom four access categories had accessible employment densities as low as 510 jobs/km2 and a population of 73,012 whereas TAZs rated from 6 to 8 had densities as high as 29,000 jobs/km2 and a population of 125,682. Not all TAZs experience poor access to jobs; at least one had an accessible density of 13,000 jobs/km2 and a total population of 58,665 had access to between 13,841 and 29,276 jobs/km2 (Table 4). These TAZs were rated from 2 to 6.
SD, standard deviation.
Discussion
Our findings suggest that food deserts do in fact exist in poor urban neighborhoods in Baltimore. In previous research, East Baltimore residents reported reliance on small neighborhood food stores that charged high prices and offered little healthy food, 37 corroborating the poor access to healthy food in East Baltimore as indicated by our results.
Food deserts carry real health concerns for public transit-dependent households in Baltimore. In various locations across the country, black Americans' fruit and vegetable consumption increased by 32% for each additional supermarket located within a census tract while white Americans' consumption of these foods increased by 11%. 38 Another national study found that individuals with no supermarkets close to their residences were 25–46% less likely to have a healthy diet than those who lived near the most supermarkets. 39 This suggests the 32,578 low-income residents in Baltimore who do not have access to healthy food via public transit are likely to experience ill health effects.
Poor access to jobs via public transportation matters for a city with a 10% unemployment rate. Baltimore is not the only city facing a spatial mismatch of jobs: low-income individuals often live in inner-city neighborhoods whereas many jobs are now located in the suburbs, requiring long commutes.40,41,42,43 A General Accounting Office (GAO) study from 1998 found that 70% of entry-level jobs, typically in the manufacturing, retailing, and wholesaling sectors, were located in the suburbs. 44
In Baltimore, the spatial mismatch between jobs and housing can be related to the city's industrial and planning history. Parts of 10 TAZs covered industrial areas of the city, including Broening Manor, Canton, Curtis Bay/Hawkins Point, Carroll-Camden, Holabird, and Orangeville. Workers resided in these areas because companies provided cheap land and services to ensure a steady, local workforce in the late 1800s. The Canton Company provided a library, recreational center, and free schools to workers in the industrial city it built in the eastern part of Baltimore. 45 However, company towns in these areas declined in prosperity. Between 1970 and 1995 Baltimore lost 90,000 factory jobs as GM, Procter and Gamble, and others closed down. 46 Residents were left in long-term poverty without the paycheck and services provided by the company and few chances for future employment as manufacturing jobs never returned to the area. 47 In addition, these areas are more isolated and therefore transit is less likely to serve them effectively. Our results underscore the impact of these historical patterns on low income Baltimore residents.
Once this type of analysis—one that addresses the needs of transit-dependent residents—has been conducted, a number of strategies can be applied to address areas with a food or jobs spatial mismatch. For example, communities may aim to improve transit service so that everyone, and especially the most disadvantaged, can access healthy food and jobs within a reasonable amount of time. Another approach is to initiate programs that bring healthy food into communities that have no supermarkets. Community revitalization programs may be able to bring jobs into communities, targeting areas identified in the spatial analysis. By using the results of analyses such as those presented in this article, decision makers can more adequately address the needs of transit-dependent residents.
Further prioritizing areas for transit improvement within the 24 TAZs identified should consider population density to maximize return on investment through farebox revenue while impacting the most people (Figure 2). Areas near parks and which are isolated may not be good candidates. Therefore, while previously industrial areas may have a great need for transit improvement, isolation and low population density suggest the addition of bus routes to some of these areas may not improve access to amenities within a reasonable time for a reasonable cost (Table 5). However, for some TAZs, rerouting or increasing the frequency of current buses could improve accessibility for a relatively low cost. Simple co-location of bus routes through or near a TAZ does not indicate access if buses do not reach job centers or supermarkets, or if many transfers are required to reach these places. Each of the 24 TAZs identified here can be individually analyzed further to determine the best approach. Tools such as Transitmix allow agencies to consider route modifications in a quick, low-cost way, while geographic information systems (GIS) can provide further detail and control.

Transportation analysis zones (TAZs) targeted for transit improvements, shaded by population density (darker indicates higher density), with parks shown in green. Bus routes are shown as red lines; grey lines show TAZ boundaries. Roads are not displayed. Population density classification values (km2): 0–1250, 1251–2500, 2501–3750, 3751–5000, 5001–6205. A color version of this figure is available in the online article at
Although we present an effective methodology for identifying transit-defined food and employment deserts, limitations exist. We were unable to consider walking time from residence to transit stop, or from transit stop to destination. Another study considered commutes from discrete residential addresses while defining transit-dependent individuals more broadly, including individuals older than 65 and younger than 19. 48 Also, while most TAZs are quite small in area, our approach may have underestimated the presence of food and job deserts in TAZs. Finally, our study suffers from an unavoidable temporal mismatch: the dates associated with our data sets (e.g., U.S. Census, TAZ) vary.
Conclusions: Prioritizing Transit Improvement, Job Development and Healthy Food Access
Much research in the area of food and employment access makes a poor assumption: that co-location within a large geographic area constitutes access. Not only does this fail to consider other barriers such as crime and uncrossable roadways, this assumption does not address the needs of households without access to a personal vehicle. This segment of the population is most vulnerable to unemployment and health issues stemming from poor diet. This article presents a methodological approach to help policymakers and advocates better identify the needs of these transit-dependent households, which are forced to depend on societal choices concerning transportation modes and funding. Researching needs within a specific geographic area allows tailored solutions for the residents of that area. Given the budget constraints faced by most transit authorities in this country, this type of analysis can help prioritize improvements so that everyone, and especially the most disadvantaged, can access healthy food and jobs within a reasonable amount of time.
Footnotes
Author Disclosure Statement
The authors have no conflicts of interest or financial ties to disclose.