
Abstract
Abstract
Farmers markets (FM) have been proposed by researchers, policymakers, and health agencies as a potential community-level strategy to prevent obesity and reduce disparities in healthy food access in the U.S. Information about disparities in farmers market availability is scarce. This research aimed to examine county-level associations between farmers market (FM) availability and demographic, socioeconomic, health, and environmental measures in an effort to determine if disparities in availability exist in the U.S. An ecological study of 3,135 U.S. counties was conducted in 2013 using 2009–2010 data extracted from the United States Department of Agriculture Food Environment Atlas. Logistic regression and Poisson regression models were used to determine associations between county-level FM availability and measures such as percentage of non-Hispanic black residents, median household income, and number of grocery stores per 100,000 residents (i.e., per capita). Regression models were stratified by metro county status and all analyses were adjusted for state-level clustering. There were 1,774 (56.6%) counties with at least one FM available. Median household income was associated with increased odds of having at least one FM available among non-metro counties, but not metro counties. Percentage of non-Hispanic black residents and residents living in poverty were negatively associated with per capita FMs among metro and non-metro counties. Per capita fast food restaurants was negatively associated with per capita FMs among metro counties. Disparities in FM availability exist in the U.S. More research on the behavioral and health implications of farmers market availability should be conducted.
Introduction
D
Retail outlets that facilitate the distribution and consumption of locally grown foods have been proposed by researchers and health agencies such as the Centers for Disease Control and Prevention (CDC) as a strategy to address disparities in healthy food access. 21 Farmers markets (FMs), farm/roadside stands, community gardens, and community supported agriculture (CSA) programs are examples of retail mechanisms that support direct sales of fresh produce from local farms to community members. According to a United States Department of Agriculture (USDA) Agricultural Marketing Services report, the total number of USDA registered FMs increased by 35.2% between years 2009 and 2013; 24 however, little is known about whether disparities in FM availability exist in the U.S.
Although several studies have ecologically assessed disparities in retail food environment, FMs were not often included as a food environment measure.1–4 The aim of this research is to examine county-level associations between FM availability and various demographic, socioeconomic, health, and environmental measures in an effort to determine if disparities in FM availability exist in the U.S. Findings from this research will add to current knowledge of healthy food access disparities by providing policymakers and public health practitioners further insight on gaps in FM availability in the U.S.
Methods
Data source
To examine disparities in FM availability, an ecological study was conducted. Data used for this research was extracted from the USDA Economic Research Service Food Environment Atlas. 25 The Food Environment Atlas is an online data resource and mapping tool accessible to the public. Information on a variety of sociodemographic, health, and environmental measures is available for 50 states and 3,141 counties. For the current study, 2009–2010 county-level estimates were obtained and analyzed in 2013. Due to significant missing information on six counties, final analyses conducted included data on 3,135 counties. This research was approved by the University of Alabama at Birmingham Institutional Review Board.
Measures
The following county-level environmental measures were examined: FMs, grocery stores, supercenters, convenience stores, specialized food stores, fast food restaurants, full service restaurants, community-supported agriculture farms (CSA), stores authorized to accept Supplemental Nutrition Assistance Program (SNAP) benefits, stores authorized to accept Special Supplemental Nutrition Program for Women, Infants, and Children (WIC) benefits, and recreation and fitness facilities. Environmental variables were measured as number of outlets per 100,000 county residents (i.e., per capita outlets). The numbers of county residents reflect 2009 U.S. Census Bureau county population estimates.
According to the USDA, FMs are defined as food retail outlets with at least two vendors selling agricultural products directly to customers. Grocery stores are small or large supermarkets involved in selling a general line of food. Supercenters include warehouse and club stores that retail merchandise such as apparel or appliances in addition to groceries. Convenience stores are smaller food marts with or without gasoline sales that offer a limited line of food items. Specialized food stores include food outlets involved in selling specific food items such as baked goods, seafood, or organic produce. Full service restaurants are defined as establishments that have seated service and a wait staff, while fast food restaurants offer limited service with patrons usually paying before receiving food. CSA farms are farms that have a community supported agriculture program. Recreation and fitness facilities are establishments involved in providing fitness activities such as gyms, community centers, and swimming pools.
Demographic and socioeconomic measures examined include median household income, percentage of county residents over the age of 65, percentage under the age of 18, percentage non-Hispanic black, percentage Hispanic, and percentage living below the national poverty threshold. All demographic and socioeconomic variables reflect 2010 U.S. Census estimates. To assess regional differences in FM availability, states were grouped into Northeast, South, Midwest, and West based on their U.S. Census region. 26 Metro county status was defined by the U.S. Office of Management and Budget. Counties that include urbanized areas and counties economically tied to counties with urbanized areas were defined as metro regardless of the population density. Non-metro counties are counties that have no economic ties to surrounding urban counties and possess no cities with more than 50,000 residents. The percentage of county residents with low access to a grocery store (LATS) includes those residents that live more than one mile from a supermarket in metro counties and 10 miles in non-metro counties. Health measures examined include the percentage of county residents classified as obese (i.e., BMI ≥30) and the percentage of county residents with diabetes mellitus. These figures were estimated from CDC Behavioral Risk Factor Surveillance System (BRFSS) data and reflect the age-adjusted percentage of adults over the age of 20.
Statistical analysis
Means and frequencies were calculated for county-level demographic, socioeconomic, health, and environmental variables among all U.S. counties. Descriptive statistics were also calculated stratified by FM availability status (i.e., at least one USDA defined FM was present in the county). Student's t test and chi-square tests were used to examine differences in means and frequencies. Two models were employed to examine associations between county-level characteristics and the dependent variable, FM availability. Crude and multivariable adjusted logistic regression models were used to observe associations between county-level measures and odds of having at least one FM in the county among all U.S. counties (N = 3,135). All variables found to be significant at the 0.05 level in the crude logistic regression models were included in the adjusted model. Additionally, crude and multivariable adjusted Poisson regression models were used to examine associations between county-level variables and per capita FMs among counties with at least one FM present (N = 1,774). All variables found to be significant at the 0.05 level in the crude Poisson regression models were included in the adjusted model. Regression models were stratified by metro county status in order to examine differences in availability between metro and non-metro counties. For ease of interpretation, all variables were modeled as dichotomous variables in the regression models. Cutoff values for variables were determined from 2010 U.S. Census estimates, 2009–2010 CDC health statistics estimates, or the variable median (see Appendix). Standard errors were adjusted for state-level clustering due to the potential non-independence of counties located in the same state. Analyses were performed using STATA version 11 (StataCorp; College Station, TX).
Results
Figure 1 displays the county level per capita availability of farmer markets in the contiguous U.S. Descriptive characteristics of U.S. counties (N = 3,135) are recorded in Table 1. There were 1,774 (56.6%) counties with at least one FM present and 1,088 (34.7%) counties classified as a metro county. Significant differences were observed between counties with at least one FM present and counties without a FM for all county-level characteristics examined except percentage of non-Hispanic black residents, percentage of Hispanic residents, and per capita full service restaurants. Southern counties comprise 44.5% of all U.S. counties, but 55.8% of counties without a FM available. On average, median household income was greater and percentage of residents living in poverty was lower in counties with a FM compared to counties without a FM (p < 0.0001 for both). The percentage of county adults classified as obese among counties without a FM available was, on average, 31.0% compared to 28.9% among counties with a FM available (p = 0.005). Mean amount of recreation centers per capita among counties with a FM is 9.4 compared to 5.9 among counties without a FM (p < 0.0001).
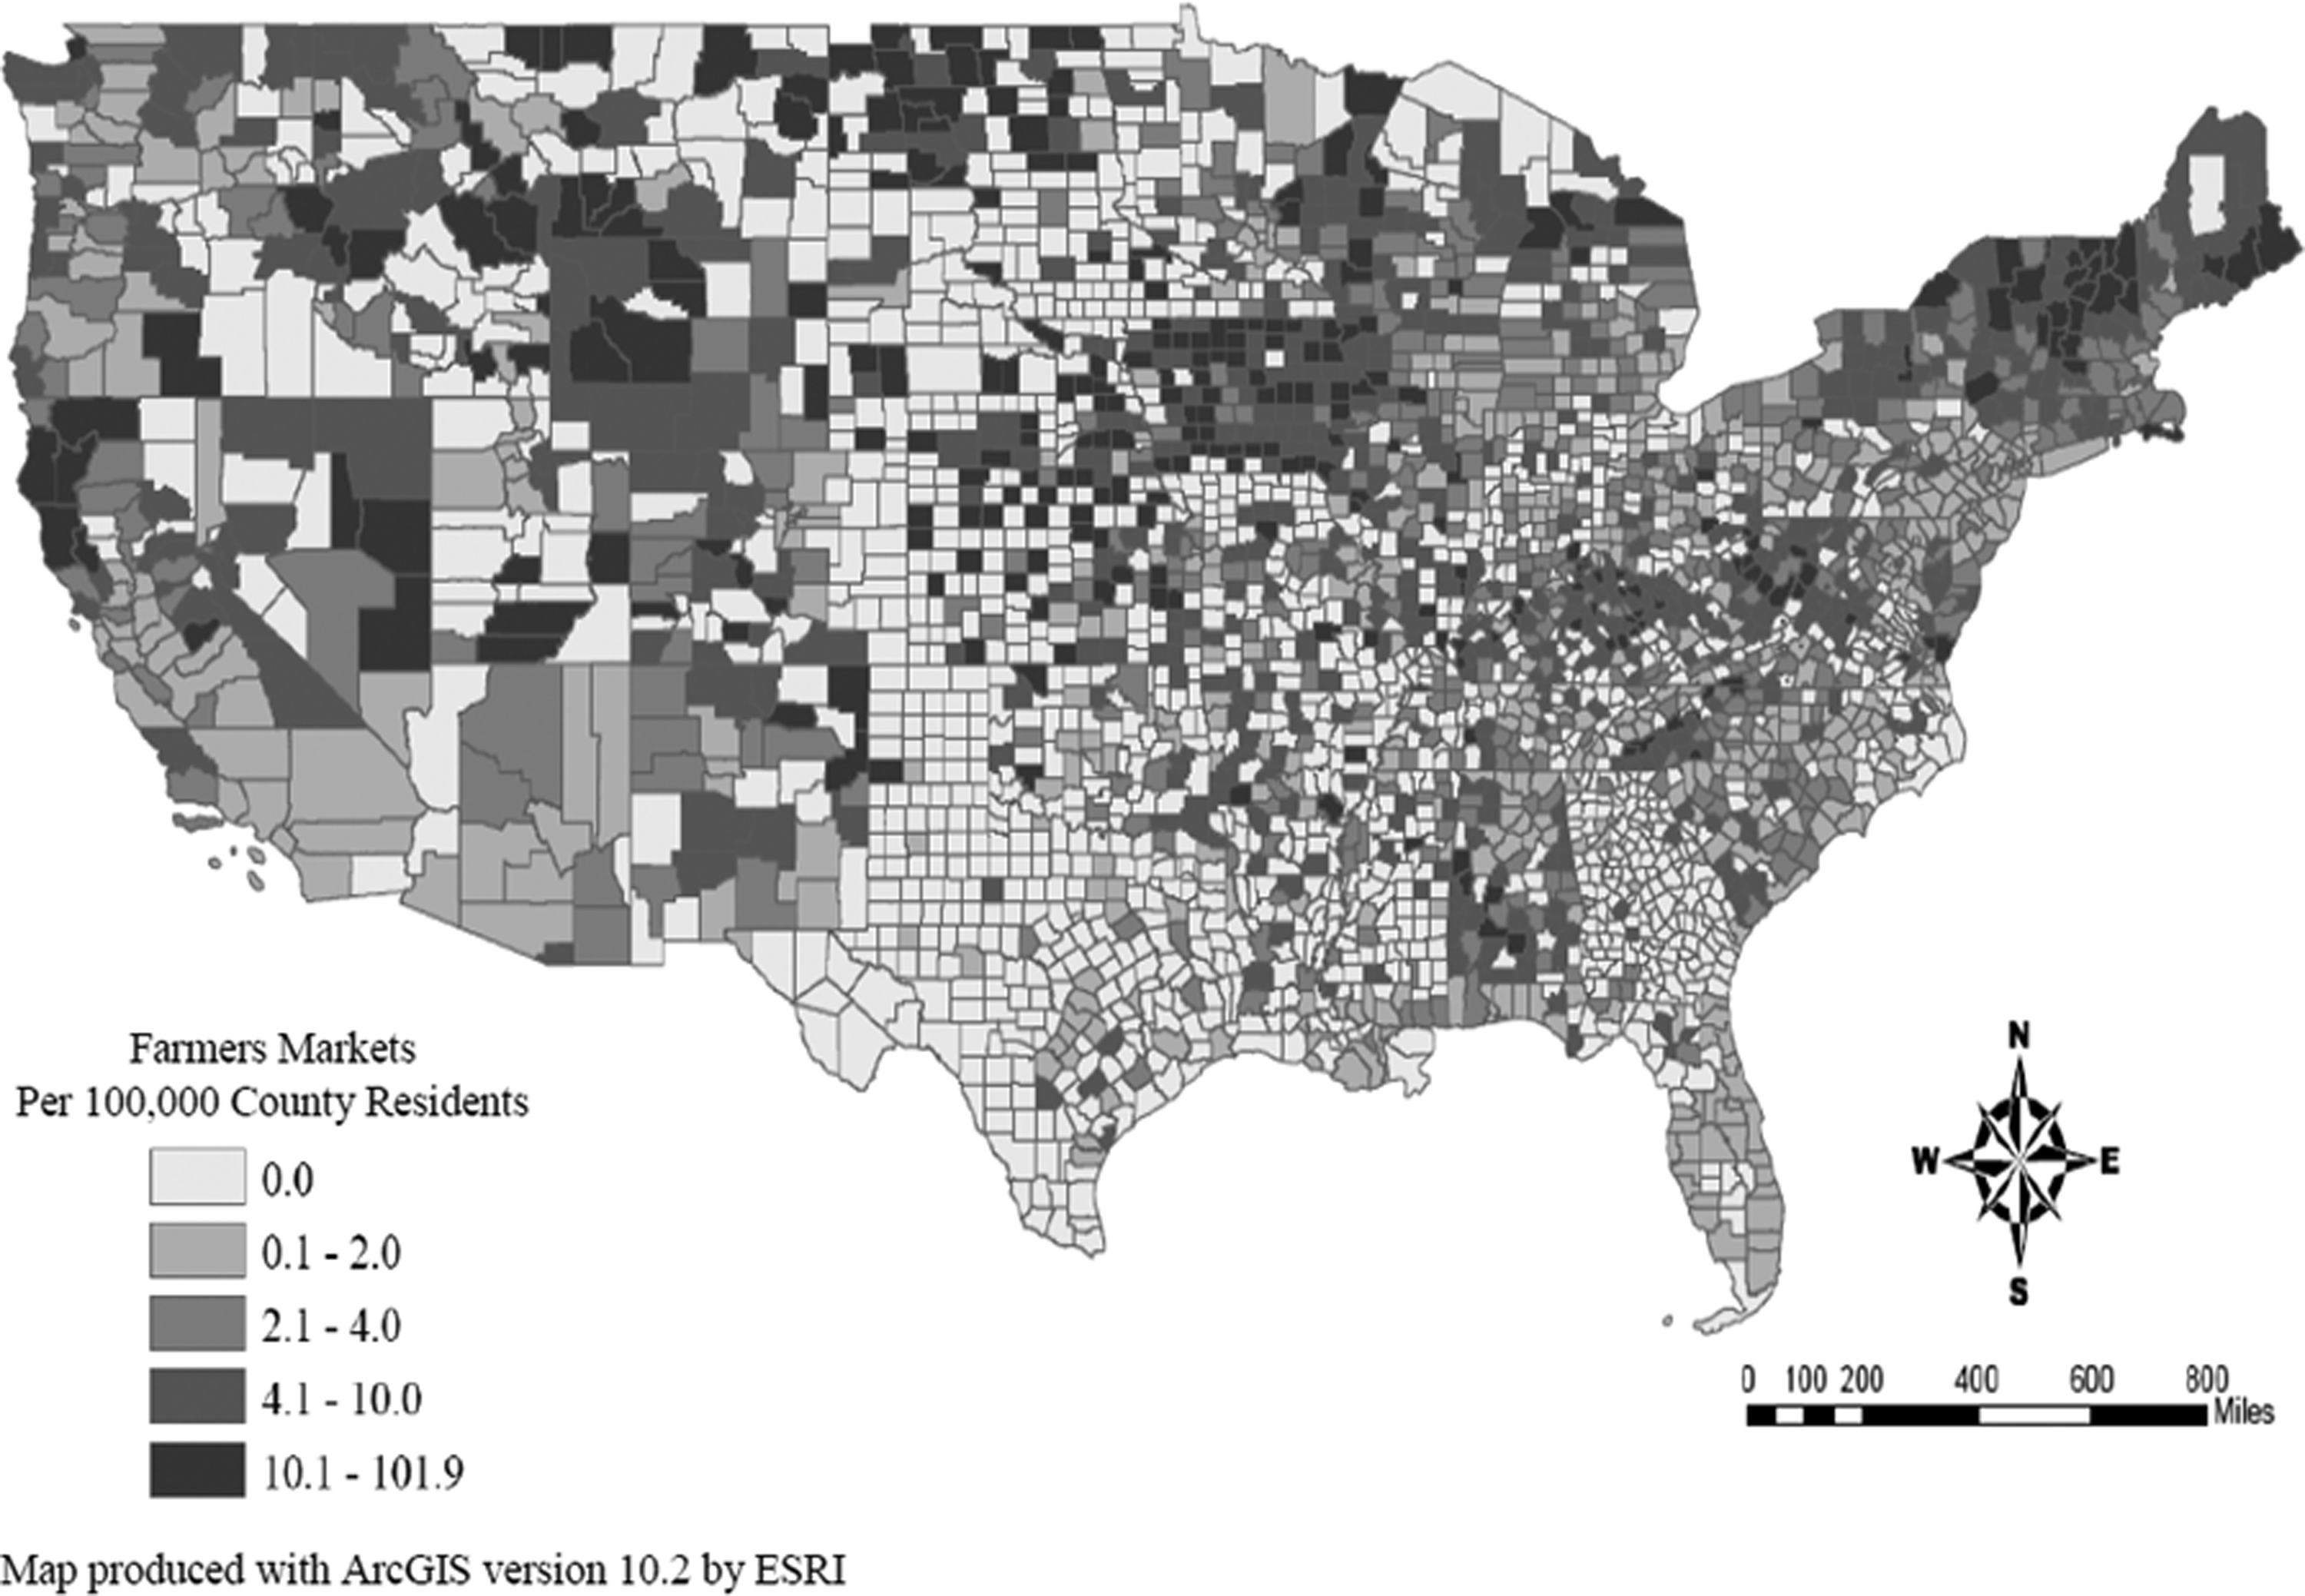
County-level per capita farmers markets in the contiguous United States. Map produced with ArcGIS version 10.2 by ESRI.
FM: Farmers Market; SNAP: Supplemental Nutrition Assistance Program; WIC: Special Supplemental Nutrition Program for Women, Infants and Children; CSA: Community Supported Agriculture Program.
n (%) for metro county status.
Crude and multivariable adjusted odds ratios (OR) and 95% confidence intervals (CI) stratified by metro county status are recorded in Table 2. The odds ratios describe associations between county-level characteristics and having at least one FM available. Metro Counties: Every county-level measure was found to be associated with having at least one FM available among metro counties except percentage of residents over 65, percentage non-Hispanic black, percentage Hispanic, percentage of residents living in poverty, percentage of obese adults, percentage of adults with diabetes, and per capita grocery stores. The multivariable adjusted model indicated that high per capita convenience stores was associated with decreased odds of having at least one FM available. Counties with more than the median number of per capita recreation centers, per capita fast food restaurants, and specialized food stores had increased odds of having at least one FM available. Non-metro counties: All county-level measures were found to be associated with having at least one FM available except percentage of residents over 65, percentage non-Hispanic black, percentage Hispanic, percentage of residents living in poverty, percentage of obese adults, percentage of adults with diabetes, per capita grocery stores, and per capita WIC authorized stores. The multivariable adjusted model indicate that a high percentage of residents with LATS and per capita convenience stores was associated with decreased odds of having at least one FM available. A median household income greater than $50,221 and per capita recreation centers greater than the median was associated with increased odds of having at least one FM available.
N = 3,135
Metro = 1,088 (34.7%); Non-metro = 2,047 (65.3%)
OR: Odds Ratio; CI: Confidence Interval; SNAP: Supplemental Nutrition Assistance Program; WIC: Special Supplemental Nutrition Program for Women, Infants and Children; CSA: Community Supported Agriculture Program.
All variables associated with FM availability in the crude model were included in the multivariable adjusted Logistic Regression model.
Crude and multivariable adjusted prevalence ratios (PR) and 95% CIs stratified by metro county status are recorded in Table 3. Prevalence ratios describe the associations between county-level measures and per capita FMs. Only counties with at least one FM were included in the Poisson regression models (n = 1,774). Metro counties: All variables were found to be associated with per capita FMs in the crude models except median household income, percentage of adults with diabetes, and per capita full service restaurants. The multivariable adjusted model showed that a high percentage of non-Hispanic black residents, percentage of Hispanic residents, percentage of county residents living in poverty, and percentage of residents with LATS was associated with a significant decrease in the amount of per capita FMs. Having per capita grocery stores greater than the median was associated with an increase in per capita FMs. Non-metro counties: All variables were found to be associated with per capita FMs in the crude models except median household income, percentage of adults with diabetes, and per capita CSA farms. The multivariable adjusted model indicated that a high percentage of non-Hispanic black residents, percentage Hispanic residents, and percentage of residents living in poverty were associated with a significant decrease in the number of per capita FMs. High per capita grocery stores was associated with a significant increase in per capita FMs.
N = 1,774
Metro = 773 (43.57%); Non-metro = 1,001 (56.43%)
PR: Prevalence Ratio; CI: Confidence Interval; SNAP: Supplemental Nutrition Assistance Program; WIC: Special Supplemental Nutrition Program for Women, Infants and Children; CSA: Community Supported Agriculture Program.
All variables associated with per capita FM in the crude model were included in the multivariable adjusted Poisson Regression model.
Discussion
Results from this research suggest that there are several county-level demographic, socioeconomic, health, and environmental variables associated FM availability. These findings lend support to the hypothesis that there are disparities in FM availability in the U.S. To our knowledge, this is the first examination of FM disparities to date. In general, findings from the current study appear to be in line with other scientific literature on disparities in retail food environment. Variations in food landscape between urban (i.e., more densely populated) and rural regions have been previously documented with findings suggesting that rural areas often have reduced access to food retail outlets like grocery stores.1,6,17,28 For example, Jilcott et al. found a significant positive association between percentage of rural residents and food retail gaps in Kentucky, 27 and Liese et al. observed that supermarkets in rural counties of South Carolina were often outnumbered by outlets that had a poor selection of healthy foods such as convenience stores. 6 A variety of definitions of urban and rural have been employed in public health research; many of which are based solely on population density. 28 The indicator used in the present study (i.e., metro) was defined based on population density and economic ties to bordering counties. Stratified analyses were used to further explore differences between metro and non-metro counties with respect to FM availability. The differences in results seen between metro and non-metro counties suggest that with respect to FMs, population density and economic ties to surrounding counties are important factors when examining disparities in availability.
Environmental characteristics were examined to gauge the impact proximity and access to other features of the build environment had on FM availability. The literature on food environment suggests that grocery stores, fast food restaurants, and convenience stores are the most often researched features of the food environment. Many studies have observed that communities with fewer resources often have more outlets that promote unhealthy dietary behaviors such as fast food restaurants.9,14,16 Grocery store availability was not associated with odds of FM availability in the current study; however, high per capita grocery stores was associated with a significant increase in per capita FMs. Additionally, high per capita recreation facilities, supercenters, and specialized food stores increased the odds of having at least one FM available among both metro and non-metro counties while a high per capita convenience stores decrease the odds. Fast food restaurant availability was associated with odds of have a FM available in metro counties only, and unexpectedly, was positively associated with per capita FMs in both metro and non-metro counties. Findings from this research suggest that counties with more food retail outlet options in general are more likely to have FMs; however, differences between metro and non-metro counties are present.
Demographic and socioeconomic characteristics such as minority resident composition and median income are often examined as predictors of food environment disparities.1,2,8–19 Race/ethnicity has been shown to be associated with unhealthy food environments. 8–19 Baker et al. found that high density African American areas in the U.S., regardless of income, were less likely to have access to food that promote healthy diet choices compared to predominately white areas. 16 Moreland et al. observed that predominately non-Hispanic white neighborhoods had on average four times more supermarkets compared to predominately non-Hispanic black neighborhoods in an examination of census tracts from four U.S. states. 13 Results from the current study indicated that percentage of non-Hispanic black residents and percentage of Hispanic residents were negatively associated with per capita FMs among metro and non-metro counties. These findings further support the hypothesis that minority resident composition is associated with having a lower amount of outlets that retail items that promote healthy diet-related behaviors.
Research on income and disparities in food environment have yielded ambiguous results.8–10,13,16,17 Powell et al. found that low-income neighborhoods on average have fewer chain supermarkets compared to middle-income neighborhoods in urban areas. 15 Richardson et al. found that high density urban areas in the U.S. with a large number of impoverished residents had greater availability of all food outlets examined in their analysis including grocery stores and the disparities in food availability were observed among mostly suburban communities. 17 In the current study, a median household income higher than the national average increased the odds of having a FM available and a percentage of residents living below the poverty threshold greater than the national average was negatively associated per capita FMs. While more research is needed to better understand the relationship between community socioeconomics characteristics and FM availability, it appears that there might be a link between the two.
Obesity and diabetes mellitus are major public health concerns in the U.S.29,30 In the current study, the prevalence of each health outcome was examined as a predictor of FM availability. Neither measure was significantly associated with FM availability. Similar studies examined FM availability as a predictor of obesity and diabetes and resulted in inconsistent findings.27,31–36 Ahern et al. examined the association between direct-to-consumer farm sales at the county level and adult diabetes prevalence and found a negative association while Jilcott et al. observed that per capita FMs did not predict obesity prevalence at the county level.27,31 Other studies of outcomes associated with food outlet availability have also produced inconsistent findings.32–42 Drewnowski et al. found that obesity risk was not associated with proximity of supermarkets that retail healthy food, but rather the type of supermarket and the prices of the food items offered. 33 Zenk et al. observed that presence of certain neighborhood food environment indicators influenced fruit and vegetable intake, while Aggarwal et al. and Boon-Heinonen et al. found that fruit and vegetable consumption was not associated with market availability.37–39 Considering FMs have been a topic of discussion among public health practitioners and policymakers interested in obesity prevention and increasing fruit and vegetable consumption, more information should be collected on the nutritional implications of FM availability and usage.20–23
The strengths and limitations to this research should be noted. Use of the USDA Food Environment Atlas was a strength because it included a wide variety of food environment measures and very little missing information. The county-level indicators for health and sociodemographics were provided by data sources such as BRFSS and the U.S. Census. Among the limitations to this research is our inability to look at associations between availability of FMs and outcomes at the individual level. There have been studies conducted to examine associations between use of FMs and health outcomes at the individual level; most of which have been cross-sectional and included lower income individuals due to the existence of national programs such as the WIC Famers Market Nutrition Program.42–45 In general, research on the community-level benefits of FMs is still in the early stages. Other limitations include the statistical analysis plan. Although county-level characteristics were categorized to ease interpretations of study findings, the categories chosen might have affected the ability to observe other significant relationships between variables and FM availability.
Overall, it appears that there are disparities in FM availability in the U.S., which may affect the potential these outlets possess to positively influence diet-related behaviors and health outcomes. Future studies of disparities in food environment should explore other measures of the food environment such as FMs and other direct-to-consumer produce outlets. Additionally, more scientific evidence should be collected on the public health implications of disparities in FM availability and FM usage in the U.S.
Footnotes
Acknowledgments
Research reported in this publication was supported by the National Heart, Lung, and Blood Institute of the National Institutes of Health under award number T32HL105349. The content is solely the responsibility of the authors and does not necessarily represent the official views of the National Institutes of Health.
Author Disclosure Statement
The authors have no conflicts of interest or financial ties to disclose.
Appendix
| Variable | Cutoff value |
|---|---|
| Residents Over 65 a | ≥13.00% |
| Residents Under 18 a | ≥24.00% |
| Non-Hispanic Black Population a | ≥12.60% |
| Hispanic Population a | ≥16.30% |
| Median Household Income a | ≥$50,221.00 |
| % Residents in Poverty a | ≥14.30% |
| Adult Obesity Prevalence b | ≥35.70% |
| Adult Diabetes Prevalence b | ≥8.20% |
| % Residents Low Access to Grocery Store c | ≥19.69% |
| Grocery Stores c | ≥21.00 per 100,000 residents |
| Supercenters c | ≥0.75 per 100,000 residents |
| Convenience Stores c | ≥56.02 per 100,000 residents |
| Specialty Food Stores c | ≥4.40 per 100,000 residents |
| Fast Food Restaurants c | ≥57.26 per 100,000 residents |
| Full Service Restaurants c | ≥67.51 per 100,000 residents |
| CSA Farms c | ≥6.76 per 100,000 residents |
| SNAP Approved Stores c | ≥71.80 per 100,000 residents |
| WIC Approved Stores c | ≥19.88 per 100,000 residents |
| Recreation Centers c | ≥7.09 per 100, 000 residents |
n (%), CSA: Community Supported Agriculture Program; SNAP: Supplemental Nutrition Assistance Program; WIC: Special Supplemental Nutrition Program for Women, Infants and Children.
Cutoff value determined from 2010 U.S. Census Estimates.
Cutoff value determined 2009–2010 Centers for Disease Control and Prevention Health Statistics.
Cutoff value determined from variable median.