
Abstract
Abstract
The perception of climate change impacts is strongly influenced by the underlying social realities. In order to develop a model for climate change adaptation policies, the CC-VISAGES project (Climate Change Inferred through Social Analysis, Geography, and Environmental Systems) developed a Climatological Environmental Justice Index (CEJI) based on a developed Human Stress Index (HSI) and the Temperature Humidity Index (THI). Through a geographical information system (GIS) representation of HSI, THI, and CEJI, a vulnerability ranking of all communities in Germany, Canada, and Brazil could be revealed. The variables have been selected and measured in a country comparable manner allowing to proportion communities between the different countries. The data have been gathered from the nomenclature of territorial units for statistics (NUTS) level 3 (community level). This article will show how HSI has been developed and combined with the THI in order to develop the CEJI. A list of the vulnerable areas in each country according to HIS, THI, and ECJI will be presented as the findings and discussed.
Introduction
C
The article assumes that the stakeholders on all governance levels are not speaking about the same thing when discussing climate change. A solution of the climate change issue cannot be achieved as long as the determining parameters are ignored. Social and climatological variables of vulnerability have been combined to create a Human Stress Index (HSI) and then connected to the Temperature Humidity Index (THI) to develop the Climatological Environmental Justice Index (CEJI) using Germany, Canada, and Brazil as examples.
Study Areas
Germany is located in Mid-Europe and is a unit of 16 federal states. It is characterized by a temperate climate, prevailing westerlies, and situated in the transitional zone between the maritime climate in Western Europe and the continental climate in Eastern Europe. The diversity of the landscape from north to south contains the lowlands of Northern German, the central mountain zone, the alpine forelands, and the German Alps. Germany's national territory contains 357,376 km2; more than 50% of the territory—84,607 km2—is used for agriculture. 5
Canada is located in North America and is a union of 10 provinces and three territories. The climate varies from polar climate in the north to temperate climate in the south (50° N latitude), whereas most of the country features a boreal climate, characterized by long cold winters and dry hot summers. The diversity of the landscape reaches from tundra and mountain regions, to extensive coniferous forest area southwards and agricultural areas in the south. Canada has one of the lowest degrees of population density. According to the Canadian census, 6 a constantly growing 7 share of currently 81.1% of the population is concentrated in urban areas. 8
Brazil is located in South America and is a union of 27 federal units. The climate varies from the tropical north, crossing the equator, to temperate zones in the south (23° S latitude). The diversity of the landscape reaches from extensive rain forest in the north, to areas in the central west, savanna regions in the east, and mountains in the south that are mainly used for agricultural production. It is the most populous nation in South America. 55.9% of the Brazilian population is concentrated in 294 population settings. These are concentrated mainly in 26 cities with more than 750,000 inhabitants, mainly located at the coast. 9
Material (data) and Methods
The following examination will outline the creation of the Human Stress Index and its combination with the Temperature Humidity Index to create the Climatological Environmental Justice Index.
The Human Stress Index
The selection of variables for the HSI is based on the intersectionality debate. Intersectionality is mostly used in gender debates where Hancock, 10 for instance, examined intersectionality as a research paradigm. Intersectionality describes the research on the intersections between different forms of discrimination and is also referred to as “matrix of domination” 11 or “complex inequality.” 12 Contrary to earlier debates on triple oppression, 13 intersectionality sees these as a nonadditive way of understanding social inequality focusing on “how race, gender, and class, as categories of difference, do not parallel but instead intersect and confirm each other.” 14 The intersectional approach 15 is also referred to as an “integrative” 16 or “race-classgender” approach, 17 as Choo 18 adds.
As for the HSI, education, distribution of income, ethnic composition, population density, and age distribution have a great influence on living conditions, life style, and available resources. National databases provided different scales for the chosen variables in their most recent surveys.
The chosen variables in the following table (Table 1) represent an overview about the dimensions of social structures, demographic conditions, and economy.
In Germany and Canada, data from the 2011 census was available. 19 For Brazil, data collected by the census in 2010 was used. 20
The data on social conditions was collected on the spatial resolution of NUTS 3 regions for Germany and comparable spatial resolutions for Canada and Brazil. As the hierarchical systematic of NUTS is only applied in member states of the European Union, the data acquired for Canada and Brazil does not rely on this standard. For Germany, this means the data was collected on the level of counties and urban municipalities resulting in 402 surveyed units. As for Canada, the data was collected based on the census subdivisions resulting in 293 units that could be surveyed. The Brazilian census on the other hand used administrative units comparable to counties and municipalities in addition to much smaller entities like urban districts, quarters, and even single house complexes, resulting in 316,574 units for the survey.
Due to the redrawn county boundary of the federal state of Mecklenburg-Western Pomerania from 2010 to 2011, parts of the state did not provide data about school leavers.
For the calculation of HSI, datasets of censuses from the three study areas were used. The following variables have been evaluated based on the selection requirement of being available in all three countries: population density (PD), proportion of women (WO), children and teenagers (YO), elderly people (EL), migration background/non-white people (NWP), education in terms of literacy in the overall population (ED), and the level of income (IN). The variables YO and EL were grouped together by adding the percentages of both, resulting in a single variable representing age dependent vulnerability (AGE). All social variables were then classified by calculating the 5%, 25%, 50%, 75%, and 95% quantiles for each of the seven variables, and all regions surveyed were grouped according to their value exceeding or falling below the thresholds into six classes. The classes were defined from 1 to 6 with 1 indicating very positive social circumstances and 6 marking very negative social circumstances regarding the variable of interest.
The Temperature Humidity Index
Climatological factors, such as temperature, humidity, ozone, fine dust pollution, and ultraviolet (UV) radiation have a great influence on human health and biological stress conditions.
High-resolution grids of mean monthly surface climate provided by the Climatic Research Unit (CRU) of the University of East Anglia 21 were used as input for the calculations of the climatic stress index. The CL2.0 dataset includes monthly global climatologies of eight variables calculated from observational data averaged for the years 1961 to 1990 and interpolated on a 10-minute grid, covering all areas except Antarctica.
For the estimation of the impact of climatological factors imposing stress on the human body, numerous indices with strongly differing methodological backgrounds exist in the literature. 22 De Freitas and Grigorieva classified 162 human thermal biometeorological indices into eight groups. 23 The rationale behind the decision on which index to use, was the applicability to a high-resolution global climate dataset without the need for mixing it with data of different sources. The index should be up-to-date and consider temperature as overall applicable variable of climate change impact to human health. After comparing the indices, the THI by Schoen 24 was chosen. Since dew point temperature was not available in global high-resolution observational datasets, the calculation of the THI had to be adjusted by using the equations of Sonntag 25 to approximate dew point temperature from relative humidity measurements.
The results from THI calculations were then grouped into classes 1 to 6 according to the classification scheme of the social variables utilizing the 5%, 25%, 50%, 75%, and 95% quantiles. The higher the class, the bigger is the combined temperature humidity stress on the population of the region of interest.
The Climatological Environmental Justice Index
To identify regions and population groups in each of the three countries that are especially handicapped by socio-environmental stress factors and to quantify these factors, the CEJI was created. It comprises two sub-indices, the Temperature Humidity Index as a climatic stress index and the Human Stress Index, each contributing to the CEJI with 50%.
Results
Starting with the quantiles and thresholds, the Spearman correlation coefficient and significance parameters, the geographical information system (GIS) modeling of the community-based application of HSI, THI, and CEJI will be shown and analyzed.
The quantiles for each country (Tables 2–4) tell about the distribution of the social variables in the HSI within each country. The index column describes the border percentage, at which the rank from 1 to 6 switches. The data in the matrix show at which point (percentage in the cases of PD, WO, YO, EL, NWP, ED, and AGE BTW; average salary looking at IN).
PD, population density; WO, proportion of women; YO, young age; EL, elder age; NWP, non-white people, migrants, foreigners; ED, vulnerability due to (low) education, high school dropouts; IN, income vulnerability of by average income; AGE, age vulnerability of both young and elder people.
PD, population density; WO, proportion of women; YO, young age; EL, elder age; NWP, non-white people, migrants, foreigners; ED, vulnerability due to (low) education, high school dropouts; IN, income vulnerability of by average income; AGE, age vulnerability of both young and elder people.
PD, population density; WO, proportion of women; YO, young age; EL, elder age; NWP, non-white people, migrants, foreigners; ED, vulnerability due to (low) education, high school dropouts; IN, income vulnerability of by average income; AGE, age vulnerability of both young and elder people.
As for the correlation coefficient (Spearman), the analysis provides the rank correlation coefficient as a contingency table and—additionally—the significance of the probability to falsely reject the null hypothesis 26 (H0). Accordingly, the higher the prosecutor's fallacy (significance) the more we can assume a correlation between the two variables, BTW the higher is the chance to falsely refuse the H0.
For Germany, the significance is high regarding PD vs. ED (0.962) and WO vs. ED (0.614), it is relatively high for PD vs. YO (0.229), and it is low in the cases of IN vs. AGE (0.011), NWP vs. AGE (0.008), and AGE vs. YO (0.007). For all others, the probability is equal to zero (0) (Table 5).
PD, population density; WO, proportion of women; YO, young age; EL, elder age; NWP, non-white people, migrants, foreigners; ED, vulnerability due to (low) education, high school dropouts; IN, income vulnerability of by average income; AGE, age vulnerability of both young and elder people.
As for Canada, the significance is highest for WO vs. IN (0.962) followed by AGE vs. NWP (0.936), and ED vs. YO (0.739), medium significance was found for YO vs. AGE (0.564), PD vs. EL (0.362), and NWP vs. WO (0.233). Low significance could be revealed for PD vs. IN (0.031), WO vs. AGE (0.157), and ED vs. NWP (0.051). For all others, the probability is equal to zero (0) (Table 6).
PD, population density; WO, proportion of women; YO, young age; EL, elder age; NWP, non-white people, migrants, foreigners; ED, vulnerability due to (low) education, high school dropouts; IN, income vulnerability of by average income; AGE, age vulnerability of both young and elder people.
In the case of Brazil, only one significant correlation was found (even though low): PD vs. ED = 0.042. The probability for the others is equal to zero (0) (Table 7).
PD, population density; WO, proportion of women; YO, young age; EL, elder age; NWP, non-white people, migrants, foreigners; ED, vulnerability due to (low) education, high school dropouts; IN, income vulnerability of by average income; AGE, age vulnerability of both young and elder people.
The analysis of the correlations shows connection between income and other variables. Low income goes together with a high percentage of high school dropouts in Brazil (.88), but is negatively correlated in Canada (-.69) and Germany (-.39). The correlation with non-white people/immigrants/foreigners is negative in Brazil (-.69), but positive in Canada (.40) and Germany (.77). Bringing these two correlations together, the non-white people variable doesn't correlate with education in Brazil (-.79), but does in Canada (.40) and Germany (.77). Education correlates with young people negatively in Brazil (-.82) and Germany (-.42), but not so in Canada (.02).
Of less surprise is the positive correlation between youth and income, which is significant in all three countries (.66 Brazil, .40 Canada, .36 Germany). Young people naturally have relatively low income. The same applied for the correlation between young people and NWP (.79 Brazil, .46 Canada, .34 Germany).
As for the share of female population, we found a high correlation with population density (.48 Brazil, .53 Canada, .62 Germany) but a surprisingly low correlation (though not negative) with income (.09 Brazil, .00 Canada, .19 Germany).
Looking at age (both young and old, AGE), we see a high correlation with YO in Brazil (.89), but moderate in Canada (.03) and Germany (.13). This shows that the vulnerability due to age is influenced more by the amount of YO than of EL. The correlation between age and NWP is also only high in Brazil, .75 compared to .00 (Canada) and −.13 (Germany).
Obviously, the negative correlation between EL and YO in all three cases is self-explanatory since there cannot be a correlation between mutually exclusive variables. In addition, the correlation between YO and EL versus AGE is rather redundant since AGE is created by YO and EL. Similarly, the relation of age to education (-.85 Brazil, .42 Canada, .06 Germany) as well as between people of both young and old age (-.81 Brazil, −.40 Canada, −.13 Germany) is not of much meaning as such.
Germany
HSI
The areas showing the worst HSI values in Germany were all cities and spread all over the country (Figure 1). Western, northern, and northeastern Germany especially included many regions holding a high HSI. Lübeck, Delmenhorst, and Schwerin in the north, Pforzheim and Kaufbeuren in the South, and Chemnitz and Halle (Saale) in the east of Germany are represented in the list with the highest HSI (Table 8).
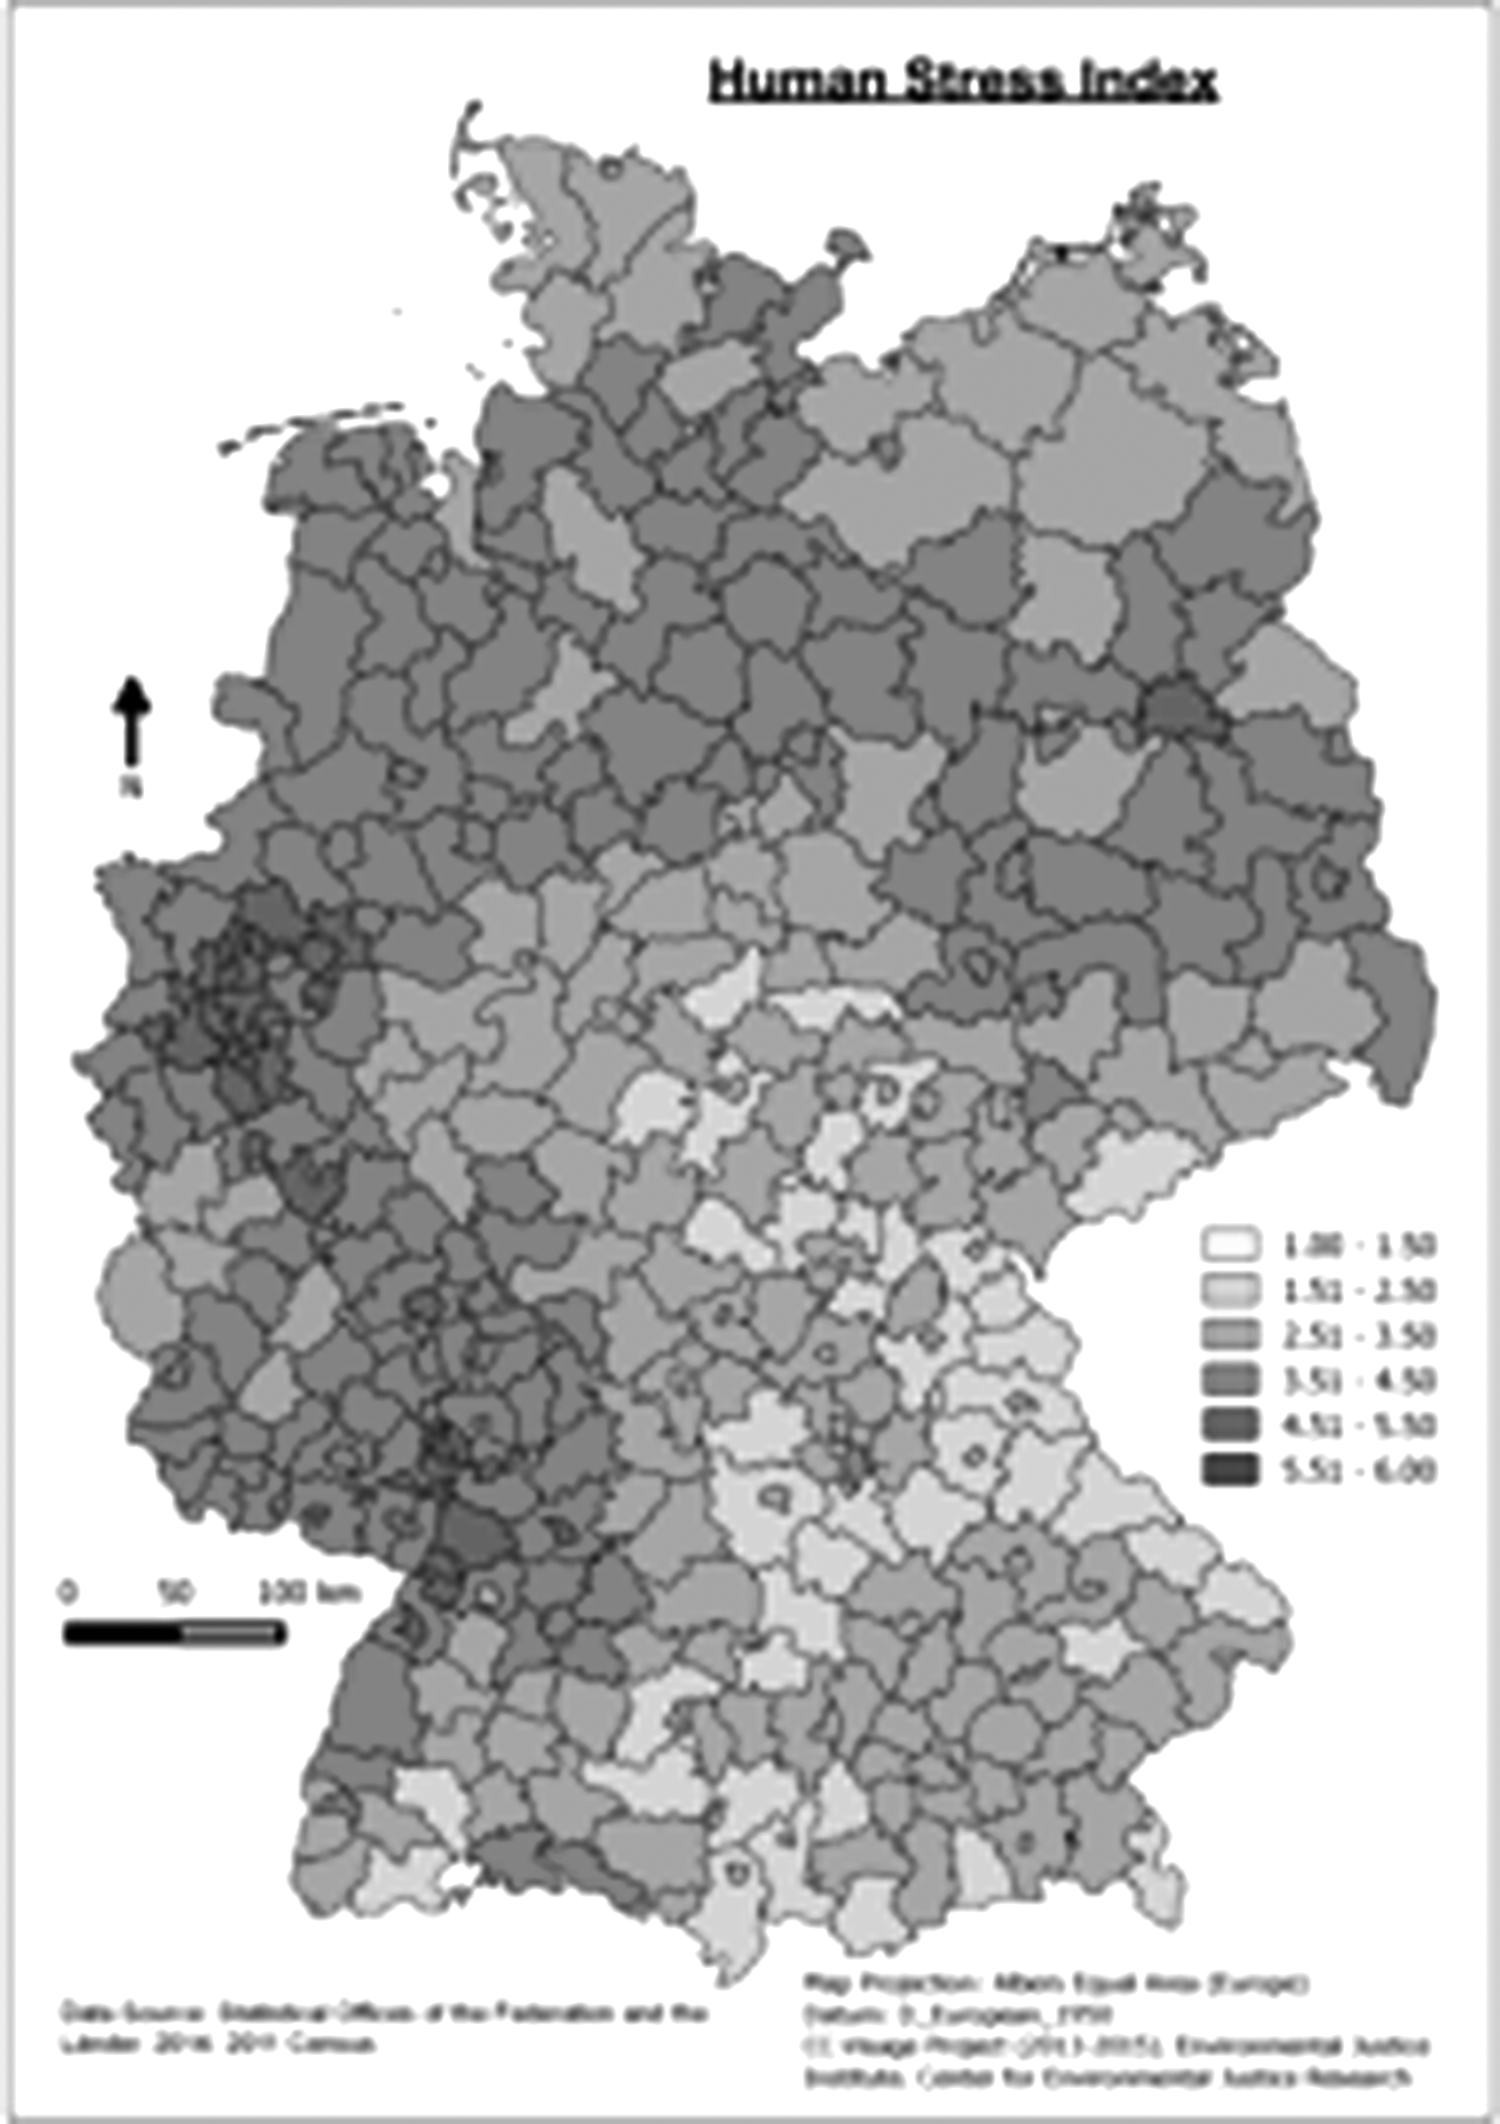
GIS model of the Human Stress Index (HSI) in Germany.
All regions exhibited a HSI above 4.5 and belonged to the 25% with the highest population density and the worst education. But reasons for the bad HSI results differed between the regions. Chemnitz, Delmenhorst, Lübeck, Pforzheim, and Schwerin all belonged to the worst 5% of all regions in one category, Halle (Saale) in two categories, and Kaufbeuren in none. Halle (Saale), Lübeck, and Schwerin were characterized by a high percentage female population, which resulted in a bad grade entering the HSI formula. Pforzheim showed a high relative number of immigrants in the population, Delmenhorst a low average income, and Chemnitz a high proportion of people of an exposed age group. Halle (Saale), again, and Schwerin belonged to the 5% with the lowest education level overall.
THI
The 5% of the German areas presenting the highest THI values and hence the highest climatic stress were all situated in the western parts of the country (Figure 2).
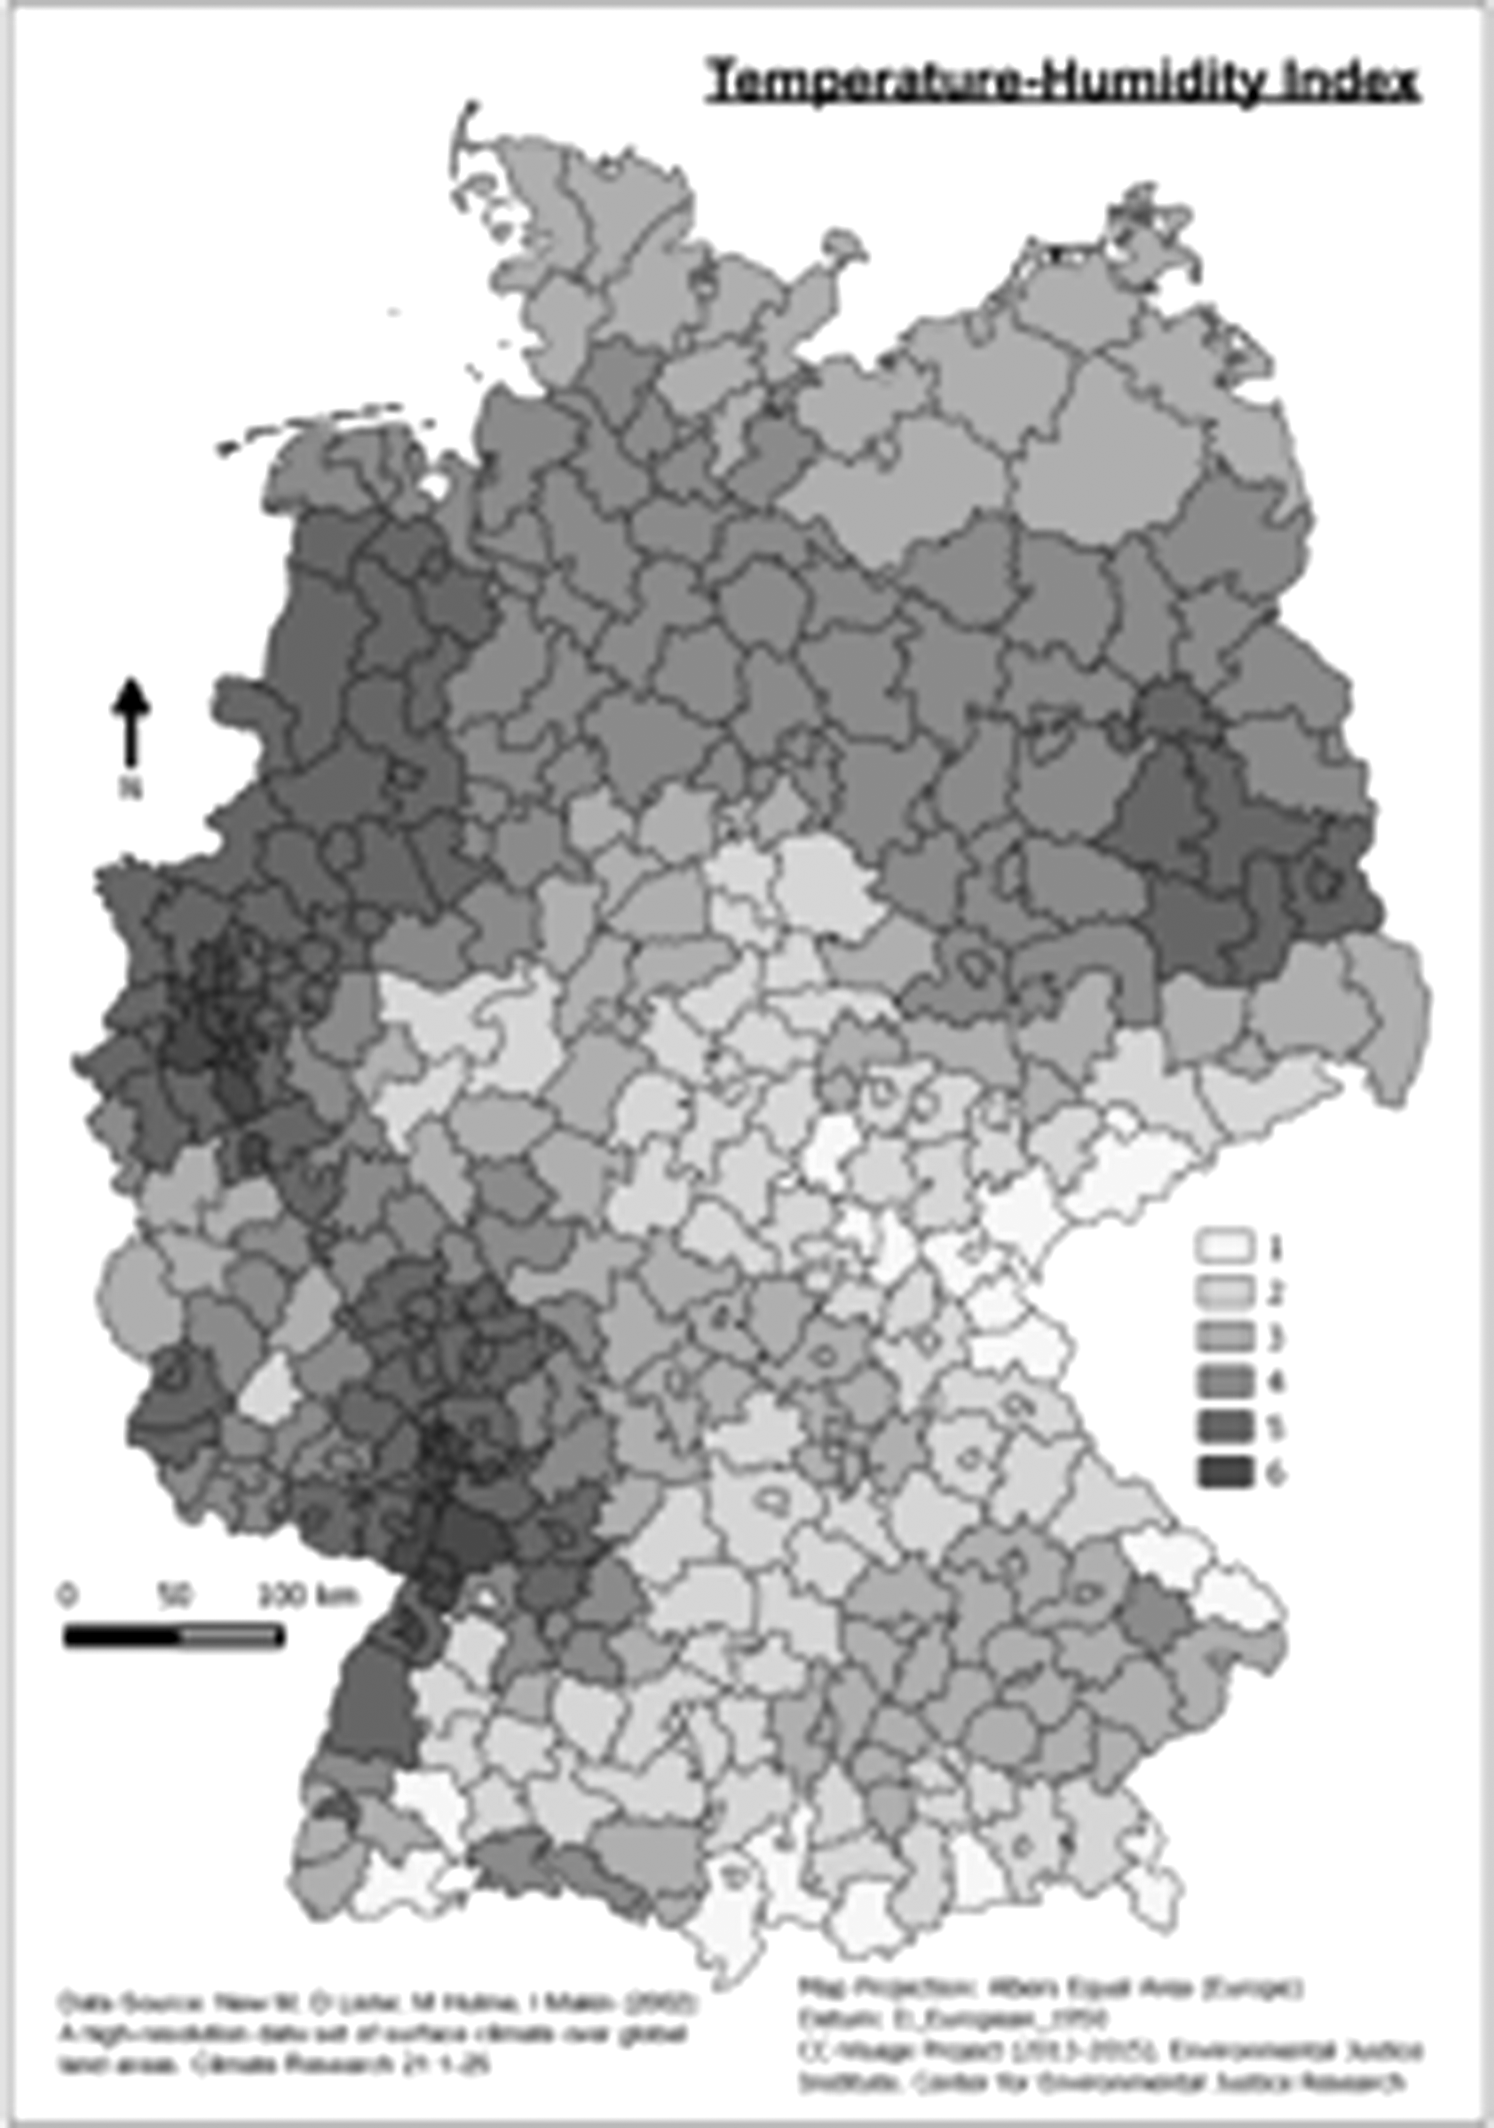
GIS model of the Temperature Humidity Index (THI) in Germany.
As can be seen from Table 9, especially cities located at the upper and middle Rhine valley and in the big urban agglomerations around Cologne and Düsseldorf had the highest THI. More areas with high THI values were found in the eastern parts of the country between Berlin and Cottbus.
CEJI
The regions exhibiting the worst CEJI values were all situated in western Germany (Figure 3). But northern and northeastern Germany, especially the city of Berlin, showed high CEJI, too.

GIS model of the Climatological Environmental Justice Index (CEJI) in Germany.
All areas in the list with the highest CEJI (Table 10) had a value over 5 in addition to a THI of 6 and HSI between 4 and 4.5. Baden-Baden, Duisburg and Düsseldorf had two HSI subcategories with a rating of 6, Mülheim an der Ruhr and Oberhausen one subcategory with the worst rating, and Frankenthal, Mettmann, and Solingen none. Duisburg, Düsseldorf, and Oberhausen belonged to the 5% with the highest population density in Germany and thus received a rating of 6. In addition, Duisburg and Düsseldorf were part of the 5% with the highest proportion of immigrants in the country. Baden-Baden and Mülheim an der Ruhr belonged to the 5% with the highest female quota in Germany, and Baden-Baden additionally belonged to the 5% with the highest proportion of people in an age-conditioned risk group.
Canada
HSI
The HSI in Canada was highest in the central and eastern parts of the country as can be seen in Figure 4.

GIS model of the Human Stress Index (HSI) in Canada.
According to Table 11, divisions from the provinces Manitoba, Saskatchewan, and Nova Scotia belonged to the worst areas.
Division 18 (Saskatchewan) and Manitoba Divisions 19, 22, and 23 belonged to the 5% of the areas holding the highest proportion of immigrants, lowest proportion of educated residents, lowest income, and highest proportion of people under age-conditioned risk. Divisions 16 and 17 from Manitoba belonged to the 5% with the highest proportion of people under age-conditioned risk, too. Both divisions of Nova Scotia were under special risk according to the HSI, because of their high proportion of females and their low income and proportion of educated residents.
THI
The THI for Canada shows a strong north-south gradient exhibiting higher values in the southeastern and southwestern parts of the country and lower values in the north (Figure 5).
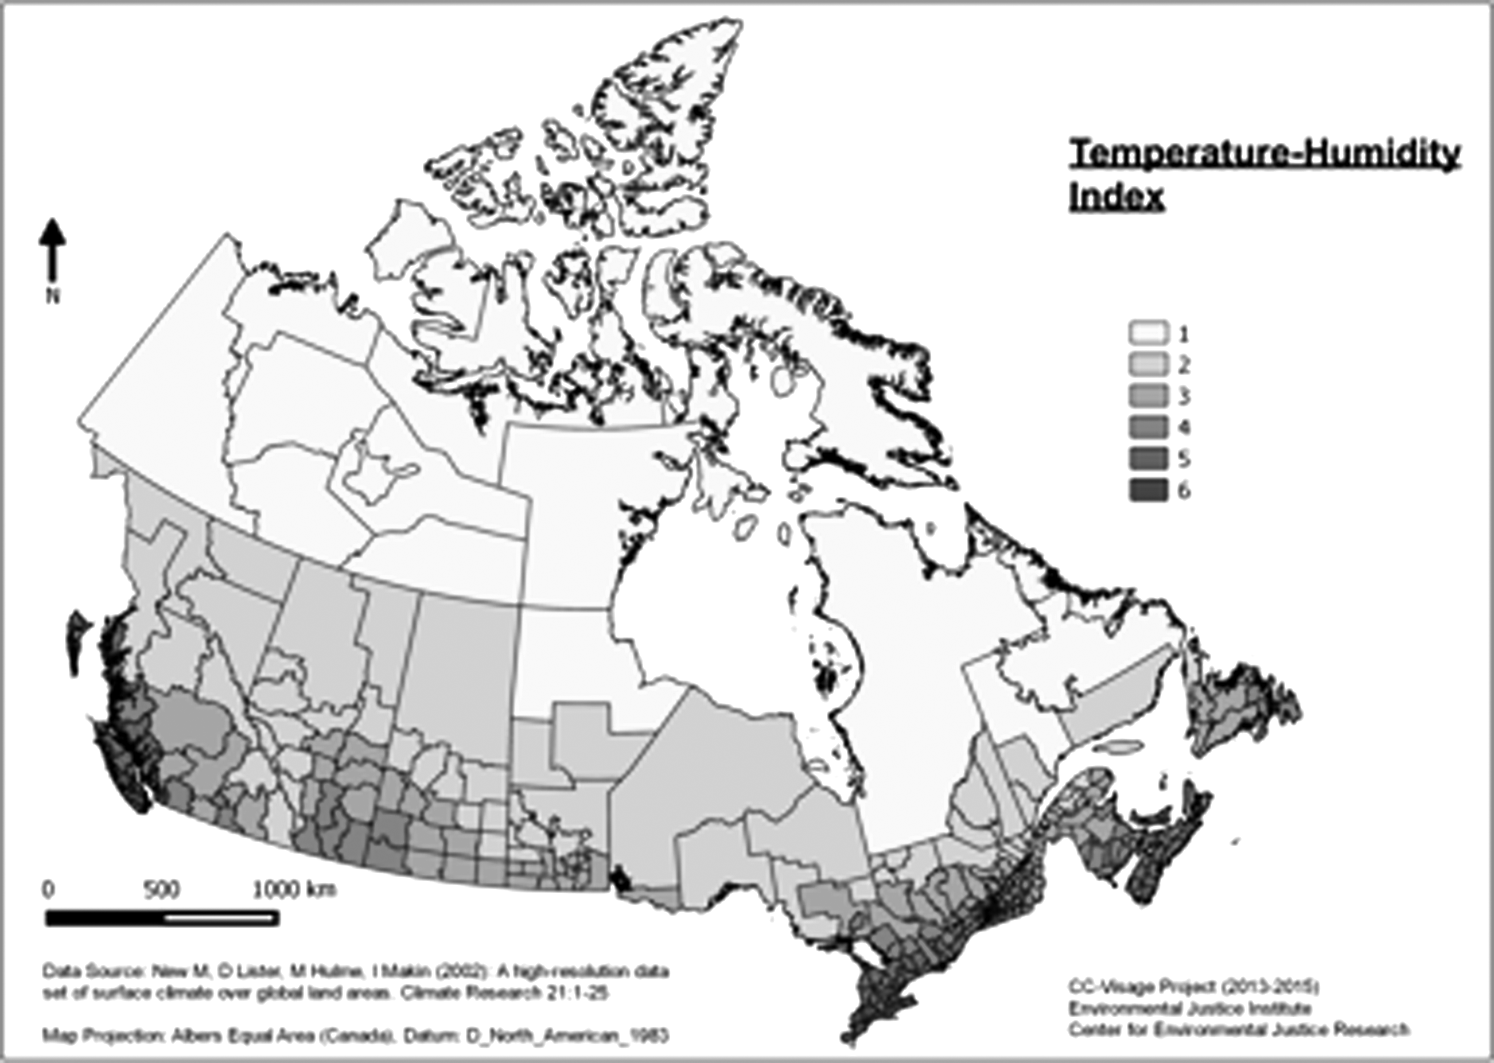
GIS model of the Temperature Humidity Index (THI) in Canada.
Parts of the provinces Ontario and British Colombia are especially subject to a relatively high climatic vulnerability and lead the THI ranking with the worst grade (Table 12).
CEJI
The CEJI has its highest values in the southeastern and southwestern parts of the country in addition to some regions in central Canada (Figure 6). Regions with the highest CEJI are exclusively situated in Ontario and British Colombia and show a CEJI around 5 (Table 13).
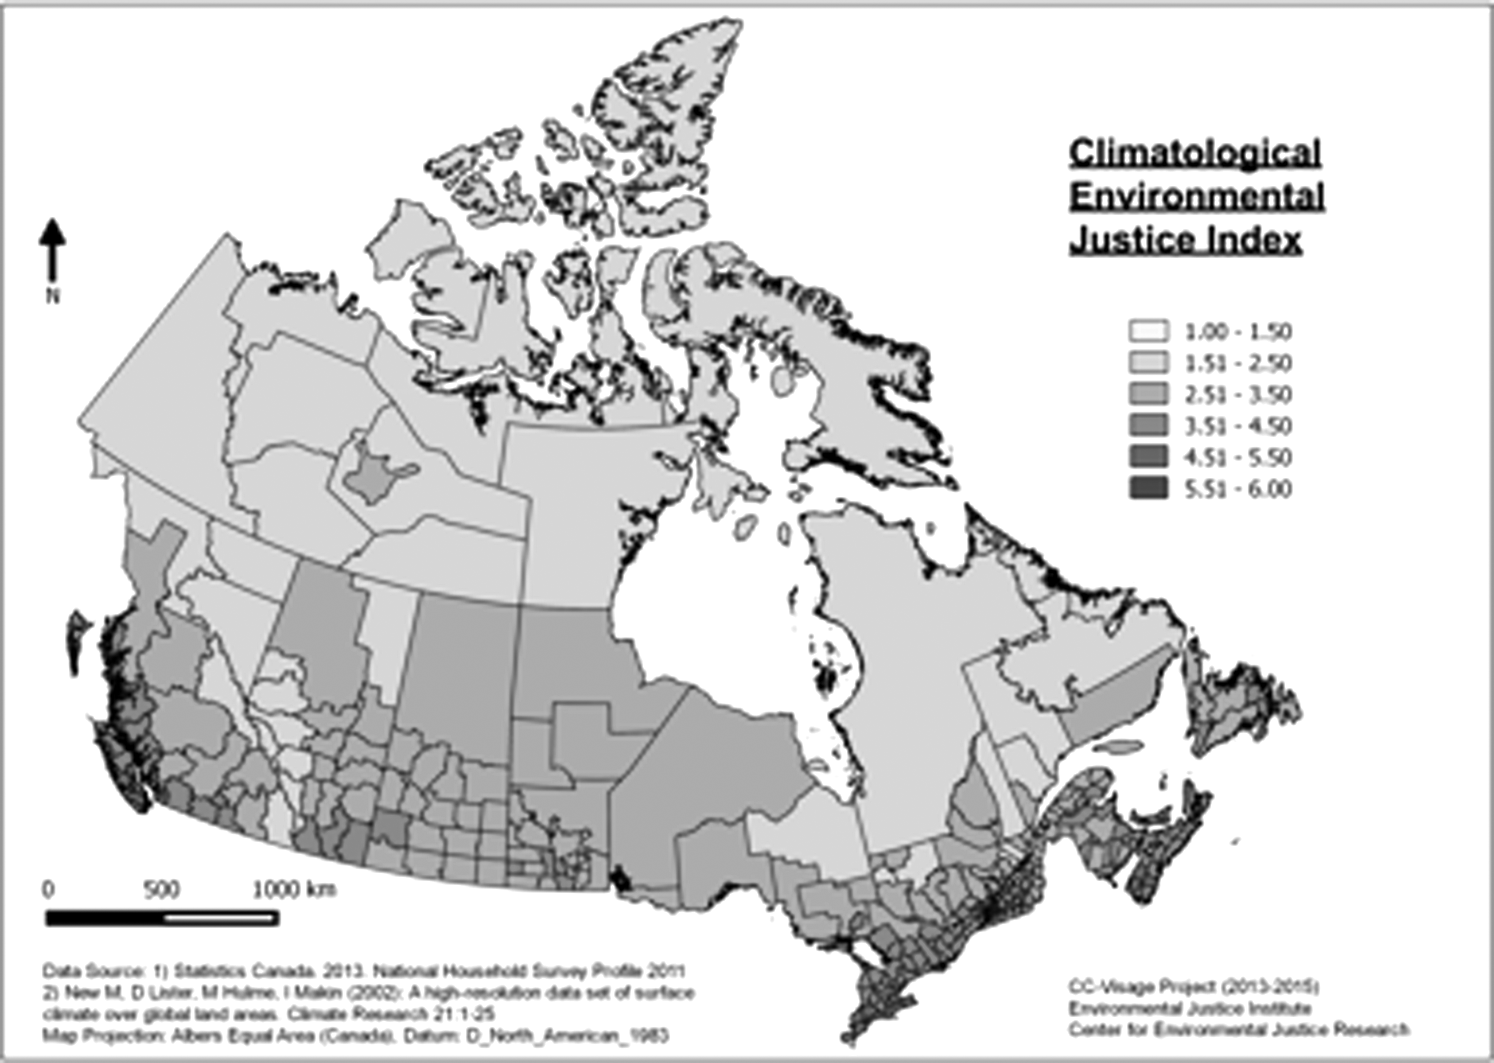
GIS model of the Climatological Environmental Justice Index (CEJI) in Canada.
All top regions are characterized by a THI of 6 and HSI values around 4. The worst social variables for the districts Chatham-Kent, Brant, and Niagara in Ontario are population density and the proportion of female inhabitants. Nanaimo (British Colombia) and Prince Edward (Ontario) earn their bad HSI rating through bad grades in population density, proportion of females, and proportion of age-groups at risk, especially a high amount of old people. Elgin (Ontario) and Alberni-Clayoquot (British Colombia) each only have one social category, where they belong to the worst 25%, population density and proportion of immigrants, respectively.
Brazil
HSI
The HSI is highest in the north and northeast of the country and lower in the central parts like Mato Grosso (Figure 7). The regions exhibiting the highest HSI, with values around 5, are all situated in the northeast including Palestina (Alagoas), Itaparica (Bahia), and Coelho Neto and Trizidela do Vale (both Maranhão, see Table 14).

GIS model of the Human Stress Index (HSI) in Brazil.
Palestina, Coelho Neto, and Trizidela do Vale have similar social structures with high values for population density, female proportion, immigrant quota, and proportion of age-groups under risk, as well as low income and good education. The social structure of Itaparica differs from these through higher income, a lower percentage of inhabitants in an age-group under risk, and fewer inhabitants with a good education.
THI
The THI for Brazil shows a distinct north-south gradient with higher climatic stress in the northern parts of the country around the equator and lower values in the southern districts of Santa Catarina and Rio Grande do Sul (Figure 8). The highest THI is identified for broad parts of Ceará, Maranhão, Pará, and Amazonas (Table 15).
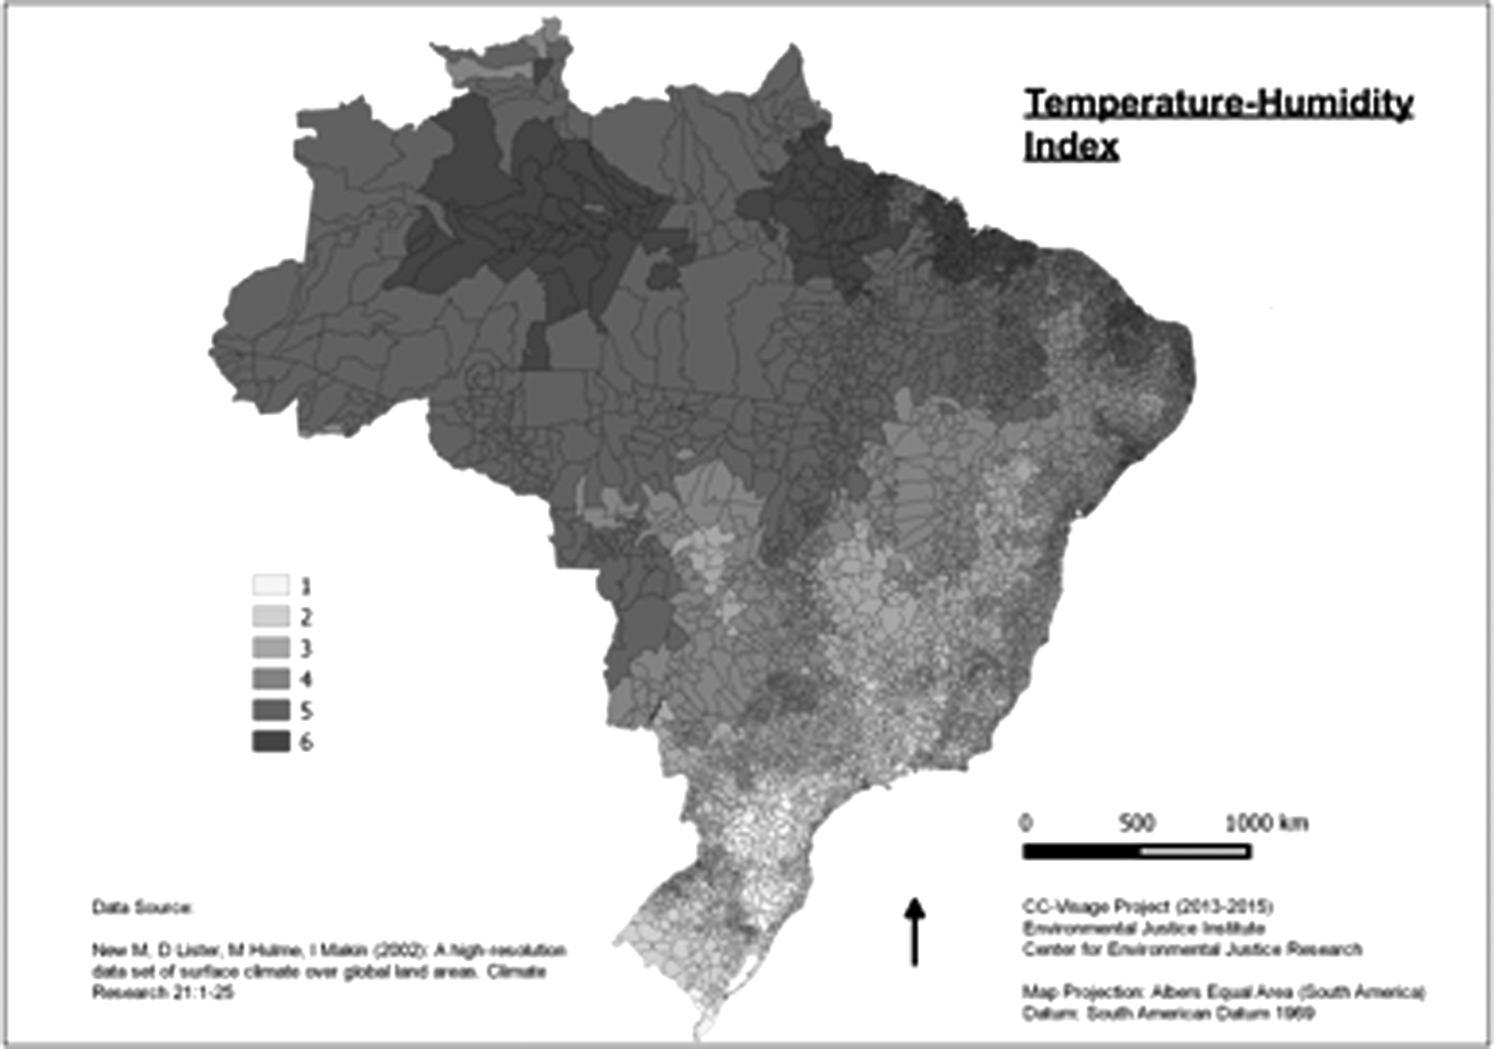
GIS model of the Temperature Humidity Index (THI) in Brazil.
CEJI
The CEJI follows a latitudinal gradient with higher values in northern Brazil near the equator and lower values in the south (Figure 9). Higher values stretch over the states Ceará, Piauí, Maranhão, Pará, and Amazonas; lower values are observed for parts of Rio Grande do Sul, Santa Catarina, Paraná, and Minas Gerais. The regions having the highest CEJI are situated in Maranhão with Coelho Neto, Trizidela do Vale, Monção, Penalva, and Santa Inês, and in Amazonas with Parintins (Table 16).

GIS model of the Climatological Environmental Justice Index (CEJI) in Brazil.
They all have a CEJI between 5.3 and 5.5, THI of 6, and HSI between 4.5 and 5. Most of the social subscores rate all the regions in the lower 25%, except for population density and female quota in Monção, Penalva, and Parintins; income in Parintins and Santa Inês; and education in all areas.
Discussion
Even though the creation of the indices as such reveals both many opportunities and findings, they also carry multiple shortfalls.
As for the HIS, the survey systematics varied between the three censuses for some variables. The climatological variables of the THI reflect the “best comparable” dataset for all three countries and leaves out many. The chosen variables are considered the most comparable data available.
The HSI variables use YO for people aged below 18 in the German and Canadian censuses, but defined as people aged below 16 in the Brazilian census. The variable NWP was defined as foreigners in the German census and as foreigners and indigenous people in the Canadian census. In Brazil, the census measures the self-determination of people defining themselves as non-white (brown, Afrobrazilian, Asian, indigenous, among others). The variable ED on the other hand was defined as people leaving school without certificate in the German and Canadian censuses. In the Brazilian census the data count was for people not properly educated by the age of more than 10 years in private households. The variable IN was collected as the income in the German and Canadian censuses and as income classes by several times of the minimum salary (salário mínimo) in the Brazilian census.
Because of its climatological position in Mid-Europe, Germany is mainly influenced by the prevailing westerlies and the strong influence of the general weather situation from the west during all seasons. The climatological position of Canada on the other hand is strongly influenced by the polar jet stream, which in turn is affected by the massive mountains going from north to south. During summer, the maritime air is sent northwards. In winter, the polar air goes southwards. Brazil's decreasing trend occurs due to its position in the tropics and subtropics. Going from north to south, Brazil crosses the climate of the tropical rainforest combined with the tropical climate of the monsoon, tropical savanna climate, and humid subtropical climate, among others. Based on the different climatological conditions of the three countries, the THI was chosen as the most optimal choice, even though it accounts alone for the combined effects of environmental temperature and relative humidity. THI does not account for solar radiation or air movement and does not enable measurement of the accumulation of heat load over time. But, if the chosen limits are considered as acceptable, the index is a useful approach to assess the risk of heat stress. As for the vulnerable areas, the problem here remains that Canada's vulnerable areas in the Northwest Territories are vanished by their lack of high temperature and humidity accompanied by the non-recognition of the glaciers' melting through the THI.
The statistical units for the GIS model also vary broadly. The availability provided units as small as 100 m2 (a building in the city district of São Jorge in Brazil) to 1,041,196.17 km2 (Baffin, Nunavut in Canada). Adjusting the Brazilian data by integrating smaller units in the next bigger ones made Martim Vaz Island the smallest unit in Brazil with 0.46 km2. Considering the sizes as such, there is also an issue of data availability in Germany as considered in recognized literature. 27 Thus for instance, Germany's capital of Berlin is considered as one statistical unit even though it contains 12 counties and 96 urban districts. As for Berlin, a project of the Berlin senate department has created an atlas for environmental justice accompanied by researchers from Humboldt University of Berlin, 28 but this hasn't been available for further use yet.
Consequentially, the CEJI carries all the stated shortfalls of the combined HSI and THI in terms of the comparability between countries, differing social data, spatial resolution of administrative levels, social variables, and climate data, plus the lack of involving other variables related to climatic vulnerability (precipitation, droughts, etc.). Overall, the definition of climate change in the context of environmental justice as used here can also be questioned. The CEJI therefore must not be seen as the end of a way to go, but as the beginning of a journey with many crossroads.
Conclusion
The development of an internationally comparable CEJI based on the creation of a similarly comparable HSI gives the unique opportunity to place environmental justice research on a truly global scale. With help of the CEJI and the HSI, following researchers will be able to look up the behavior patterns of a given incident or case in different countries. Following and ongoing 29 field research as part of or outside of the CC-VISAGES project will help to give evidence or falsification for the hypothesis that there is a global environmental injustice pattern of climate change impacts.
Besides the vertical deepening of the findings by field researches, the project aims now to horizontally broaden the field by adding survey data of further countries to the existing three cases.
Footnotes
Acknowledgments
Special thanks go to our colleague Dr. Jason Samson from McGill University in Montréal, Canada, who is the co-initiator and member of the project (2013–2014). He laid the foundation of the HSI by collecting the data from Canada and Brazil. Furthermore, we want to thank the German Stiftung Deutsch-Amerikanische Wissenschaftsbeziehungen (SDAW) for the granted funding in the period of 2013–2015. Finally, we want to thank the German Bundesagentur für Arbeit for providing sourcing when the SDAW funding ended, which allowed us to finish the work.
Author Disclosure Statement
The authors have no conflicts of interest or financial ties to disclose.