
Abstract
Abstract
Although scholars have spent a great deal of time describing, and identifying, the mechanisms behind environmental inequality, they have spent far less time exploring the other side. Environmental privilege, conceptualized as the inverse of environmental inequality, allows access to coveted environmental amenities (coastland and greenspace) and freedom from environmental burdens (industrial contamination). This article develops methods for scholars, policy makers, and activists to assess environmental privilege using GIS and the tools of spatial analysis. Using Rhode Island as a test case, it develops an environmental privilege index that takes into account the socioeconomic and environmental dimensions of environmental privilege. The research presented in this article could serve as the basis for further assessments of environmental privilege in other settings, but modifications to the framework will be necessary to capture differences in social and ecological contexts.
Introduction
I
This article takes a step in that direction with the help of ArcGIS and the tools of spatial analysis. Rather than focusing on the causal mechanisms that contribute to environmental inequality, this article presents a novel means of measuring and visualizing environmental privilege. In this article, I develop an environmental privilege index (EPI), which takes into account both socioeconomic (income, education, etc.) and ecological factors (industrial areas, conservation lands, scenic areas, etc.) in an effort to measure and map environmental privilege in the test case of Rhode Island, United States. Ultimately, the methods employed here can and should be modified to better accommodate the social and ecological contexts of various locales worldwide. Thus the main contribution of this article is in developing a methodological approach to measuring environmental privilege that might be used by social movement organizers for environmental justice purposes or government officials to think about how to best address their constituents’ needs.
Study Area
Rhode Island is the smallest, and eighth least populous, state in the United States. It is bordered by Massachusetts in the north and east, Connecticut in the west, and the Atlantic Ocean in the south. Also known as “The Ocean State,” the state's bays, inlets, and coastlines figure prominently in the popular geographic imaginary. In terms of demographics, as of the 2010 U.S. census, Rhode Island's population was 1,052,931. Providence, the state's capital, is the most populous municipality (178, 432) and home to the majority of Rhode Island's racial and ethnic minorities. Figure 1 provides a map of Rhode Island's racial population distribution.
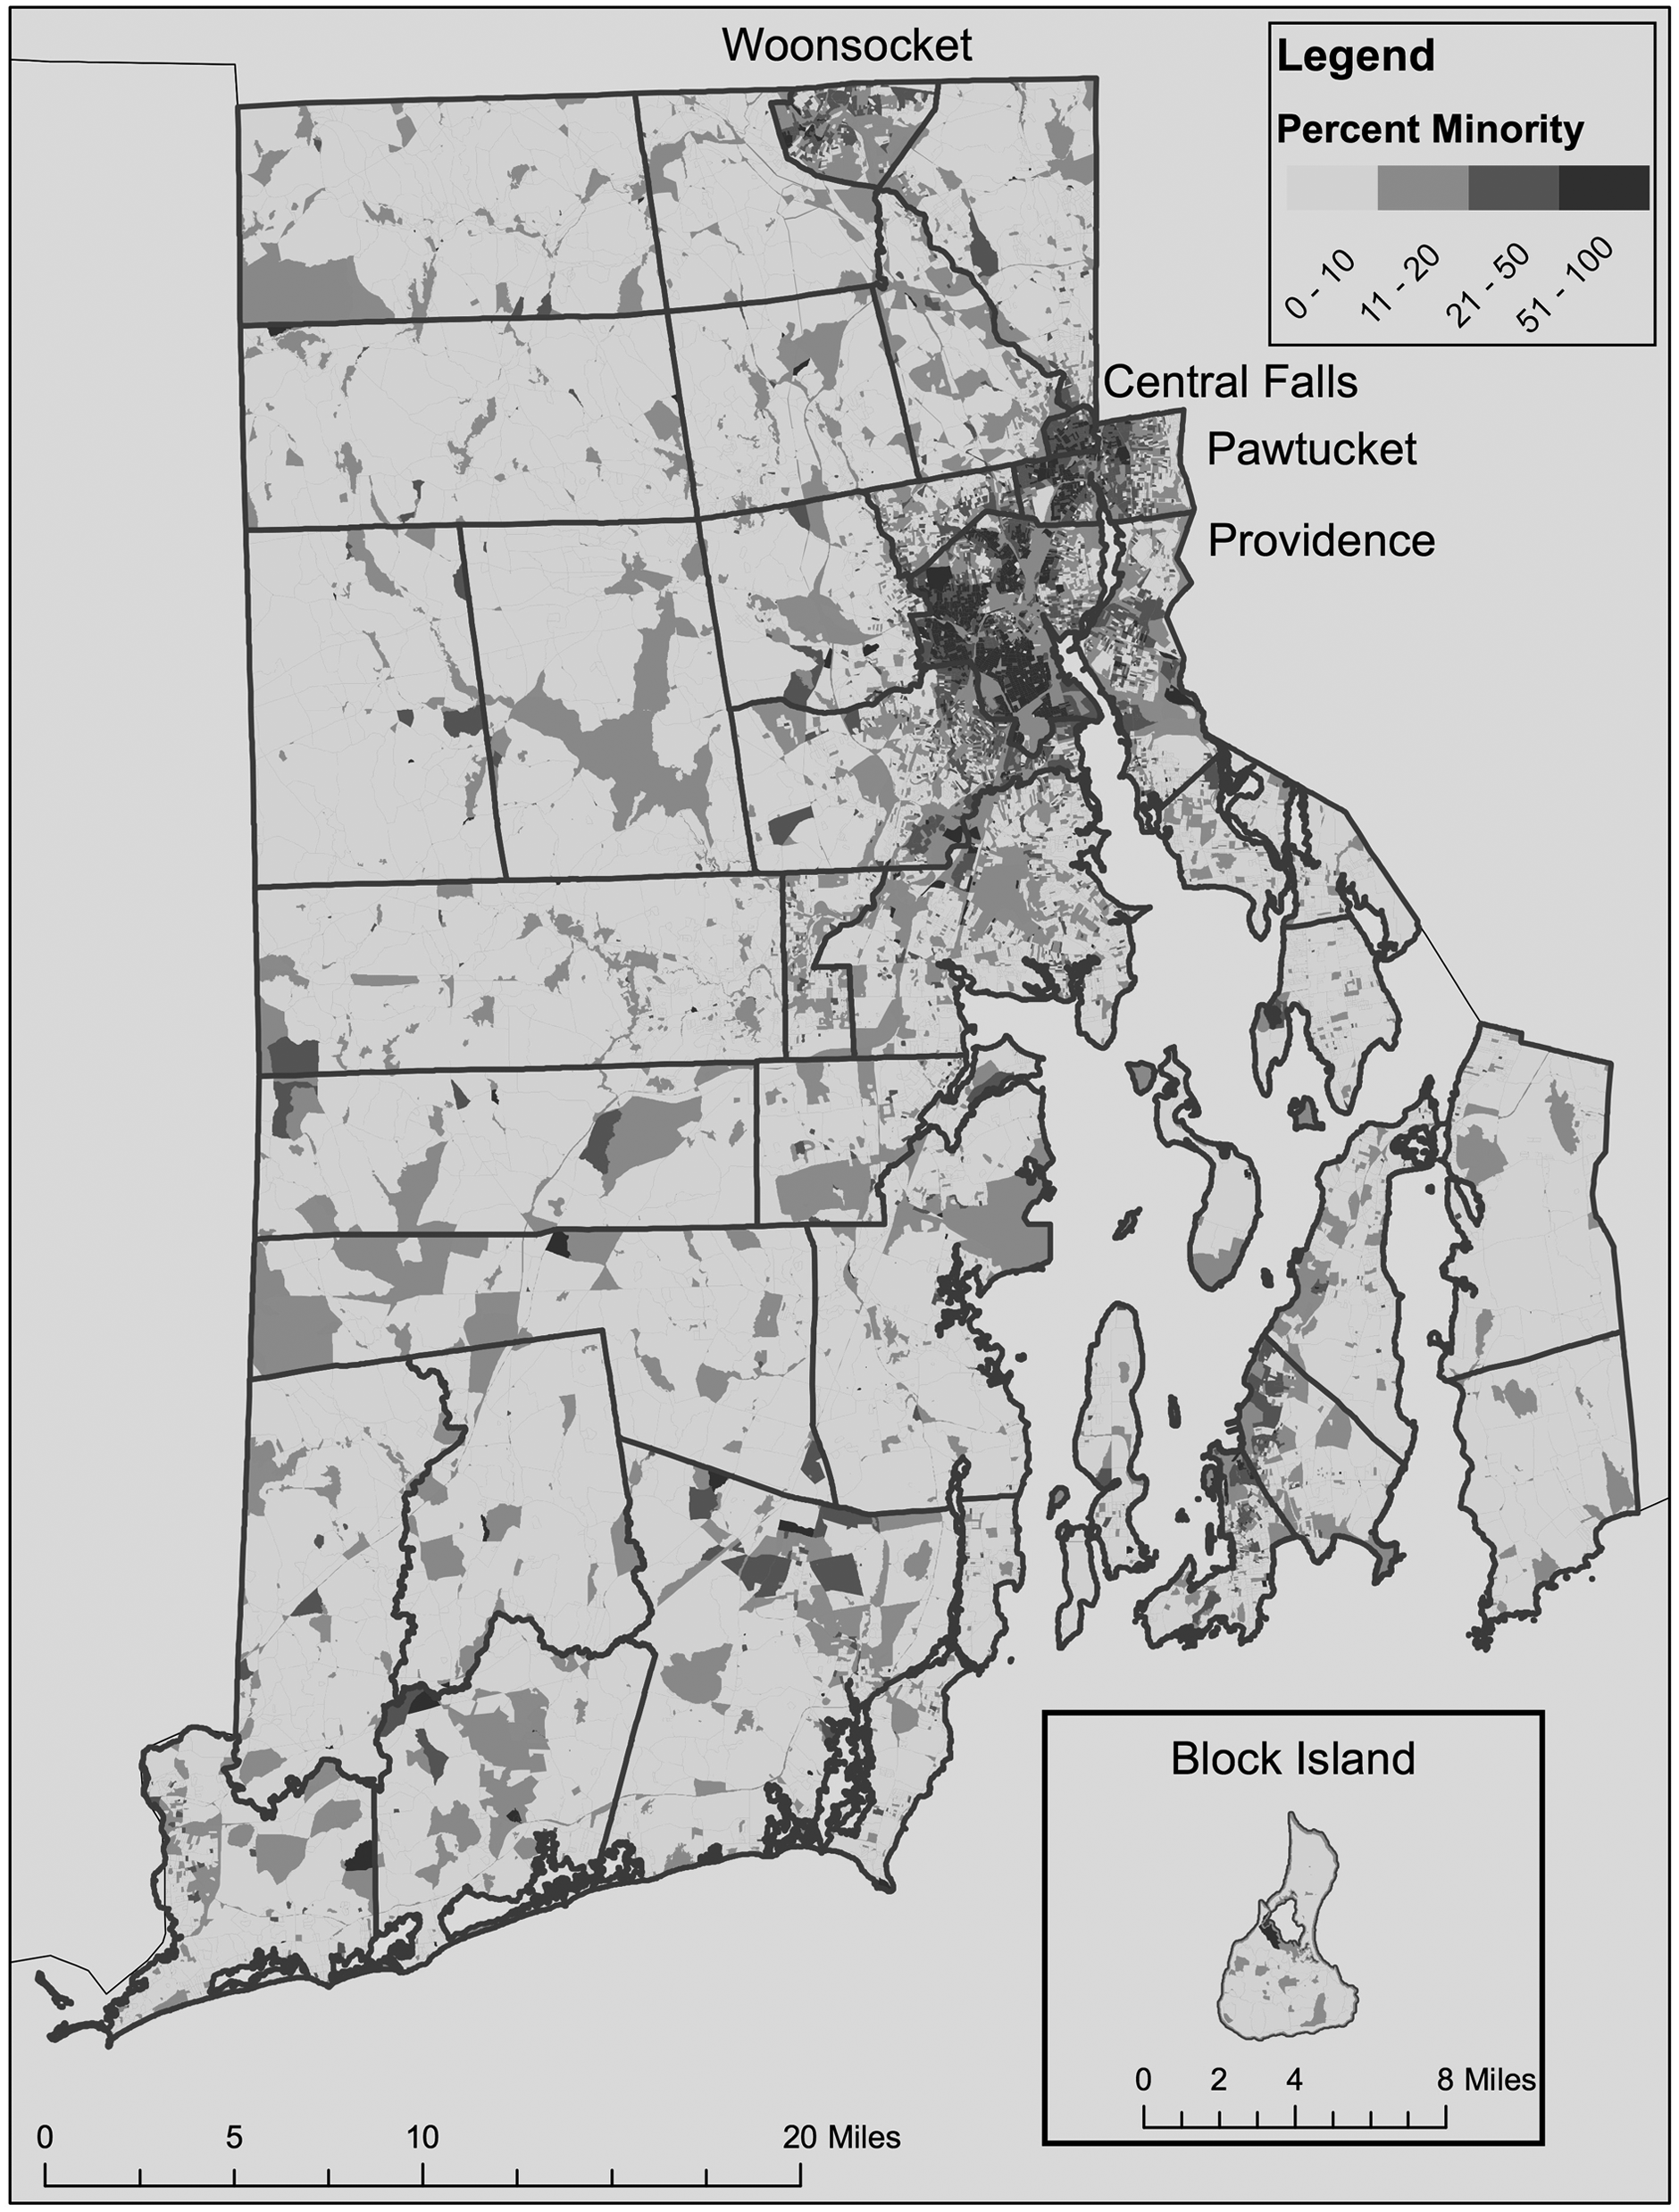
Racial and ethnic population distribution in Rhode Island.
The state has a long industrial history and is known as the birthplace of the American industrial revolution, as the first textile mill in the United States was built in the state in 1793. 5 This history has resulted in the extensive contamination of the state's land and water. The United States Environmental Protection Agency currently lists 13 sites within the small state as national priorities for releases of hazardous substances or pollutants. 6
Methodological Approach
Today, there are indices to measure human development, climate change vulnerability, poverty, environmental performance, and many other aspects of social significance. 7 The primary objective of this article is to offer readers an exemplar of how we might begin to evaluate environmental privilege for policy and/or political purposes. Following the example set by the multitude of indices that abound today, I present a prototypical index for evaluating environmental privilege using indicators along two dimensions of environmental privilege, taking into account socioeconomic and ecological factors.
Environmental privilege is not simply about freedom from burdens such as exposure to air pollution and various other forms of toxic contamination, but also the advantage of being able to access various amenities such as lakes, parks, and beaches for recreational purposes. People who have more economic capital, for example, are more likely to be able to afford to visit any given national/state park that is a considerable distance away from their own residence, and further are more likely to be able to deal with the deleterious impact of exposure to various hazards, whether they be hurricane damage to their homes or bodily harm from pollutants. For the purposes of this EPI, I utilize four different measures to capture the socioeconomic factors and seven measures to capture the environmental/ecological factors in an effort to capture environmental privilege in the context of Rhode Island (Fig. 2). 8
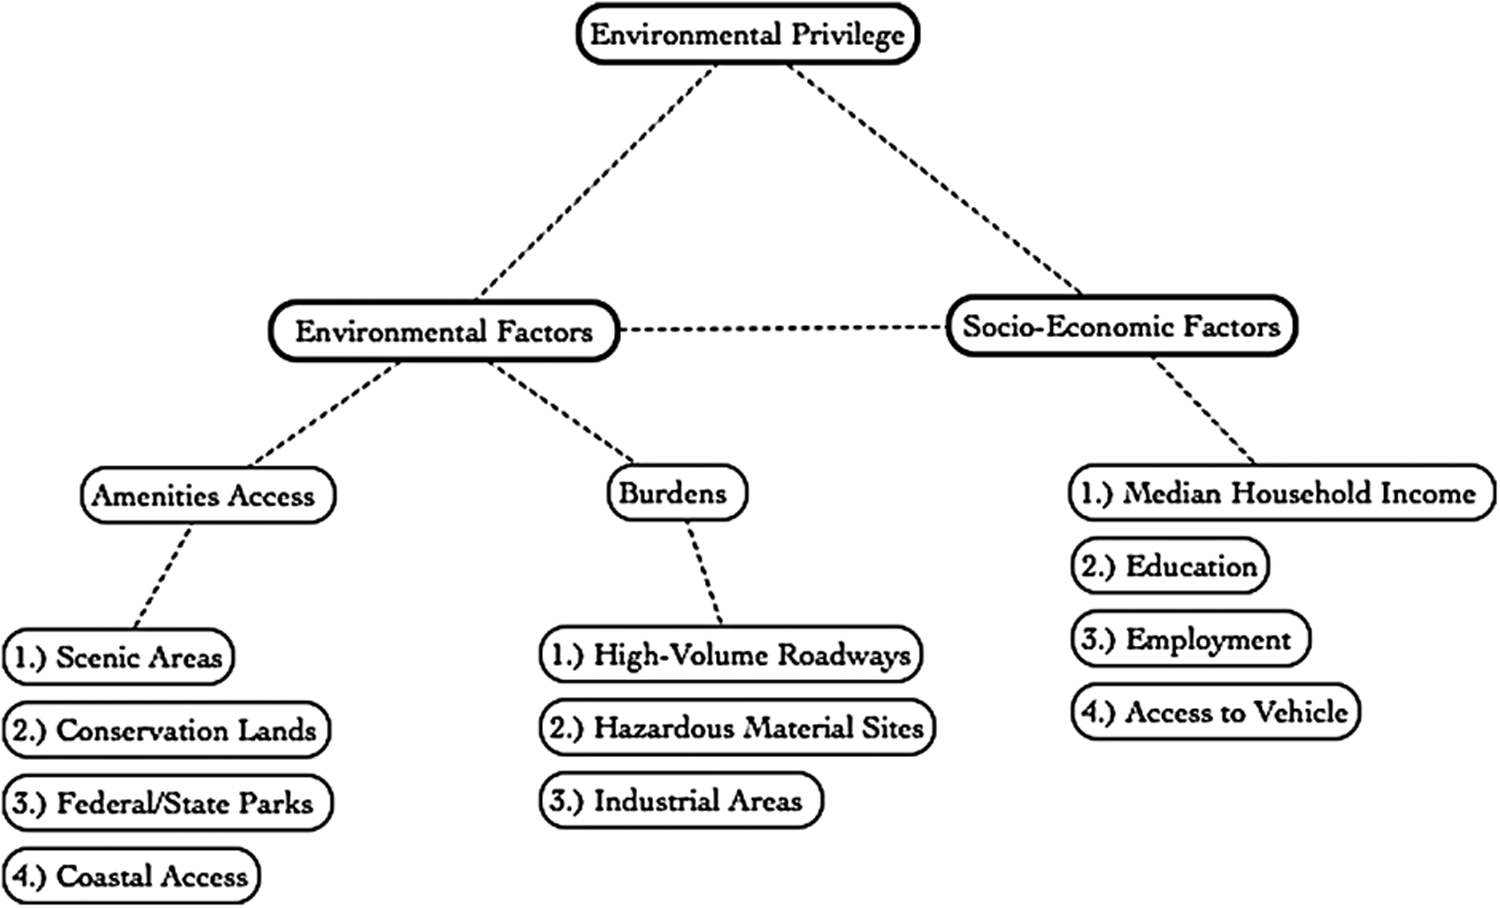
Measuring environmental privilege in Rhode Island.
Using data from the 2000 U.S. Census at the block group level that was formatted as a shape file from the Rhode Island GIS (RIGIS) data depot (organized by the University of Rhode Island), I utilized various measures of socioeconomic status. 9 As a measure of income, I utilized median household income, because having a higher income affords an individual or household more flexibility in dealing with issues of environmental and bodily health, but also more liberty when it comes to accessing coveted environmental resources. Of course, more money means more opportunity to travel, but also the possibility of buying a home in a neighborhood with more environmental amenities and less burdens. For educational attainment, I consider the percentage of each census block group with at least a bachelor's degree. Employment is measured by the percentage of each block group that is employed. Education and employment are important considerations because both are associated with privileged access to various material resources. Vehicular access was measured by considering the percentage of occupied household units with access to at least one car. Access to a car is important because it is harder to reach certain amenities without one. Public transportation simply will not get you to certain parks, beaches, etc. within the state of Rhode Island.
Environmental factors contributing to environmental privilege were broken down into two categories: burdens and amenities access. As measures of amenities access, RIGIS data on scenic areas, conservation lands, federal/state parks, and coastal access were used. The spatial analysis (geoprocessing) tools of ArcGIS were used to ascertain access in two main ways. First, using network analysis, Manhattan distances (over the road network in miles) were calculated from the centroids of each census block group to the closest coastal access points and closest federal and state park. Second, spatial joins were used to determine whether or not there were scenic areas or conservation lands overlapping with each block group. To measure environmental burdens, I considered three primary variables: industrial areas, hazardous material sites, and high-volume roadways. Utilizing the buffer tool, I set up boundaries of 0.25 miles around active industrial areas, hazardous material sites, and high-volume roadways. 10 I then intersected these buffered areas with census block group data, and calculated the percentage of each block group covered by each.
Together, these measures provide a sound basis to measure environmental privilege in the context of Rhode Island. However, as the reader will observe in Table 1, I did not provide equal weight to each of these measures, instead, placing emphasis on measures that might matter more.
EPI, environmental privilege index.
To determine the EPI score of each block group, I used a simple formula: EPI score = [Median Household Income] + [Education] + [Employment] + [Vehicular Access] − [Industrial Areas] − [Hazardous Material Sites] − [High-Volume Roadways] + [Scenic Areas] + [Conservation Lands] + [Federal/state parks] + [Coastal Access Points]. Results are discussed in the next section.
Results
EPI scores were calculated for 799 of the 817 block groups in Rhode Island, dropping block groups with zero inhabitants (descriptive statistics are provided in Table 2). Mapped results demonstrate variance in EPI scores for census blocks across the state and show that census blocks located in urban areas of Rhode Island have lower levels of environmental privilege than the suburban and rural areas within the state. These urban areas are also where the majority of the state's people of color and low-income residents reside (as shown in Table 3).
Source: U.S. Census QuickFacts:
In the United States, “Hispanic” denotes an ethnicity that is combined with other racial categories. Hence, the percentages do not add up to 100%, given the overlap between categories.
Providence, Woonsocket, Central Falls, and Pawtucket are the towns that present the most troubling results, which is not too surprising given their respective histories. All of these areas operated as hubs of industry at some point in Rhode Island's history, which means that they are more likely to have industrial areas or hazardous material sites. These are also the municipalities with the highest levels of minority residents (Fig. 3).

Map of environmental privilege in Rhode Island.
Although there are clear patterns of inequality between municipalities on the EPI scale, there are also disparities within them. For example, when we look more closely at Providence (Fig. 4), we see differences across the city. The west and south sides of Providence have low EPI scores, whereas the east side has high EPI scores. Providence's east side is home to Brown University, is inhabited mostly by white people, and is one of Rhode Island's wealthier areas, whereas the west and south sides are inhabited mostly by minorities and working class people. The area on Providence's east side (to the south by Narragansett Bay) that does have low scores was once a predominately Cape Verdean neighborhood until they were forced out by the construction of the I-195 freeway (Tables 4 and 5 and Fig. 5).
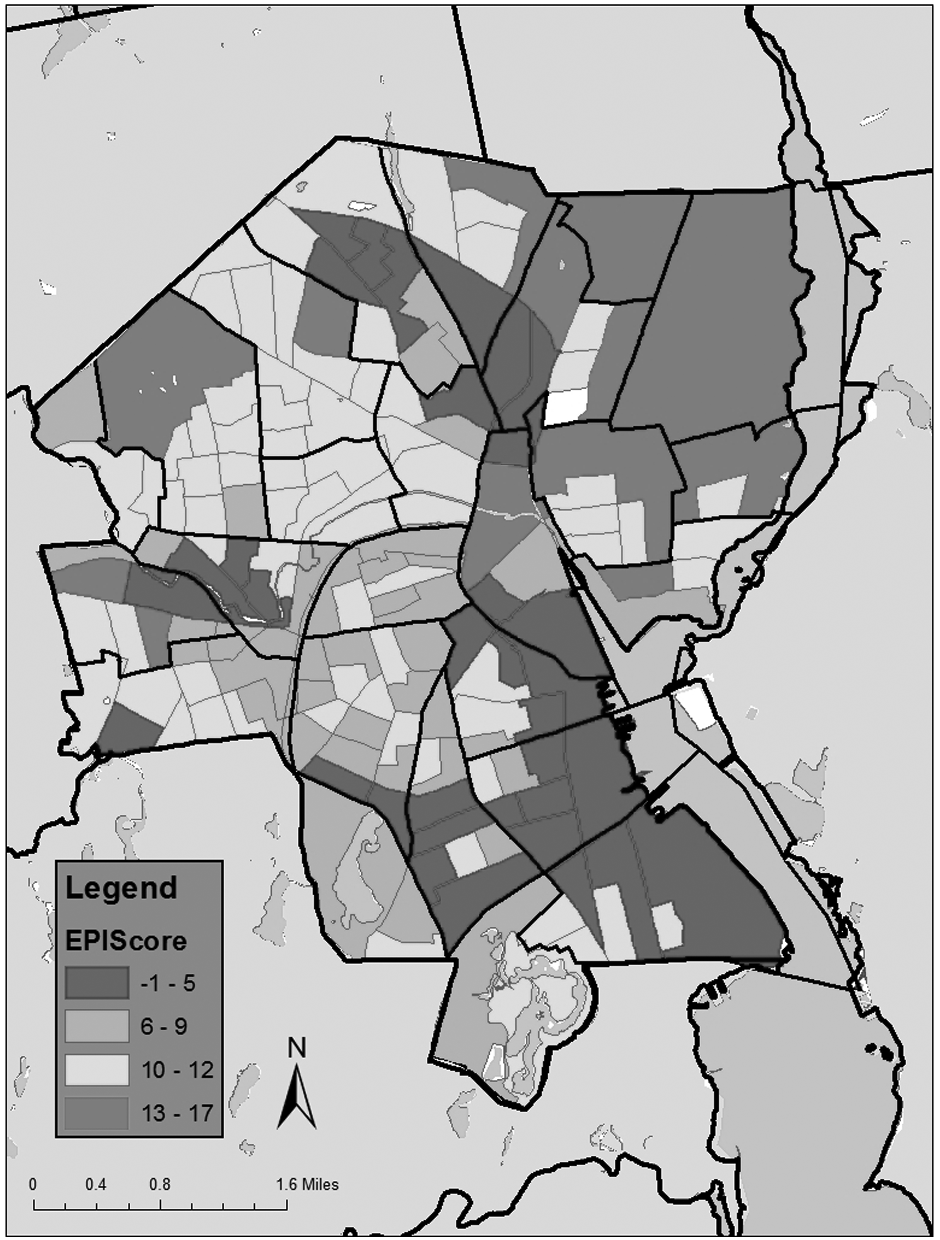
Map of environmental privilege in Providence, RI.
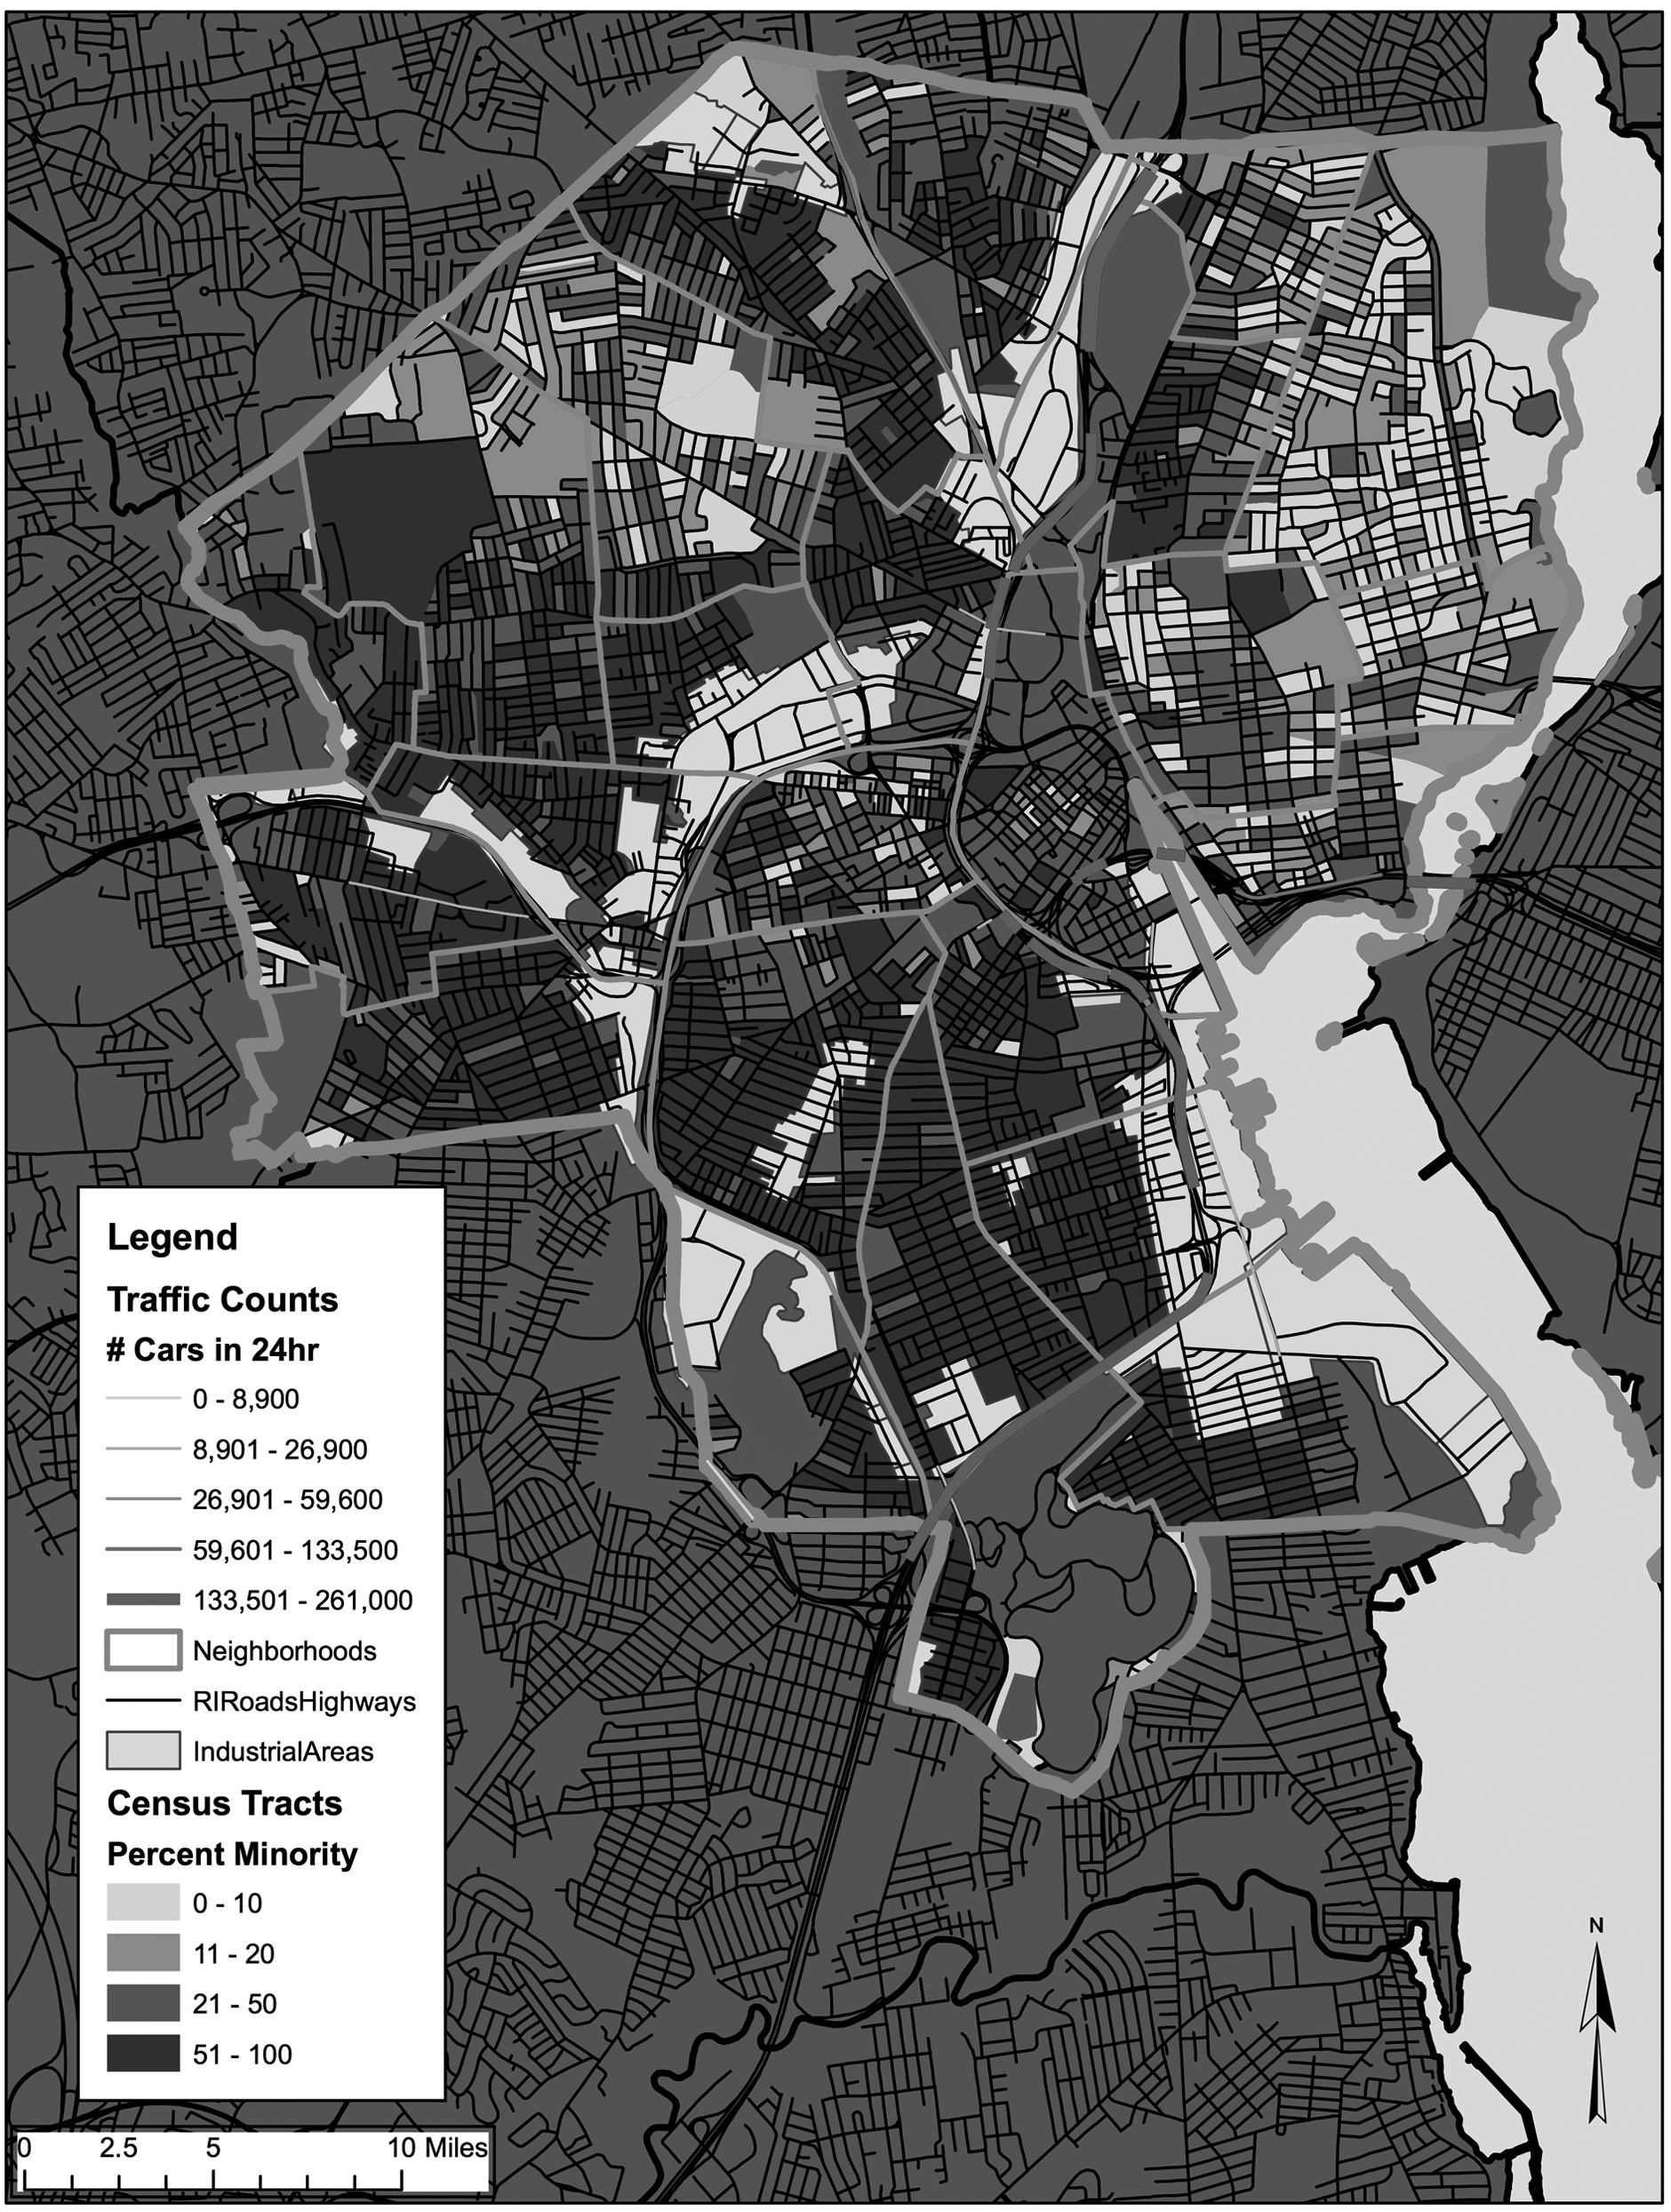
Map of racial and ethnic population distribution in Providence, RI.
Discussion
Rather than providing a causal analysis of the factors leading to environmental inequalities, the approach taken in this article has been far more descriptive in trying to provide a means of first assessing environmental privilege using the tools of spatial analysis. As with any research endeavor, this one carried with it limitations. For the purposes of this iteration of the project, I chose the indicators of environmental privilege on my own, based on my knowledge of Rhode Island and what previous literature has told us about environmental inequality. In doing so, I have tried to provide a baseline measurement of environmental privilege in the context of Rhode Island. The index could be improved by surveying stakeholders across the state about what they believe are important environmental elements in their communities. Perhaps Rhode Islanders are less concerned with access to the coast than they are with access to other recreational areas. Taking communities’ opinions into consideration could assist in constructing the index, providing the researcher with a better sense of how to weight one indicator over another.
Another issue that emerged in the process of this analysis pertains to data. In measuring environmental privilege, I used two dimensions, access to environmental amenities, and proximity to environmental burdens. The environmental burdens that I had data for were industrial areas, hazardous material sites, and high-volume roadways, all made available through the state's GIS data depot. Measuring proximity to industrial areas with the data available to me was a problem in that the data did not distinguish between the types of industrial uses being captured by the shape file. This presents a problem in that I am unable to distinguish between heavy manufacturing industrial activities that are arguably much more important than say the commercial sale of products used in manufacturing.
Still, I believe that the methods of evaluating and comparing environmental privilege presented in this article provide an important contribution in showing researchers how this might be done. Of course, I would not expect anyone to take the approach presented here without modifying it for the social and ecological context of interest. Environmental privilege and inequality are variable across geographical contexts. Rhode Island is a coastal state with a long industrial past and thus my indicators reflected this in taking into account access to the beach and freedom from the legacies of industrial pollution. Other settings will require different configurations of indicators and corresponding data in measuring environmental privilege.
Conclusion
While presenting the analysis of this article in various settings, I have been questioned on whether or not my methodology imposes a definition of what an environmental amenity is or is not that might not match on to what people actually think. Although certainly a valid concern, I defend my decision based on the premise that it is equally, if not more, dangerous to assume that certain social groups do not value having access to forested areas, beaches, camp grounds, lakes, and state and federal parks, for doing so enables the certain individuals to maintain privileged access while ignoring others. It furthermore feeds into the dominant ideology that equates “greenness” with whiteness, 11 and many scholars and activists are working hard to change this narrative, and rightly so because it has dangerous implications. 12 I think it is fair to assume that all people, regardless of skin color, class status, or educational attainment, value freedom from environmental burdens (air pollution, toxic contamination, etc.) and access to environmental amenities (parks, waterways, etc.), and indeed the environmental justice movement that has emerged in the past 40 years is a testament to this fact.
The main contribution of this analysis has been to provide a means of pointing to the privilege that enables some and hinders others. It is up to scholars to help identify the social forces that create and maintain environmental privilege, and activists to provide the groundwork and political willpower to address it. In seeking to map and evaluate environmental privilege, the intent is not to demonize communities with comparatively high levels of privilege. Rather, it is my hope that in creating environmental privilege indices, policy makers and government agencies, as well as community organizers, will gain a sense of where they need to focus their environmental policy and planning efforts most.
Footnotes
Author Disclosure Statement
No competing financial interests exist.