
Abstract
Abstract
As the demand for goods continues to increase, a collective network of transportation systems is required to facilitate goods movement activities. This study examines air quality near the Port of Charleston before its expansion and briefly describes the establishment and structure of a community–university partnership used to monitor existing pollution. Particulate matter (PM) concentrations (PM2.5 and PM10) were measured using the Thermo Fisher Scientific Partisol 2000i-D Dichotomous Air Sampler, Thermo Scientific Dichotomous Sequential Air Sampler Partisol-Plus 2025-D, and Rupprecht & Patashnick TEOM Series 1400 Sampler at neighborhood (Union Heights, Rosemont, and Accabee) and reference (FAA2.5 and Jenkins Street) sites. Descriptive statistics were performed and an ANOVA (analysis of variance) was calculated to find the difference in overall mean 24-hour PM average concentrations in communities impacted by environmental injustice. PM2.5 (15.2 μg/m3) and PM10 (27.2 μg/m3) maximum concentrations were highest in neighborhoods such as Union Heights neighborhoods due to more goods movement activities. Nevertheless, there was no statistically significant difference in mean concentrations of PM2.5 and PM10 across neighborhood sites. In contrast, mean PM10 neighborhood concentrations were significantly lower than mean PM10 reference concentrations for Union Heights (p = 0.00), Accabee (p ≤ 0.0001), and Rosemont (p = 0.01). Although PM concentrations were lower than current National Ambient Air Quality Standards, this study demonstrated how community–university partners can work collectively to document baseline PM concentrations that will be used to examine changes in air quality after the port expansion brings additional goods movement activities to the area.
Introduction
T
By 2018, the South Carolina State Ports Authority (SCSPA) plans to build and open a new marine container terminal along the Cooper River on the former Charleston Navy Base in North Charleston, South Carolina (SC). 4 This facility will add 1.4 million more 20-foot containers that will be processed each year, essentially doubling the Port of Charleston's volume. 5
The proposed port expansion will result in an additional 1300 transits per year to transport goods, 6 where each ship may release 500–1000 pounds of air pollution during an average 14-hour stay in the Charleston Harbor. 7
Marine ports are among the most poorly regulated sources of pollution in the United States, and their goods movement activities are primarily of diesel engines that emit complex mixtures of particulate matter (PM) PM2.5, coarse PM10, volatile organic compounds, nitrogen oxides, sulfur oxides, and other ozone-depleting substances. 8 The California Environmental Protection Agency has already deemed 40 components of diesel exhaust as cancer causing,1 thereby posing a significant cancer risk to populations living near diesel emissions sources. Similar risks in cancer are conceivable in Charleston 9 because the port expansion will increase diesel truck trips by 70% per day, compounding the current estimate of 10,000 vehicle trips/day. 10
With PM being one of the major components of diesel, the collective emissions from truck traffic, marine activity, and other goods movement sources may contribute to noncancer health outcomes. PM is an air pollutant comprising a complex mixture of solid and liquid particles that vary in diameter from ≤10 μm (PM10) to particles with a diameter ≤2.5 μm (PM2.5). Research has illustrated the relationship between PM exposure and increased respiratory and cardiovascular health end points, including increased mortality, 11 hospital admissions, 12 and emergency department visits. 13 Studies also suggest that exposure to PM may be associated with decreased lung function, increases in respiratory disease, and respiratory symptoms such as asthma in children. 14 Other studies have shown that PM contributes to higher cardiovascular mortality risks in elderly patients and populations with comorbidities. 15
With the port expansion underway, exposure to PM concentrations from goods movement activities related to ship and truck traffic emissions may increase or further exacerbate any pre-existing medical conditions in persons living proximal to the port. Residents living near the port may also experience indirect health impacts from traffic congestion, increased noise, and blight. 16 Those most impacted are nonwhite and low-income populations who are differentially exposed to environmental and psychosocial stressors related to goods movement activities.16
Port communities in Houston, Gulfport, New York, New Jersey, and Charleston have organized to address many of the health concerns that may accompany their respective expansions. 17 In 2005, the Low Country Alliance for Model Communities (LAMC), a community-based organization concerned about environmental injustice, was organized by residents of seven economically distressed neighborhoods in North Charleston. 18 LAMC was primarily established to address potential negative impacts associated with the planned port expansion, particularly increased levels of air pollution because of additional diesel truck traffic in a community disproportionately burdened by environmental hazards.18
In addition, LAMC developed a mitigation plan agreement with the SCSPA under the National Environmental Policy Act to address impacts of the port expansion.17,18,19 As part of the agreement, the SCSPA agreed to provide funding to establish and support an ambient air monitoring site in the Charleston Neck area to monitor any changes to the local air quality. 19 The Charleston Neck is where the communities of LAMC are located and is characterized by high-density car traffic, industrial pollution sources, and port-related diesel truck traffic.
In this article, we describe the establishment of a community–university partnership to assess air pollution levels related to goods movement activities (i.e., ship and truck traffic emissions) in impacted neighborhoods in North Charleston, SC. Data are presented on baseline levels of PM2.5 and PM10 in partner neighborhoods before the port expansion. The secondary objective is to compare the data with reference site concentrations to determine whether PM levels are elevated in neighborhoods with high goods movement activity.
Methods
Community–university partnership to explore air pollution issues
Community leaders from LAMC approached researchers at the University of South Carolina (USC) in Columbia, SC, to assist with implementing the environmental monitoring component of the mitigation agreement. We obtained funding from the National Institute of Environmental Health Sciences (NIEHS) to establish the Charleston Area Pollution Prevention Partnership (CAPs) between LAMC, Rosemont, the South Carolina Department of Health and Environmental Control (SCDHEC), USC, and other entities. The CAPs partners worked collectively to facilitate and perform air monitoring in the three communities under study (Accabee, Union Heights, and Rosemont) and host environmental health workshops for local residents. Additional information regarding the establishment of the CAPs 20 and their efforts to address local and statewide environmental health disparities is outlined in other publications. 21
The community–university partnership used a community-based participatory research (CBPR) framework that combines traditional scientific methods with community engagement, capacity building, citizen science, and translation of research to action. Aside from the use of a CBPR framework, we also incorporated Community-Owned and Managed Research (COMR) principles and a Collaborative Problem Solving (CPS) approach 22 to maximally benefit our study community. The COMR model emphasizes the community's right to develop, maintain, and sustain their own research plan, 23 which can be supplemented with a CPS approach that uses multiple stakeholders to address a specific environmental and/or public health problem. 24
Air monitoring methods
We measured PM2.5 and PM10 at the neighborhood sites using the Thermo Fisher Scientific Partisol 2000i-D Dichotomous Air Sampler, which simultaneously collects fine and coarse ambient PM. Size-selective inlets separated the particulates that were collected on a Teflon filter and shipped to the laboratory after each sample day. The sampling events (i.e., days when all samplers were scheduled to operate) were successfully performed from July 2012 to April 2013 and mirrored the United States Environmental Protection Agency's (USEPA's) national 1/3 day monitoring schedule for community and reference sites. 25
SCDHEC reference monitors
The FAA PM2.5 reference monitor was located in a suburban area northwest of the community sites and is part of the SC Ambient Monitoring Network. The Thermo Scientific Dichotomous Sequential Air Sampler Partisol-Plus 2025-D measured PM2.5 daily, and the duration of the FAA sampling period corresponded with the USEPA's 24-hour (±1 hour, midnight to midnight Eastern Standard Time (EST)) Federal Reference Method (FRM) protocol for filter-based samples. 26 The PM10 reference monitor located on Jenkins Street in the downtown area of North Charleston, SC, represented urban air pollution levels. Owing to the predominant south-southwesterly wind direction, this site would unlikely be impacted by PM10 emissions related to port activities. The Rupprecht & Patashnick TEOM Series 1400 Sampler, a Federal Equivalent Method (FEM) continuous monitor, measured hourly averages of PM10 aggregated to 24-hour average concentrations. Samples from both monitors were collected and shipped to a gravimetric laboratory twice a week.
Statistical methods
Simple descriptive statistics were used to identify patterns in PM2.5 and PM10 concentrations at the neighborhood level for Accabee, Union Heights, and Rosemont. Mean concentrations of PM were calculated and compared with reference and other neighborhood sites using a 1-way ANOVA (analysis of variance) test. All PM concentrations were graphed using Microsoft Excel, including FAA (FAA2.5) and Jenkins Street (JREF10) measurements, to illustrate differences in air pollution levels at study and reference sites. Moreover, the USEPA's National Ambient Air Quality Standards (NAAQS) for annual and 24-hour PM2.5 levels were represented on each graph to determine whether these concentrations were exceeded at the monitoring sites. 27
Results
Community engagement activities on air pollution
Through the partnership, a series of meetings were held for over a year before the sampling period to discuss community concerns about air pollution and related health outcomes. The meetings were held at community centers in partner neighborhoods. Residents expressed concerns about PM, made inquiries about local sources of PM, whether current port activities and diesel traffic were contributing to air pollution in their communities, and the diseases such as asthma and cancer that may be caused by exposure to air pollution. Although separate studies have been performed to examine perceptions of cancer risk 28 and disparities in actual cancer risk 29 in the community, Dr. Scott Reynolds (air pollution scientist with SCDHEC and member of the partnership) cautioned against linking PM levels to health outcomes and redirected the focus to whether levels exceeded the NAAQS.
Community-based air pollution monitoring plan
In accordance with CBPR principles, the partnership developed a community-based monitoring plan to measure PM2.5 and PM10 levels. The plan was based on the Quality Assurance Quality Plan developed by SCDHEC for saturation monitoring of PM in the study area. 30 LAMC leaders and research team members decided to focus on ambient air pollution monitoring in neighborhoods that would be most impacted by pollution related to the port expansion. These residential neighborhoods included Rosemont in Charleston, SC, and Union Heights and Accabee in North Charleston, SC, located in the Charleston Neck region (Fig. 1).

Map of the study area, AC, Accabee; RM, Rosemont; UH, Union Heights.
Rosemont and Union Heights communities are heavily impacted by goods movement activities, particularly diesel truck traffic along Spruill Avenue and Martin Luther King Jr Avenue. The port expansion will result in the addition of an access road and off ramp that runs through Rosemont to accommodate the increase in diesel truck traffic. 31 Although the neighborhood samplers were placed in predominately African American and low-income communities, North Charleston, SC, actually comprises more whites (∼66%) than African Americans (∼27%).
Training of community scientists
A group of 10 residents were trained to use the air monitoring equipment in Summer 2012 with three goals in mind: (1) teach residents how to use the equipment to ensure community participation throughout the data collection phase of the project, (2) increase community capacity to perform scientific research, and (3) build a pipeline of community scientists who would be available to disseminate air pollution information to other residents and stakeholders as the partnership's efforts to understand exposure and health risks associated with local air pollution increased. Two residents were selected to act as the air monitoring field coordinator during the study period. These residents followed the sampling protocol, dropped off filters to the SCDHEC office following a set schedule, and noted any equipment issues so that the SCDHEC staff could keep the monitors running on schedule.
Air monitoring results
Figures 2–4 are a series of bar graphs that capture mean 24-hour PM10 (coarse) and PM2.5 particles in Accabee, Union Heights, and Rosemont neighborhoods from July 21, 2012, to April 10, 2013. The PM2.5 measurements from our monitors were compared to daily PM2.5 samples collected by the FAA sampler and PM10 concentrations were compared with the Jenkins Street reference monitor (JREF10). The Gethsemane and Rosemont sites began monitoring air quality during the summer (July 21, 2012, and August 1, 2012, respectively), whereas the neighborhood PM measurements for the Accabee site were not collected until October 12, 2012, because of equipment calibration issues. The remaining missing data points throughout the sampling period were primarily because of an equipment malfunction or miscellaneous void at the sampling sites.

Particulate matter monitoring, Accabee (October 2012–April 2013).

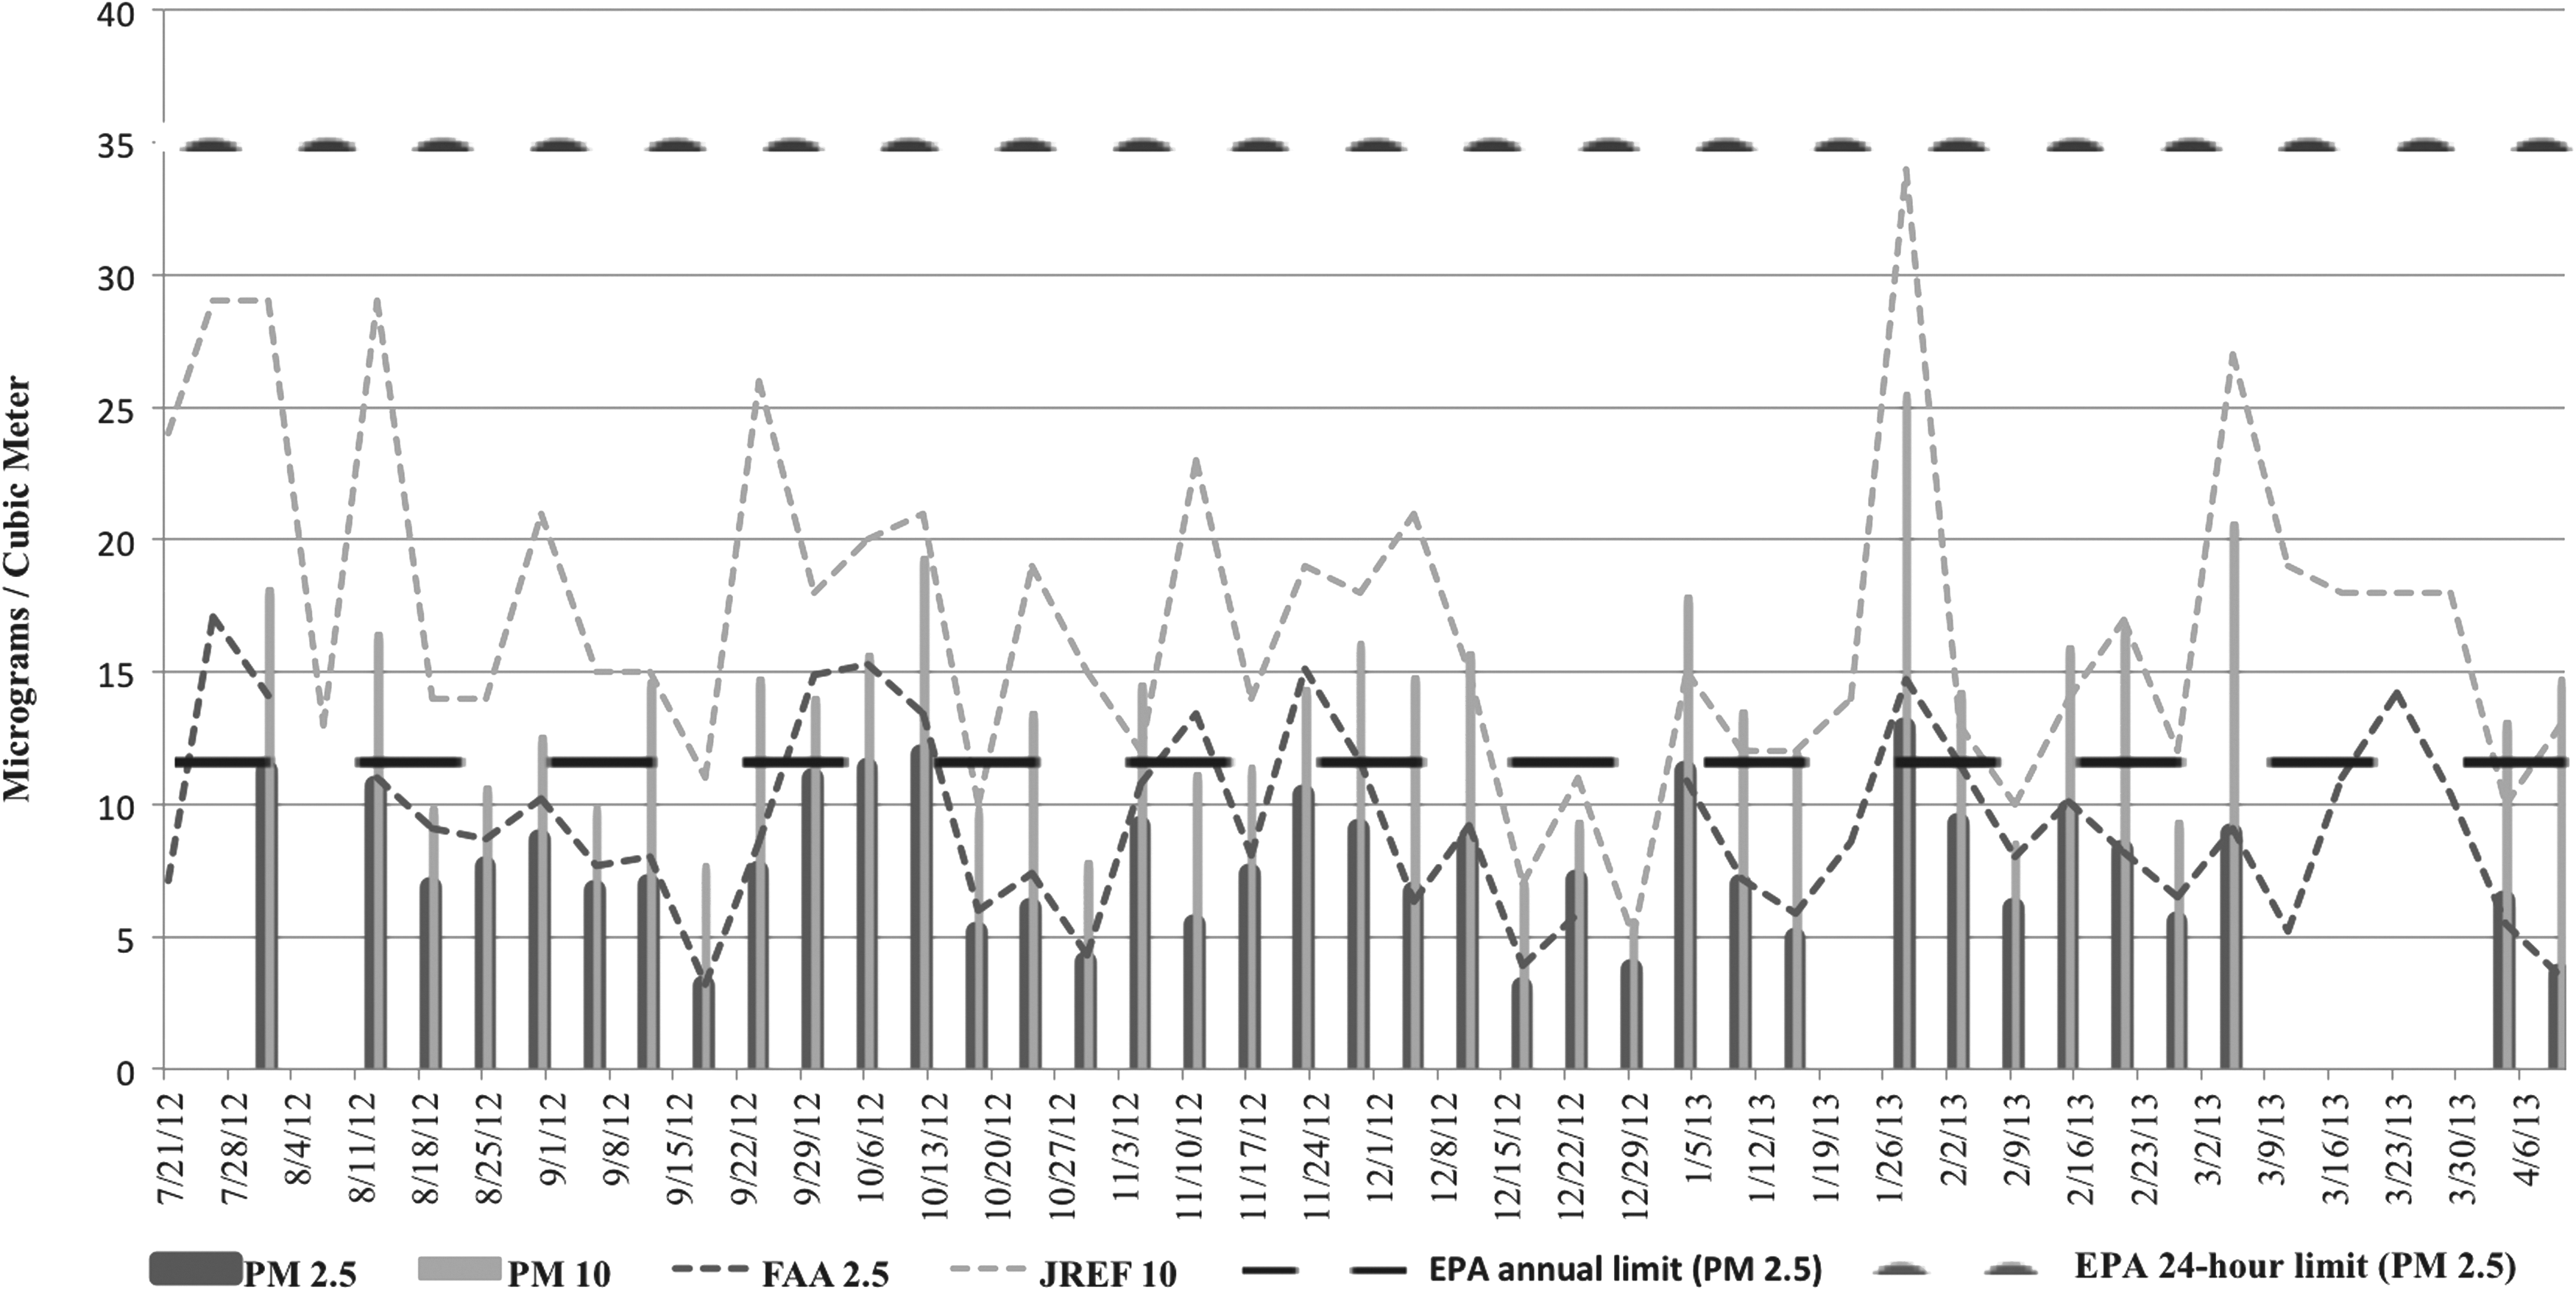
Particulate matter monitoring, Union Heights (July 2012–April 2013).
Particulate matter monitoring, Rosemont (July 2012–April 2013).
At the Accabee site, the highest mean 24-hour PM2.5 levels were collected on January 28, 2013 (12.3 μg/m3) and the lowest were observed on November 17, 2012 (0.1 μg/m3) (Fig. 2). Our findings were not synonymous with seasonal PM2.5 trends in the southeast because concentrations are typically highest during July–September and lowest during January–March. 32
Regarding PM10 levels, the highest mean 24-hour concentrations were also collected on January 28, 2013 (21.7 μg/m3), whereas the lowest were reported on December 17, 2012 (7.0 μg/m3). At the site in Union Heights, 24-hour mean PM10 and PM2.5 concentrations were collected from July 21, 2012, to April 10, 2013 (Fig. 3). The peak concentrations of PM2.5 were measured on July 26, 2012 (15.2 μg/m3) as expected, whereas the lowest concentrations were collected on April 10, 2013 (4.1 μg/m3) during the second highest season for PM2.5 levels. When compared with the FAA PM2.5 data, PM2.5 measurements collected in Union Heights were higher for roughly 17% of the observations. Peak levels of PM10 concentrations in Union Heights were documented on January 28, 2013 (27.2 μg/m3), whereas the lowest levels were recorded on April 4, 2013 (7.0 μg/m3).
Twenty-four-hour mean concentrations of PM10 and PM2.5 were collected at the Rosemont site on August 1, 2012 through April 10, 2013 (Fig. 4). The highest PM2.5 mean concentrations were reported on January 28, 2013 (12.9 μg/m3), whereas the lowest were collected on December 17, 2012 (3.1 μg/m3). Moreover, ∼17% of PM2.5 concentrations at Rosemont exceeded those collected from the FAA monitoring station. Similar to PM2.5, the highest PM10 levels were reported on January 28, 2013 (25.5 μg/m3). January 28, 2013 is a notable observation date because the peak PM2.5 and PM10 concentrations for the Accabee site were also collected on this day. In contrast, the lowest PM10 concentrations were observed on December 29, 2012 (5.4 μg/m3).
Although none of the measurements exceeded the NAAQS for PM at the monitoring sites, Union Heights had the highest overall mean 24-hour concentrations of PM2.5 (8.2 μg/m3) and PM10 (14.8 μg/m3) when compared with Accabee and Rosemont (Table 1). There was no statistically significant difference in the overall mean 24-hour concentrations of PM2.5 (p = 0.53) and PM10 (p = 0.13) across neighborhood sites. When the neighborhood sites were compared with the reference monitors that corresponded to their particle size, there were significant differences in the overall mean 24-hour averages of PM10 for Accabee (p = 0.00), Union Heights (p ≤ 0.0001), and Rosemont (p = 0.01) (Table 2). Specifically, the mean PM10 concentrations at the reference JREF10 site were higher than those at community sites. Although the FAA2.5 and JREF10 mean 24-hour PM concentrations did not follow a normal distribution, a Welch's ANOVA test demonstrated that there was no real change in the p values presented in Table 2.
PM, particulate matter; SD, standard deviation.
The two variables were analyzed together.
p < .05.
df, degrees of freedom; MS, mean square; SS, sum of squares.
Discussion
The purpose of this study was to determine baseline levels of PM2.5 and PM10 in LAMC neighborhoods before the port expansion impacted goods movement activities in the area and to compare these levels across neighborhoods with different sources of air pollution. Moreover, we compared community-level data with PM measurements collected at a reference site to assess whether PM levels were higher in neighborhoods with a high concentration of goods movement activities. Our results show marked variations in the mean 24-hour PM10 and PM2.5 levels across our study communities.
For example, the range of mean PM2.5 concentrations collected in Accabee (0.1–12.3 μg/m3; Fig. 2) and Rosemont (3.1–12.9 μg/m3; Fig. 4) were much lower than the range of mean PM2.5 concentrations measured at the Union Heights site (4.1–15.2 μg/m3; Fig. 3). The higher values obtained in Union Heights may be because of the proximity of the monitoring station to heavier traffic and the port. Although our findings demonstrated that the study communities were in compliance with the NAAQS for PM2.5, our results were still consistent with other studies in that we found higher concentrations of PM in communities located near the port. 33 As most of the mass for PM2.5 is attributable to mobile sources (54%) instead of ships (<5%), 34 the increase in truck traffic to move goods may significantly impact air quality in LAMC neighborhoods.
In the case of PM10, similar variations were observed between study communities and none of the samples exceeded the 24-hour NAAQS for PM10. Similar to the PM2.5 results, Union Heights recorded the highest range of mean PM10 concentrations (7.0–27.2 μg/m3; Fig. 3) followed by Rosemont (7.0–25.5 μg/m3; Fig. 3) and Accabee (5.4–21.7 μg/m3; Fig. 2). Although all neighborhood mean PM10 concentrations were significantly different from those of the Jenkins Street reference monitor, our results were still lower than those found in similar communities burdened by port activity. We believe that this may be because of the Port of Charleston's smaller size than other ports studied in California, New York, Texas, etc. For example, California's Long Beach Port exceeded the EPA's 24-hour PM10 NAAQS at their Superblock station (171.4 μg/m3) in 2012 as well their own California Ambient Air Quality Standard of 50 μg/m3). 35 Nevertheless, California's Long Beach Port is the busiest port in the United States, whereas the Port of Charleston ranks eighth at its current operating capacity. 36
The baseline results in this study are particularly important because the communities are already disproportionately burdened by pre-existing environmental stressors that may negatively influence health outcomes. 37 Other communities in Houston, Texas, have experienced the same environmental load, where 20% of the highest emitting industrial facilities are located by the Port of Houston and main shipping channel. 38 Furthermore, the communities differentially impacted by goods movement activities are predominately nonwhite and low-income populations. 39 Land use decisions for goods movement activities are often made at the local level and may lack community input; however, the USEPA has devised strategies to ensure that communities like Charleston can withstand changes made to the ports. 40 By conducting a baseline air pollution assessment preport expansion, the LAMC now has data to present to the ports authority that will allow us to work collaboratively to protect the health and quality of life of North Charleston communities.
Conclusion
Baseline PM2.5 and PM10 concentrations did not exceed the NAAQS during the sampling period. The short sampling period (July–April) did not allow us to collect enough data to reflect seasonal variations in PM concentrations; however, the lack of seasonal data may be less important after the port expansion because PM levels may be more influenced by increases in mobile sources of pollution or by the volume of goods shipped. As PM levels are highly impacted by traffic, another limitation in this study was not measuring traffic volume and density before the port expansion.
Lastly, our air quality monitoring plan only allowed us to document community-level exposures, which does not equate to individual exposures to PM. Nevertheless, this does not mean that PM exposures did not lead to negative health outcomes for local residents. Despite our limitations, we can still use our data to inform other goods movement studies, health and zoning intervention policies and provide additional support for implementation of the mitigation plan agreement. We will continue with our current monitoring plan and conduct a postport expansion follow-up study to determine whether air pollution concentrations have significantly increased in the area. Our future study will also examine changes in individual health status for North Charleston, SC, residents because a baseline community health assessment is already underway.
Footnotes
Acknowledgments
This study received funding from the NIEHS (1R21ES017950-01). Furthermore, we would like to thank community leaders from the LAMC, Charleston Community Research to Action Board, Dr. Scott Reynolds from the SCDHEC, and Omar Muhammad and Jamie Jordan, community scientists, for their support on this work. We would also like to thank participating members of our CAPs who made contributions to this article: University of Maryland, College Park; the USC; LAMC, Rosemont, SCDHEC, USC, and Tulane University.
Author Disclosure Statement
No competing financial interests exist.