
Abstract
Abstract
Given the previously established, social, economic, and healthful benefits of nearby nature in local environments, we argue that the provision of publicly funded street trees as a positive urban environmental exposure should be considered as an “environmental justice” issue. Accordingly, the study examines the distribution of street trees within a 10-minute walking radius around elementary schools in four communities of different sizes in Ontario, Canada, to assess potential levels of “exposure” to these positive natural features among school-age children of different sociodemographic backgrounds. A geographic information system incorporating detailed geodatabases of pubic trees and elementary schools in Stratford, Woodstock, Brantford, and London was used to analyze the spatial distribution of trees in relation to the socioeconomic characteristics of neighborhood walking zones around every elementary school. Our findings indicate that the spatial distribution of street trees in the immediate vicinity around the schools in the four southwestern Ontario cities studied closely mirrors the pattern of socioeconomic distress in those same cites. The findings point to a greater need for municipal planners, policymakers, and community-based organizations to carefully consider the socioeconomic characteristics of neighborhoods to ensure that future tree planting efforts are conducted in an equitable manner and targeted to the areas with the greatest need for the associated benefits they provide.
Introduction
U
In extreme cases such as the largely segregated society and urban landscapes of South Africa, the provision of street trees and green amenity spaces is far from equitable in distribution. 6 To accurately account for the distribution of trees as a resource and promote open frank public discussion, mapping of this resource in relation to regions, areas, and demographics of the cities being investigated must take place to assess and make visible the injustice that exists. 7 Healthy development and active participation for many citizens are prevented through the inequitable distribution of resources based on economic means. The overriding model is one of inversely proportionate distribution with those with the greatest need getting the least. 8 Although it can be argued that an individual has the choice to live in whatever environment he or she chooses, children are not afforded this luxury.
The current cultural construct of childhood limits the children's control over and exposure to environmental exposures, be they positive or negative, which serves to heighten their already heightened levels of susceptibility to environmental exposures presented by their developing physiology. 9 Maantay asserts that rather than race itself being a heightening risk factor for minority groups, it is racial context that must be considered in this capacity, the same consideration may apply to children. 10 In Mahaffey's study of nutrient and lead exposure from 1995, it was shown that the effects of lead exposure are born disproportionately by minority children for a number of reasons. 11 Among those was the recognition that poor nutrition, specifically, deficiencies in iron and calcium heightened the susceptibility of this largely low-income, minority study group. In addition to a dietary predisposition, the necessity of living in areas with lower cost housing, characterized by an inner-city location and older housing stock, has significantly contributed to the lead exposure that the study group was victim of. 12
Although investigations of environmental justice (EJ) have traditionally focused on negative exposures to toxic elements posing threats to human health, recent focus has turned to the consideration of exposure to beneficial environmental exposures. 13 In many cities, such as Los Angeles, children's access to green environments is markedly inequitable, with children from low-income families and children of color having little access to public parks or green school environments nor do they have access to transit opportunities to get there. These children show disproportionate rates of obesity, diabetes, and inactivity-related illnesses. 14
Streets are a traditional area of recreation and community gathering in many low-income and minority neighborhoods. This, therefore, suggests that the provision of well-treed streets would offer a significant opportunity for greater natural exposure for the groups who need it the most. 15 Many cities, including the four in this research, have recognized the value of street trees and have embarked upon efforts to assess the current state of their urban forests and improve the quality of that resource. Among the more important benefits offered by urban forests is the positive influence that they have upon the school success of children. 16 , 17 , 18 Taylor et al's. study from 2001 of children with attention deficit disorder found that exposure to natural environments lessened the severity of a child's attentional symptoms. Some parents have found it beneficial to briefly expose their children to nature each morning, before sending them to school as a means of improving their child's performance in the classroom. 19
In a study exploring the impact of moving from a poor quality natural environment to a more natural one, Wells found that was a “profound effect on children's cognitive functioning.” 20 The experience of natural environments would seem to be an even more important consideration for elementary school children as they are required to sustain prolonged effortful attention. They learn in an environment that is often full of distractions while being equipped with less control than an adult would typically have given their yet to fully develop attentional capabilities. 21 , 22 , 23 Children growing up in areas of high socio-economic distress are likely in the greatest need of school environments that support stress reduction and healthy attention function, given the likelihood that they experience stress as part of their daily home life. 24 , 25 , 26 , 27 , 28
In this study, we assess the equitable distribution of street trees in the walk to school zones surrounding elementary schools in four different sized Canadian cities in the region of southwestern Ontario. The region is home to 1.5 million people, 385,325 of which are children, who are the focus of this investigation. In the study we wish to answer the following overriding question:
Is the distribution of the positive environmental exposure provided by publicly owned street trees in the walk zones around elementary schools equitable in relation to neighborhood socioeconomic status?
Materials and Methods
A geographic information system incorporating detailed geodatabases of pubic trees and elementary schools in Stratford, Woodstock, Brantford, and London was used to analyze the spatial distribution of trees in relation to the socioeconomic characteristics of neighborhood walking zones around every elementary school. These four cities provide a cross section of the region of southwestern Ontario. The database in this research was constructed using several data sources, including census data from Statistics Canada to provide a measure of socioeconomic status and tree inventory data gathered through field survey in each of the four cities studied to provide a measure of forest cover. These data are described in greater detail hereunder.
Geographic Context
London, commonly known as The Forest City, is the largest city in Middlesex County and the regional center of southwestern Ontario with a population of 350,206. London's economy is based on healthcare, education, and research, and the median household income is $53,684.
Brantford, the major city in Brant County, has a population of 93,650. Brantford has the highest median household income in the subject group at $59,665 and is an important manufacturing center in the region.
Woodstock, the largest city in Oxford County with a population of 33,725, also has manufacturing as the basis of its economy.
The smallest city in the study is Stratford, the major center in Perth County, and has a population of 29,513 and an arts-based economy. Home of the internationally renowned Shakespeare Festival, Stratford has a median household income of $54,128. The region of southwestern Ontario overall is home to 385,325 children who are the focus of this study.
Elementary schools and respective walk zones
Elementary schools for each of the studied cities were identified and located using a variety of sources: school board websites, air photos, interactive online maps, and telephone directories. To create the GIS used in this study that aggregated data from both school boards, it was necessary to identity and locate each elementary school in the four subject cities (London n = 98, Brantford n = 36, Woodstock n = 16, and Stratford n = 12). The data gathered were geocoded within GIS (ArcGIS 9.2, ESRI) using the address locator function and edited manually to ensure high precision through locating the point to the center of each specific school building with aid of high-resolution aerial photographs.
The common threshold distance from elementary schools beyond which school boards in the region provide busing for students is 1600 m or 1.6 km; therefore, the area inside that area is the walk to school zone (walk zone). 29 Upon identification and location of each school, service areas based on the standard 1.6 km walk zone surrounding each school had to be created. Road data and the tree data were clipped within ArcMap to each of the respective school zones. Studies of children's walk to school behavior indicate that children living in proximity to their school are more likely to walk to school; therefore, the 1.6 km walk zone was subdivided into 800 m increments. At the 800 m school walk zone level, each zone is largely spatially distinct with little overlap between zones. This distance is one that children would have a good likelihood of walking to school as opposed to being driven to school by a parent and represents an exposure to nature of ∼10 minutes.
The street trees were then clipped to these 800 m zones for more detailed study. Based on these walk zones, a standardized street tree density per kilometer measure for each of the street segments was calculated by dividing the total number of street trees within each zone by the total length of roads contained in each zone.
Tree inventory data
Each of the four cities in the study had undertaken a comprehensive tree inventory using GIS-enabled tablet computers to capture and catalog the location, species, condition, and diameter at breast height for all trees located within 20 m of the center line of each street. These existing data were gathered in each city between 2002 and 2006. Using the aforementioned school zone divisions, the tree data were clipped to each zone and street tree densities based on a 1000-m segment length were calculated to generate an average street tree density for each school zone road network area.
Index of socioeconomic distress
A composite index of “socioeconomic distress” was created using census data for each of the four subject cities from the 2006 Canada Census utilizing indicators or descriptors such as “disadvantage,” “deprivation,” or “distress.” Just as well-being is an aggregate of economic and social factors that together combine to produce physical and psychological health, socioeconomic distress is also a multifaceted composite. 30 Consistent with previous Canadian EJ studies, the variables chosen to create the composite index were low educational attainment (proportion of individuals who have not graduated from high school), lone parenthood incidence (proportion of lone parent families versus the total number of families), unemployment rate (unemployment rate), and low-income prevalence (proportion of households that fall below the low-income cutoff according to Statistics Canada). The data were gathered at the dissemination area level, which is the finest grain information available. 31 , 32
These variables were weighted by population as well as by the area each dissemination area occupies within the 800 m school zone areas. The weighted data were then used to create z-scores based on the mean and standard deviation of the indicators for each city. Based on the z-score, values were assigned to each school zone, which was created through adding the values for each of the census variable z-scores to create the composite neighborhood distress index (Fig. 1). The z-scores were then divided into quintile groups represented in low to high divisions for ease of mapping. Greater composite scores correspond to higher levels of socioeconomic distress (indicated with the darker tone in the mapping) and lower composite scores represent lesser levels of distress (as indicated with the lighter tone in the mapping).
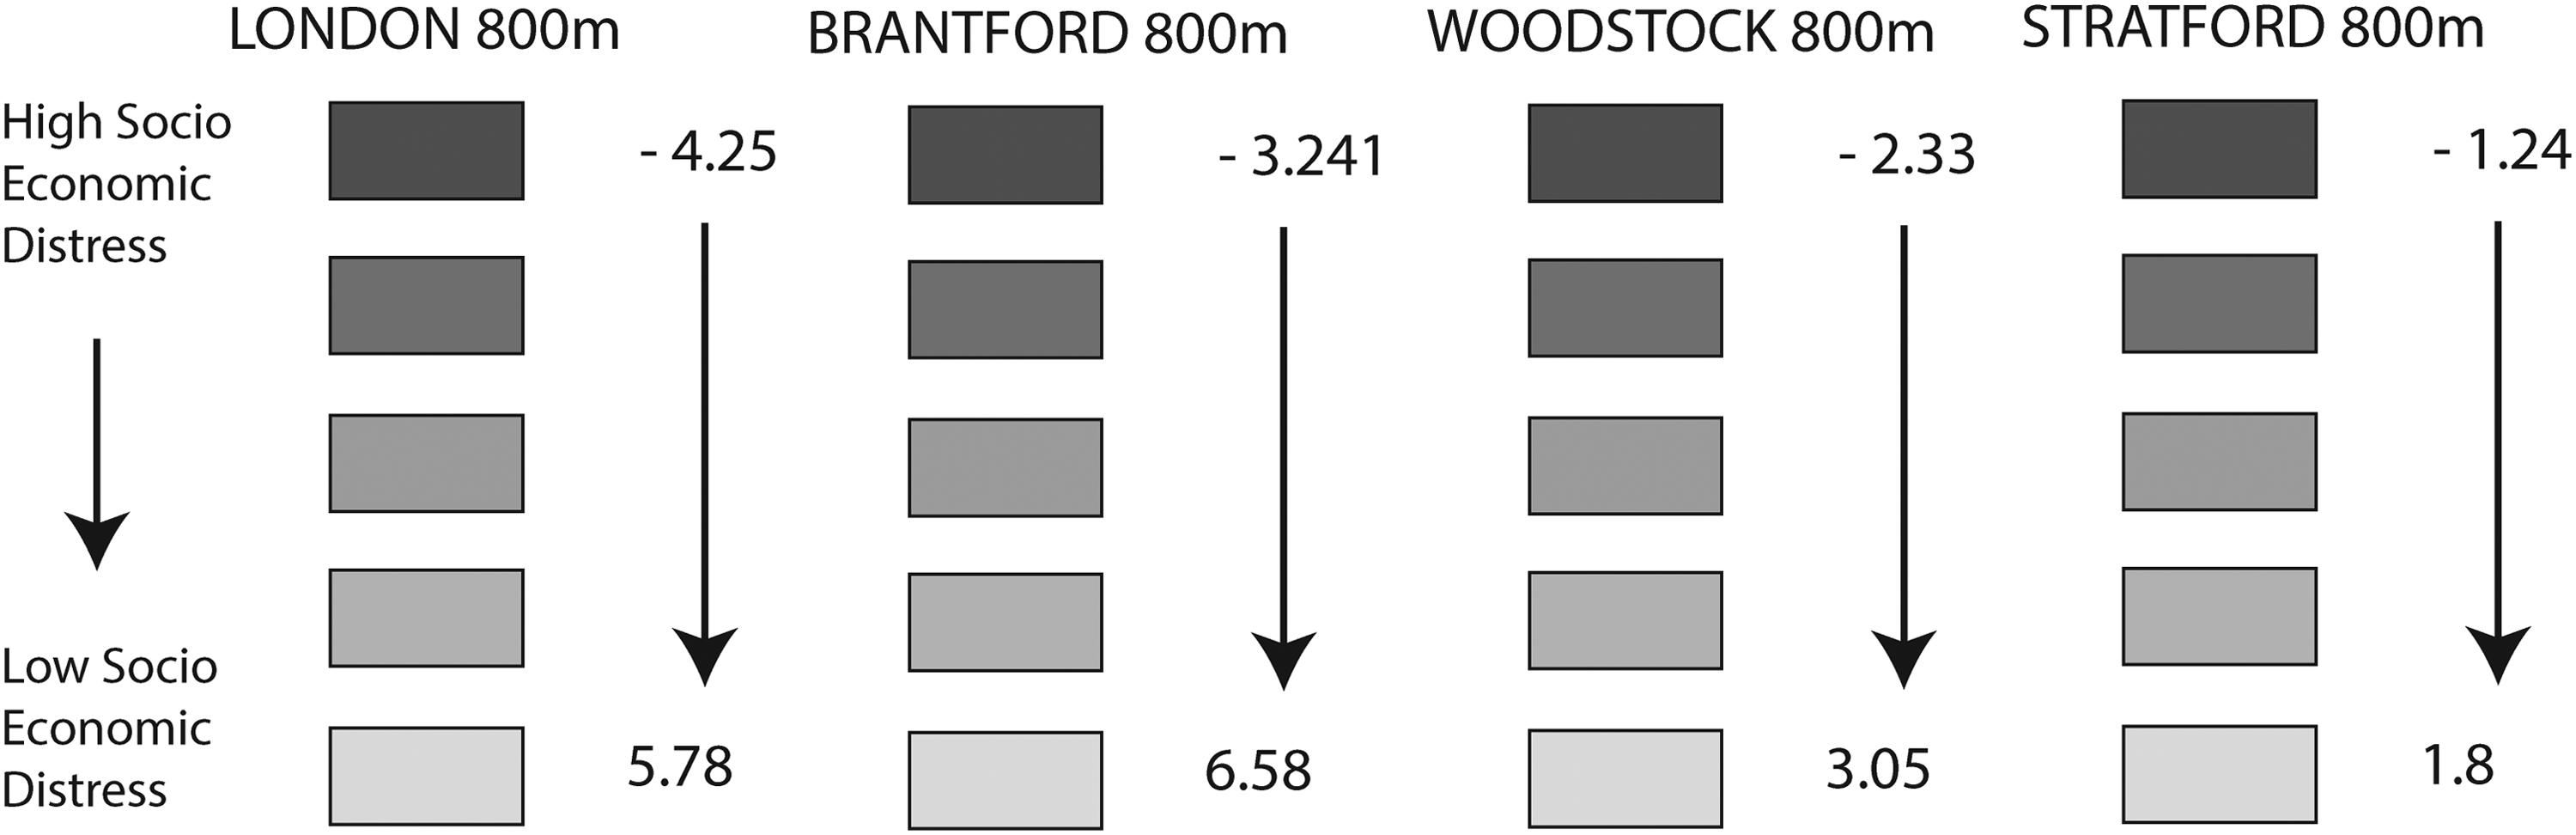
SEDI ranges for each study city from high to low distress. SEDI, socioeconomic distress index.
Results
Inequity in the provision of street trees in the walk zones surrounding elementary schools in four different southwestern Ontario cities: London, Brantford, Woodstock, and Stratford, was explored relative to factors of socioeconomic distress. When comparing the street tree densities across the four subject cities, descriptive statistics suggest that there is a considerable variation in the medians between London and the other three small cities investigated (Table 1). All four cities show statistically significant correlations between higher levels of socioeconomic distress and street tree density per 1000 m at the 800-m buffer level (Table 2).
SD, standard deviation.
Correlation is significant at the 0.01 level (two-tailed).
Correlation is significant at the 0.05 level (two-tailed).
Pearson's correlation coefficient (Pearson's R) was used to test the correlations between street tree density and the socioeconomic distress index (SEDI), as well the individual census variables of prevalence of lone parenthood, low-income prevalence, unemployment rate, and low educational attainment.
London
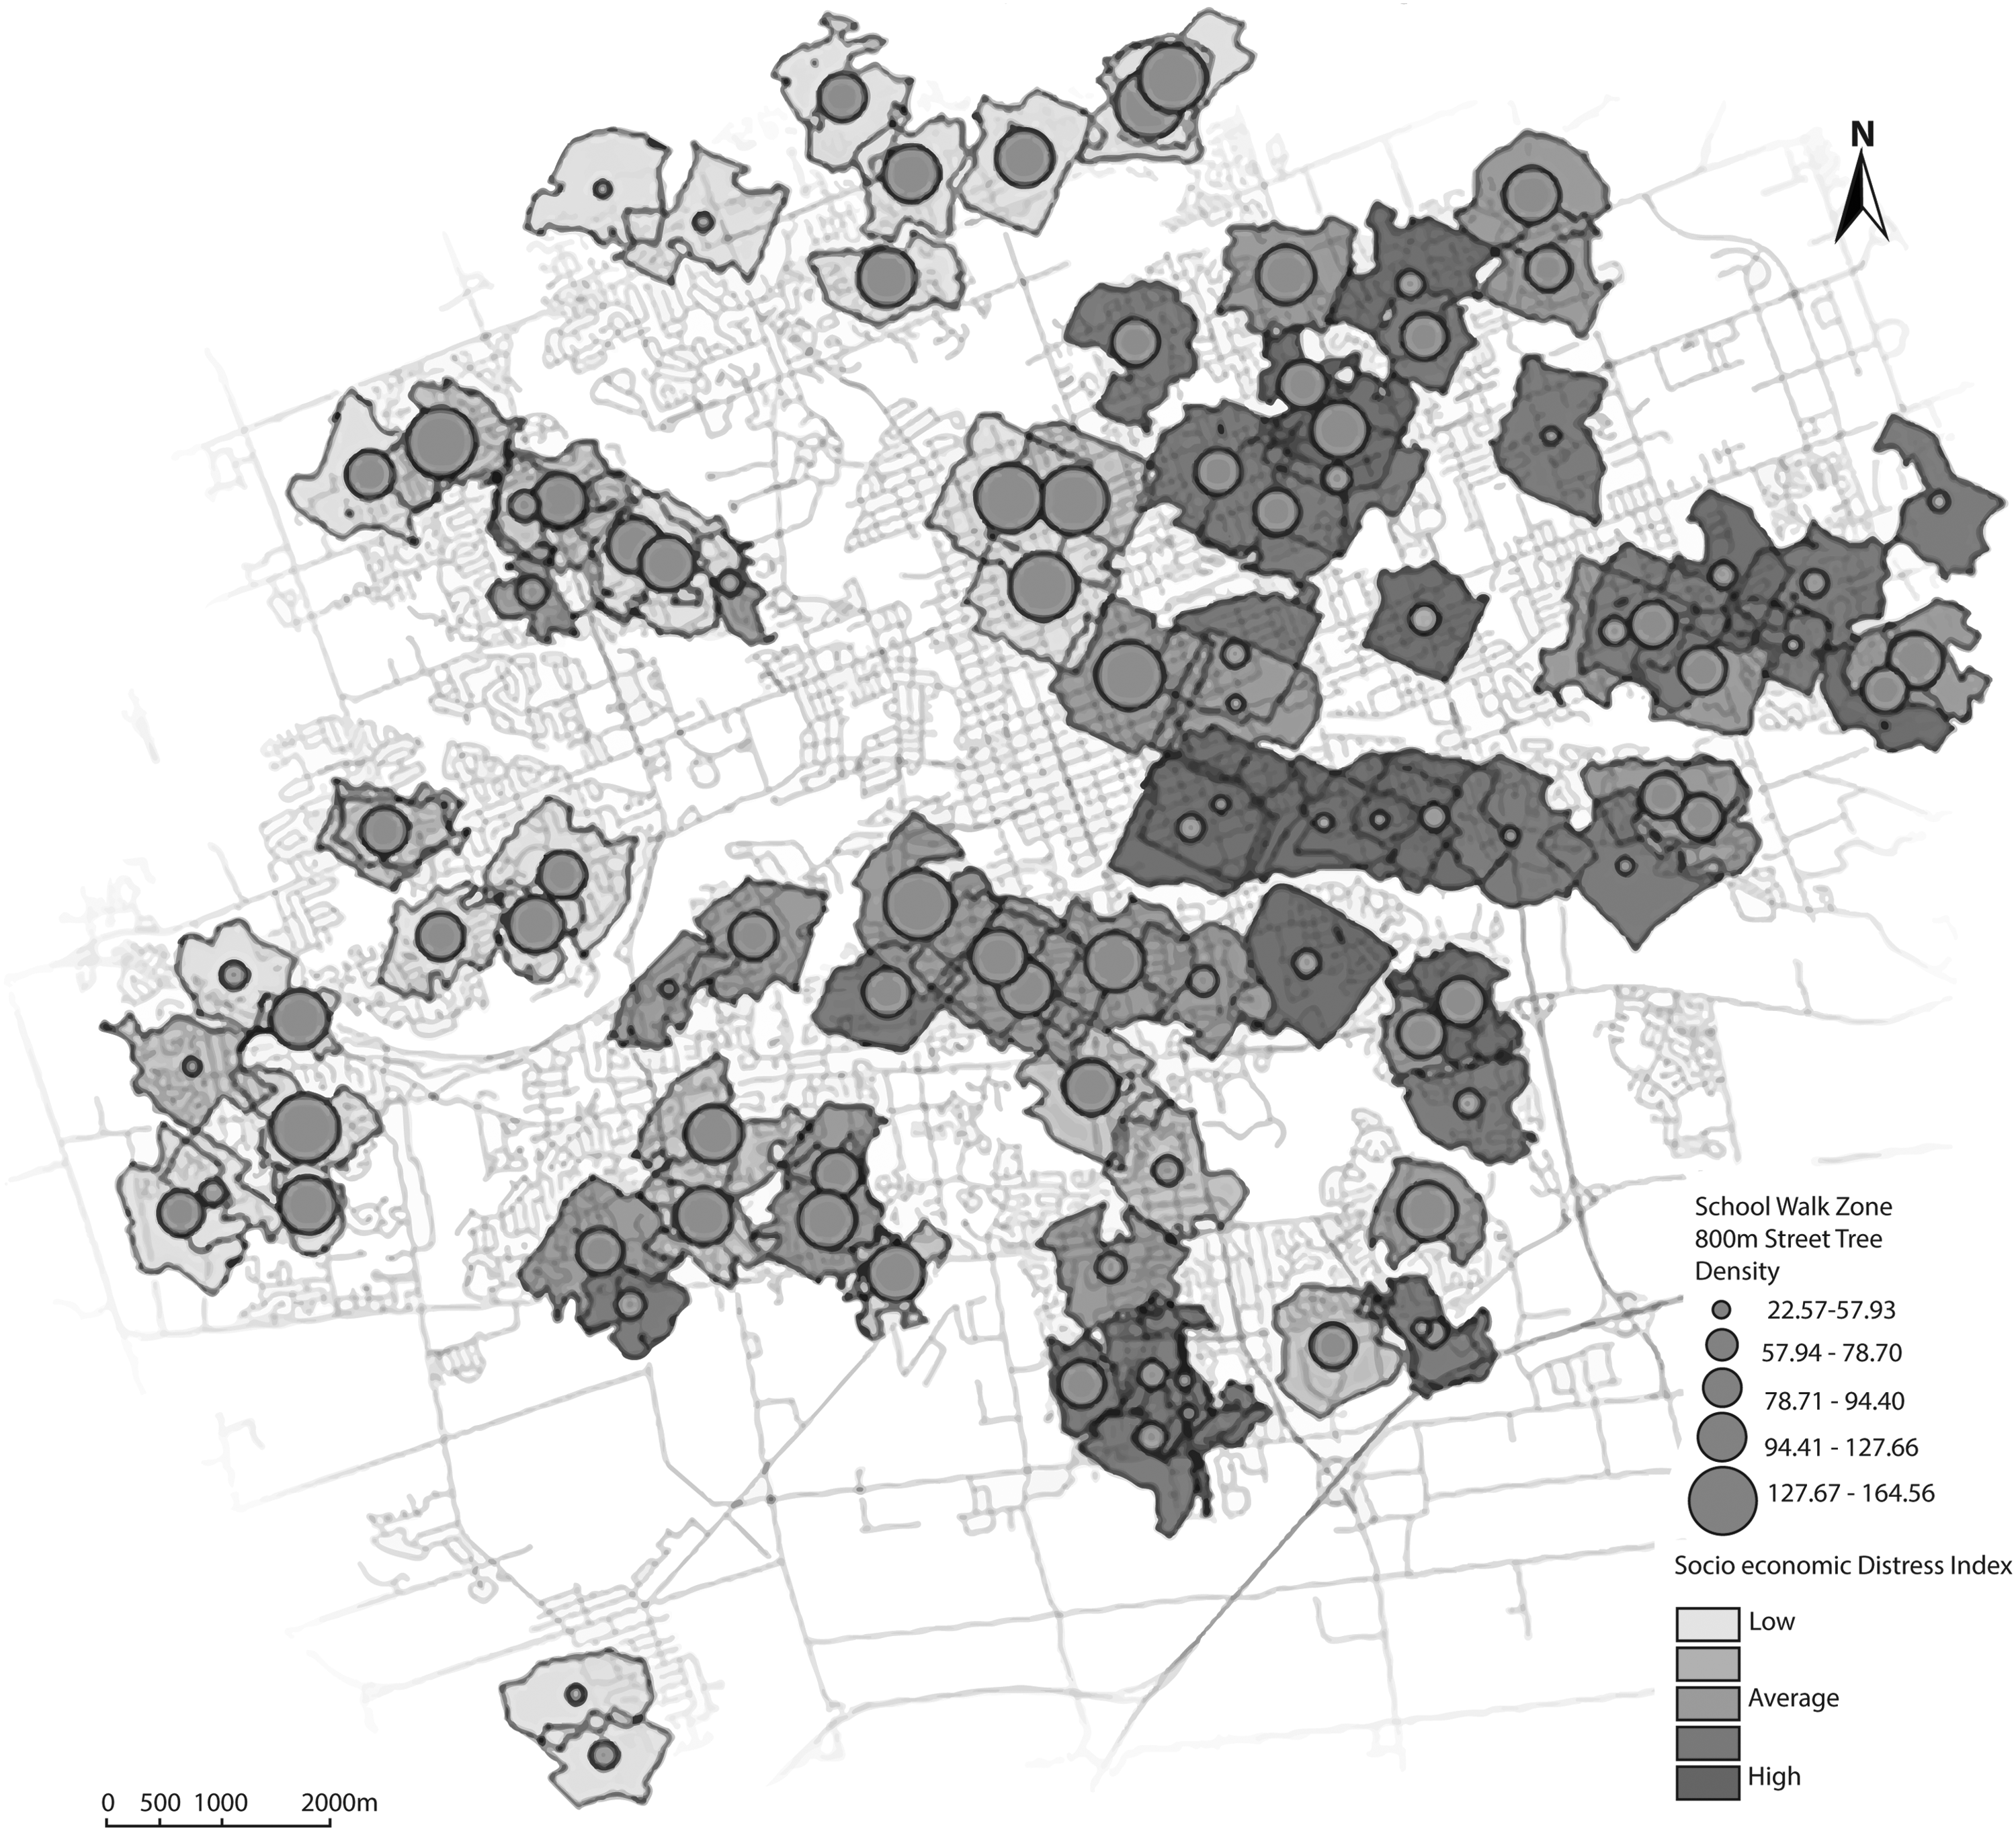
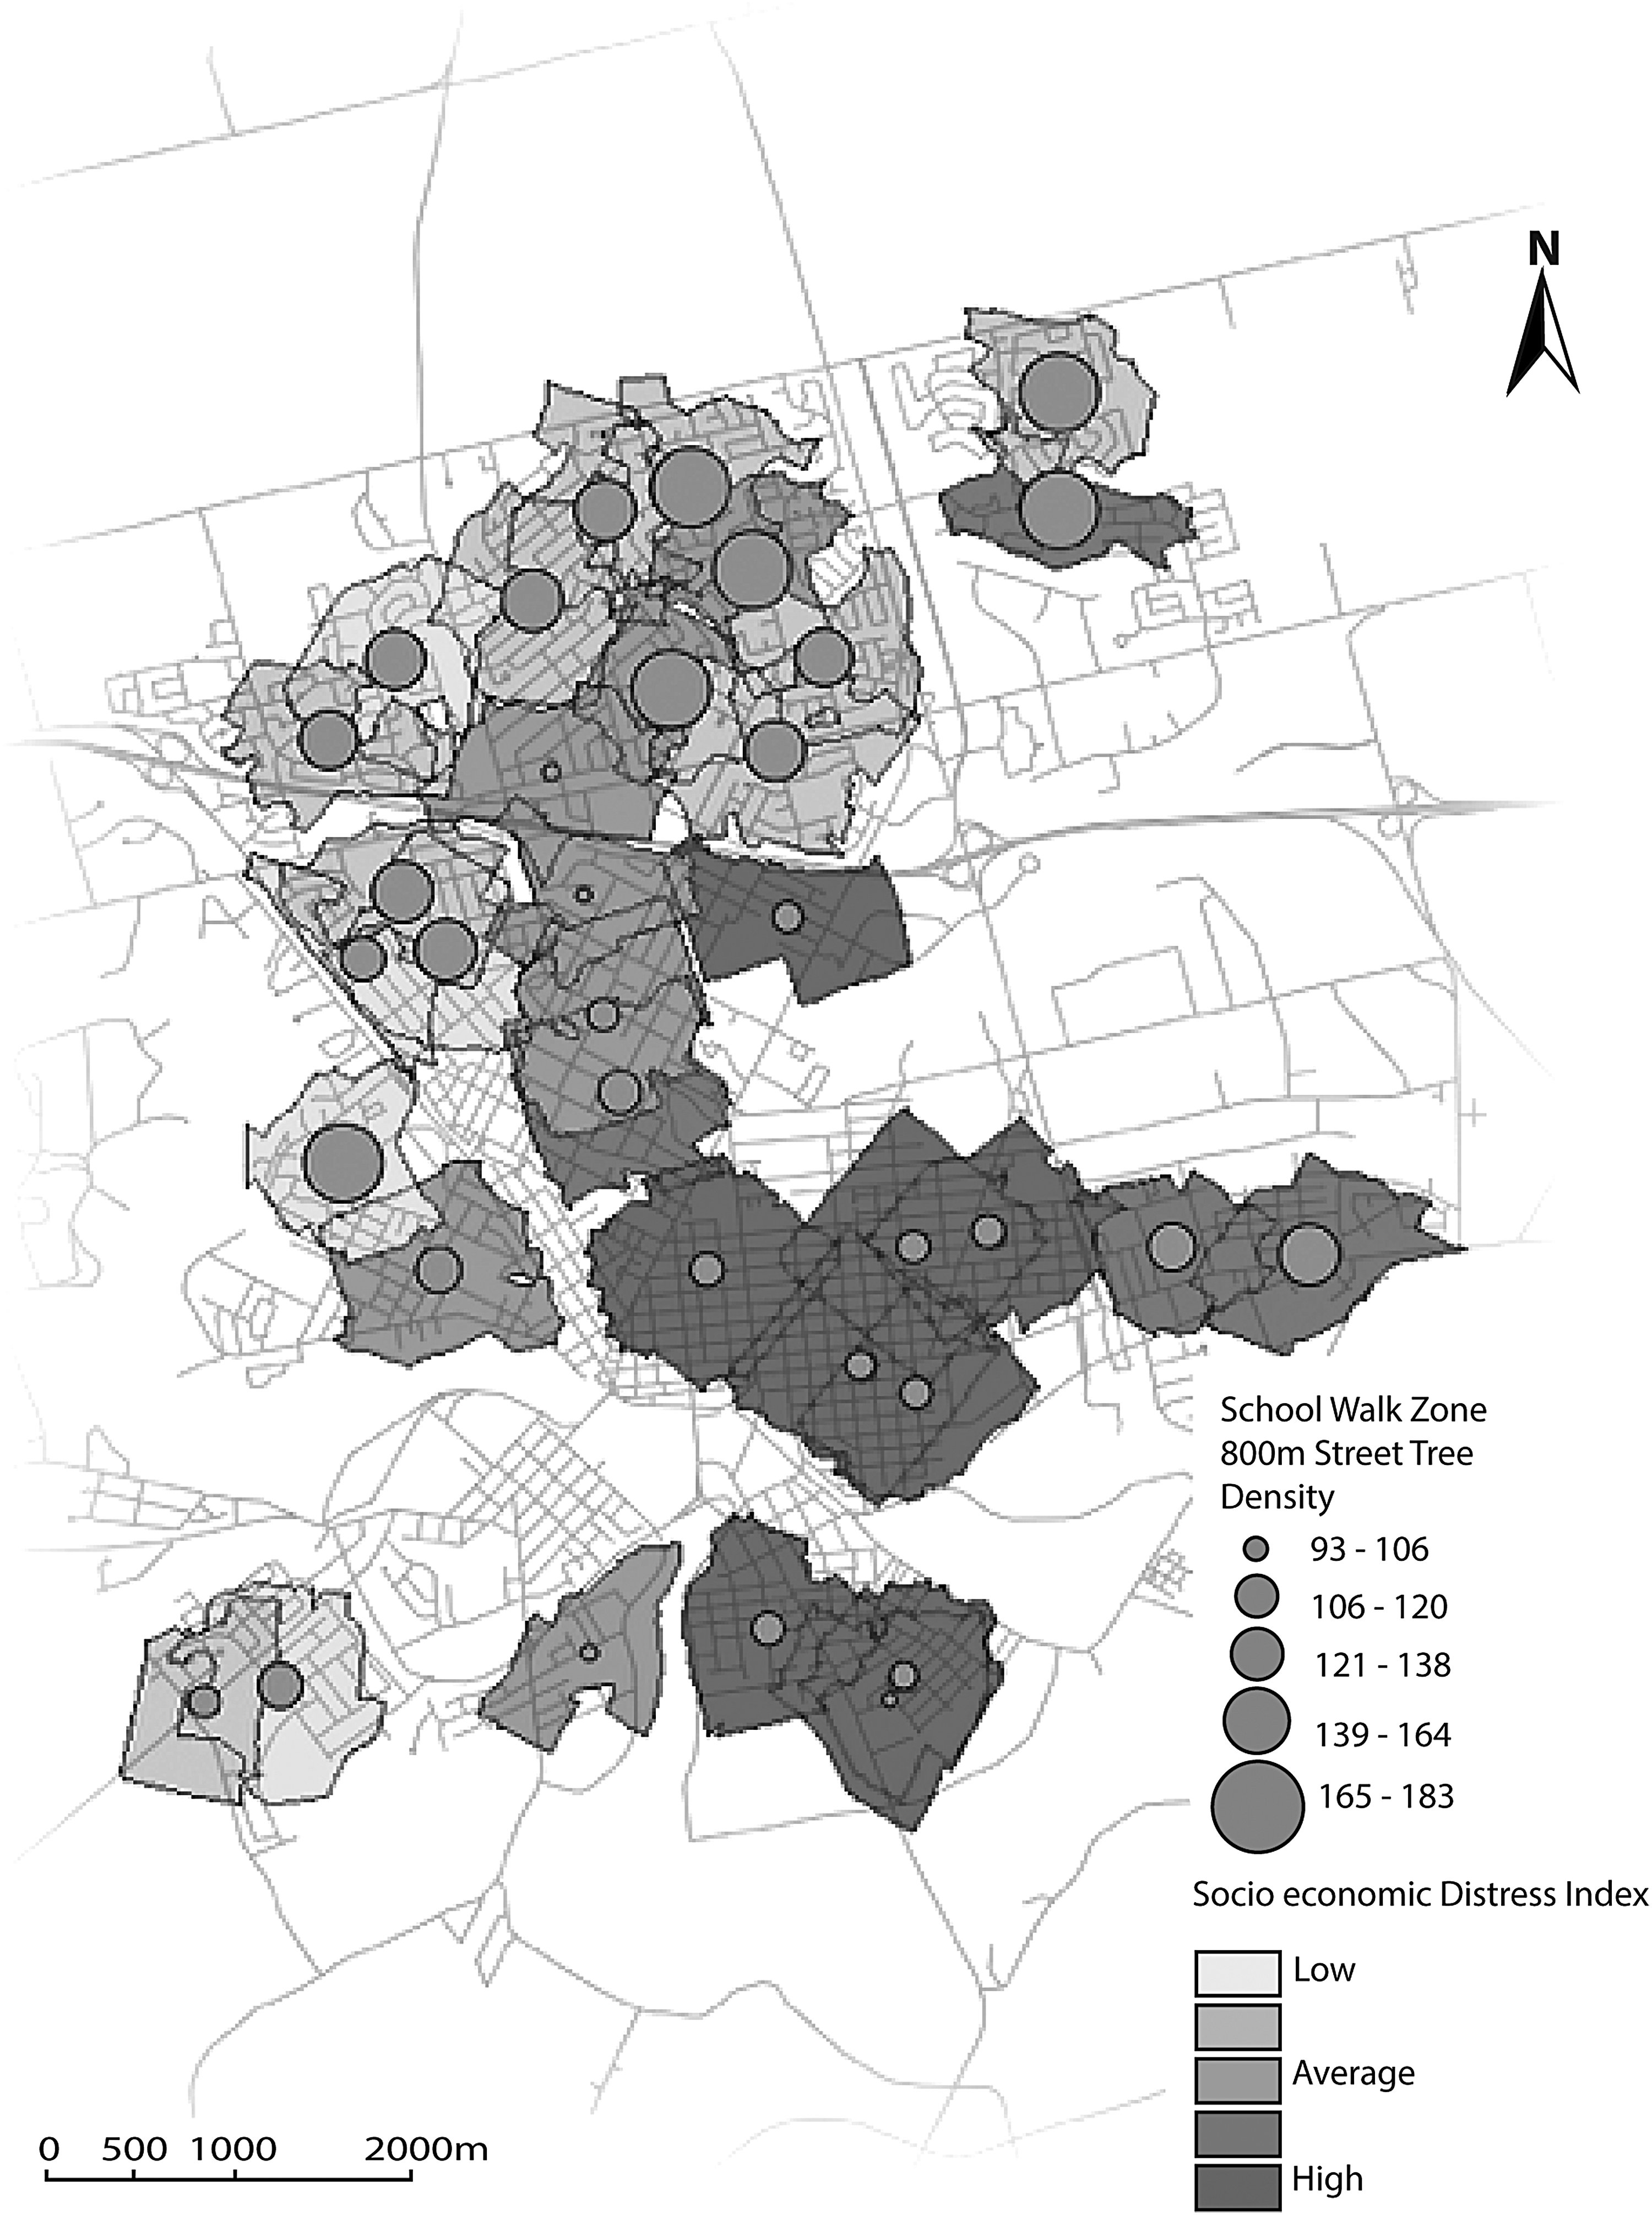
The city of London, the largest city in the study, showed the most diverse relationships. Street tree densities in the London 800-m school walk zones ranged from 22 trees per 1000 m to 165 trees per 1000 m. The correlation between the SEDI and street tree density was p = −0.424 and a clear trend is revealed wherein street tree density increases as SEDI decreases (Fig. 2). Mapping the data reveals a pattern wherein the areas with the poorest street tree density are also those with the greatest socioeconomic distress and they are spatially distributed on the east side of the city (Fig. 3).
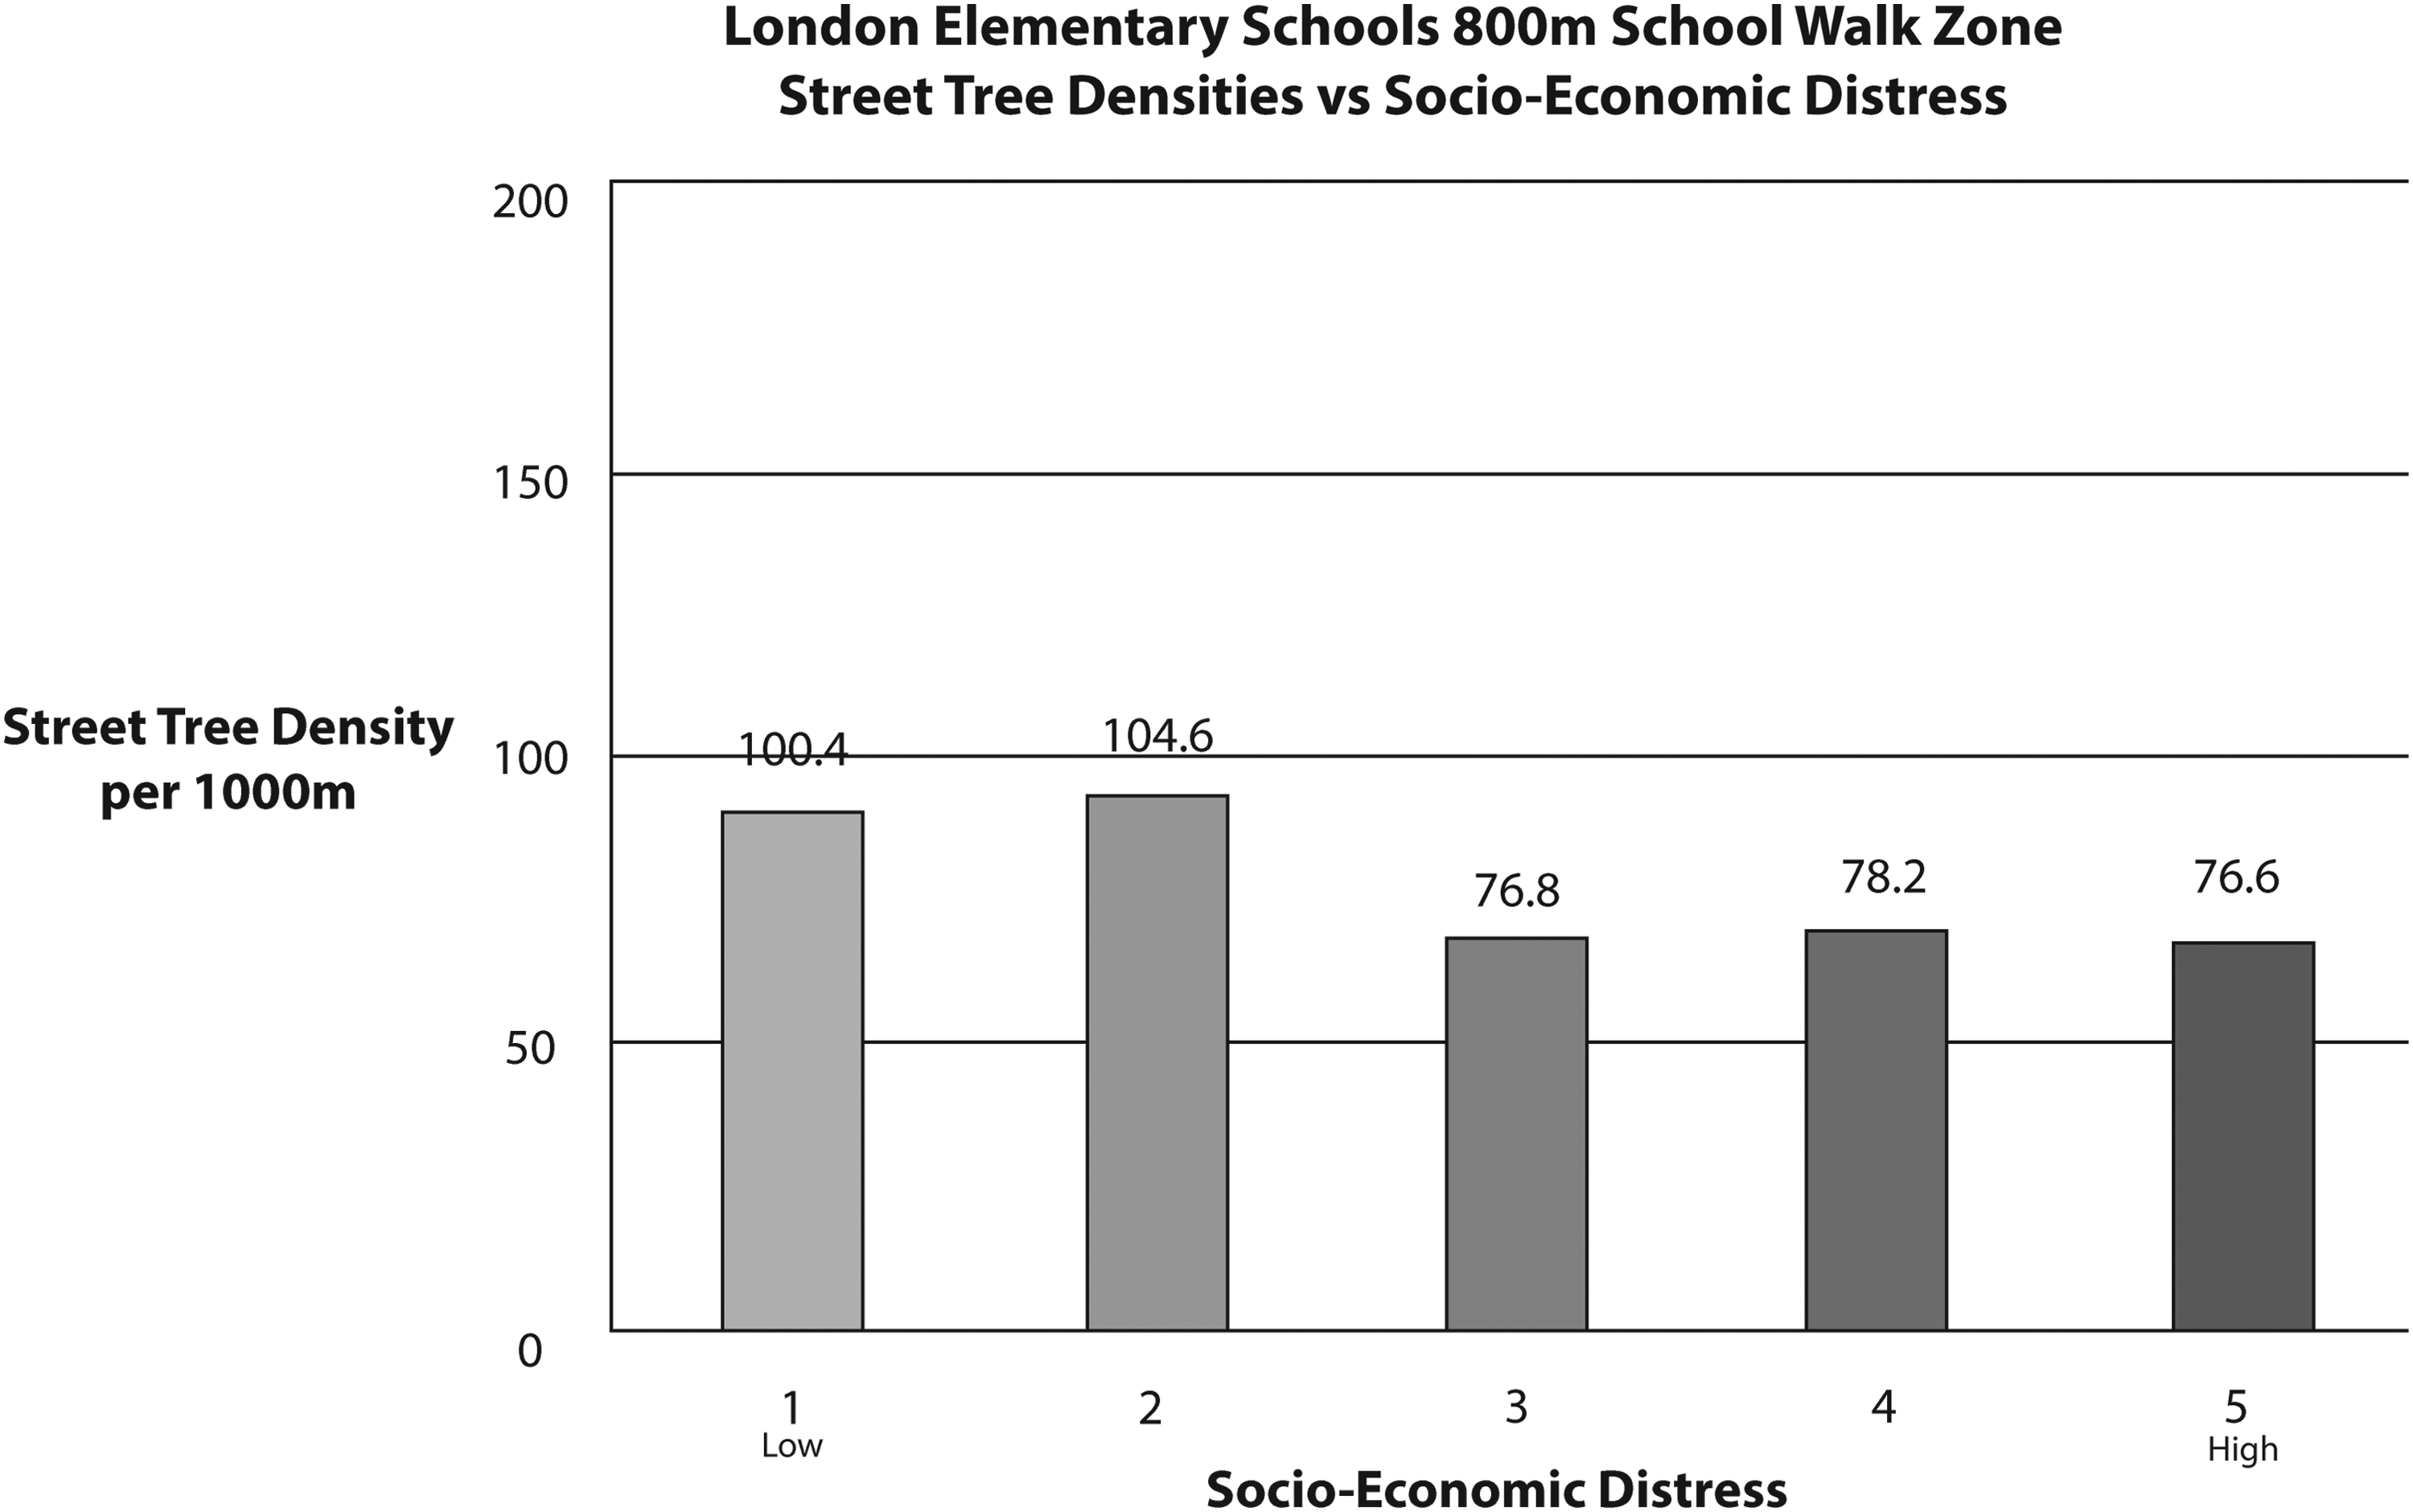
London street tree density versus SEDI at 800 m.
London street tree density at 800 m versus SEDI.
Brantford
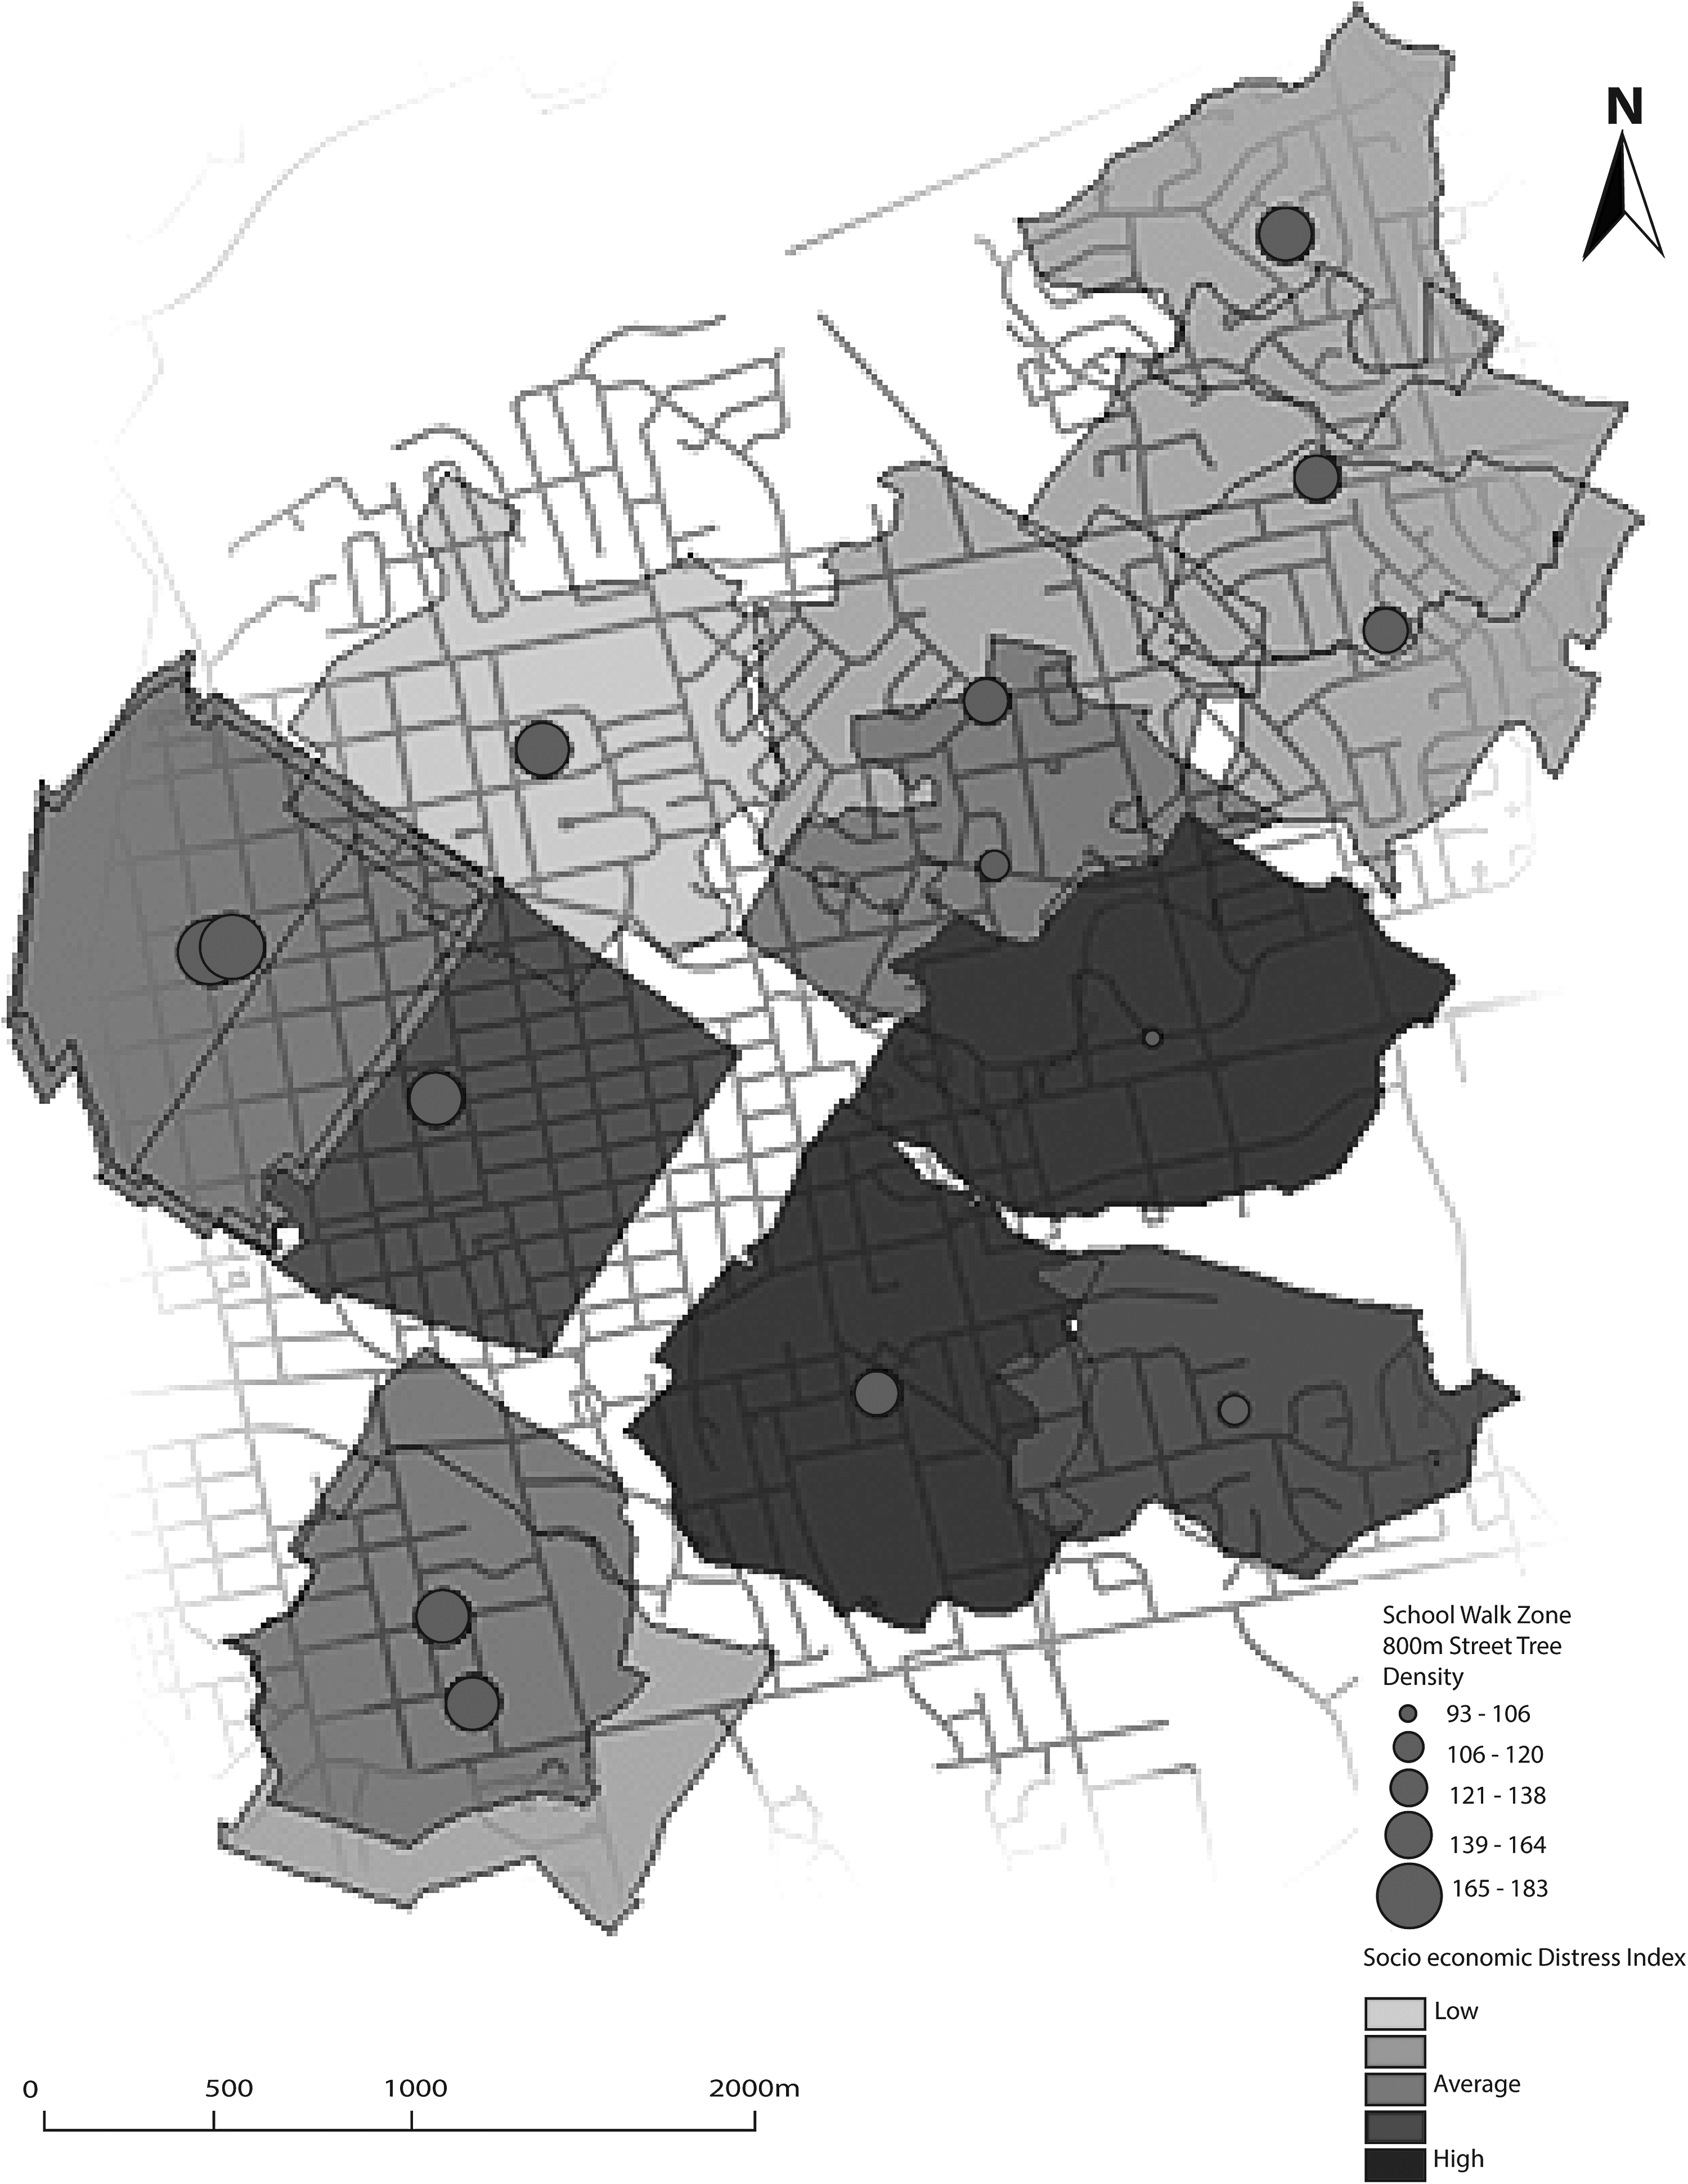
Brantford, the second largest study city, has much less variation in street tree density. The range from low density to high density in Brantford is 94 street trees per 1000 m to 185 street trees per 1000 m. Charting the data suggests an inverse relationship wherein street tree density decreases as socioeconomic distress increases (Fig. 4). The correlation between the SEDI and street tree density was p = −0.559. This is indicative of a street tree density in relation to SEDI relationship, wherein the spatial distribution in the areas with the greatest street tree density is in the northwest, with the less dense areas in the southeast portion of the city (Fig. 5).
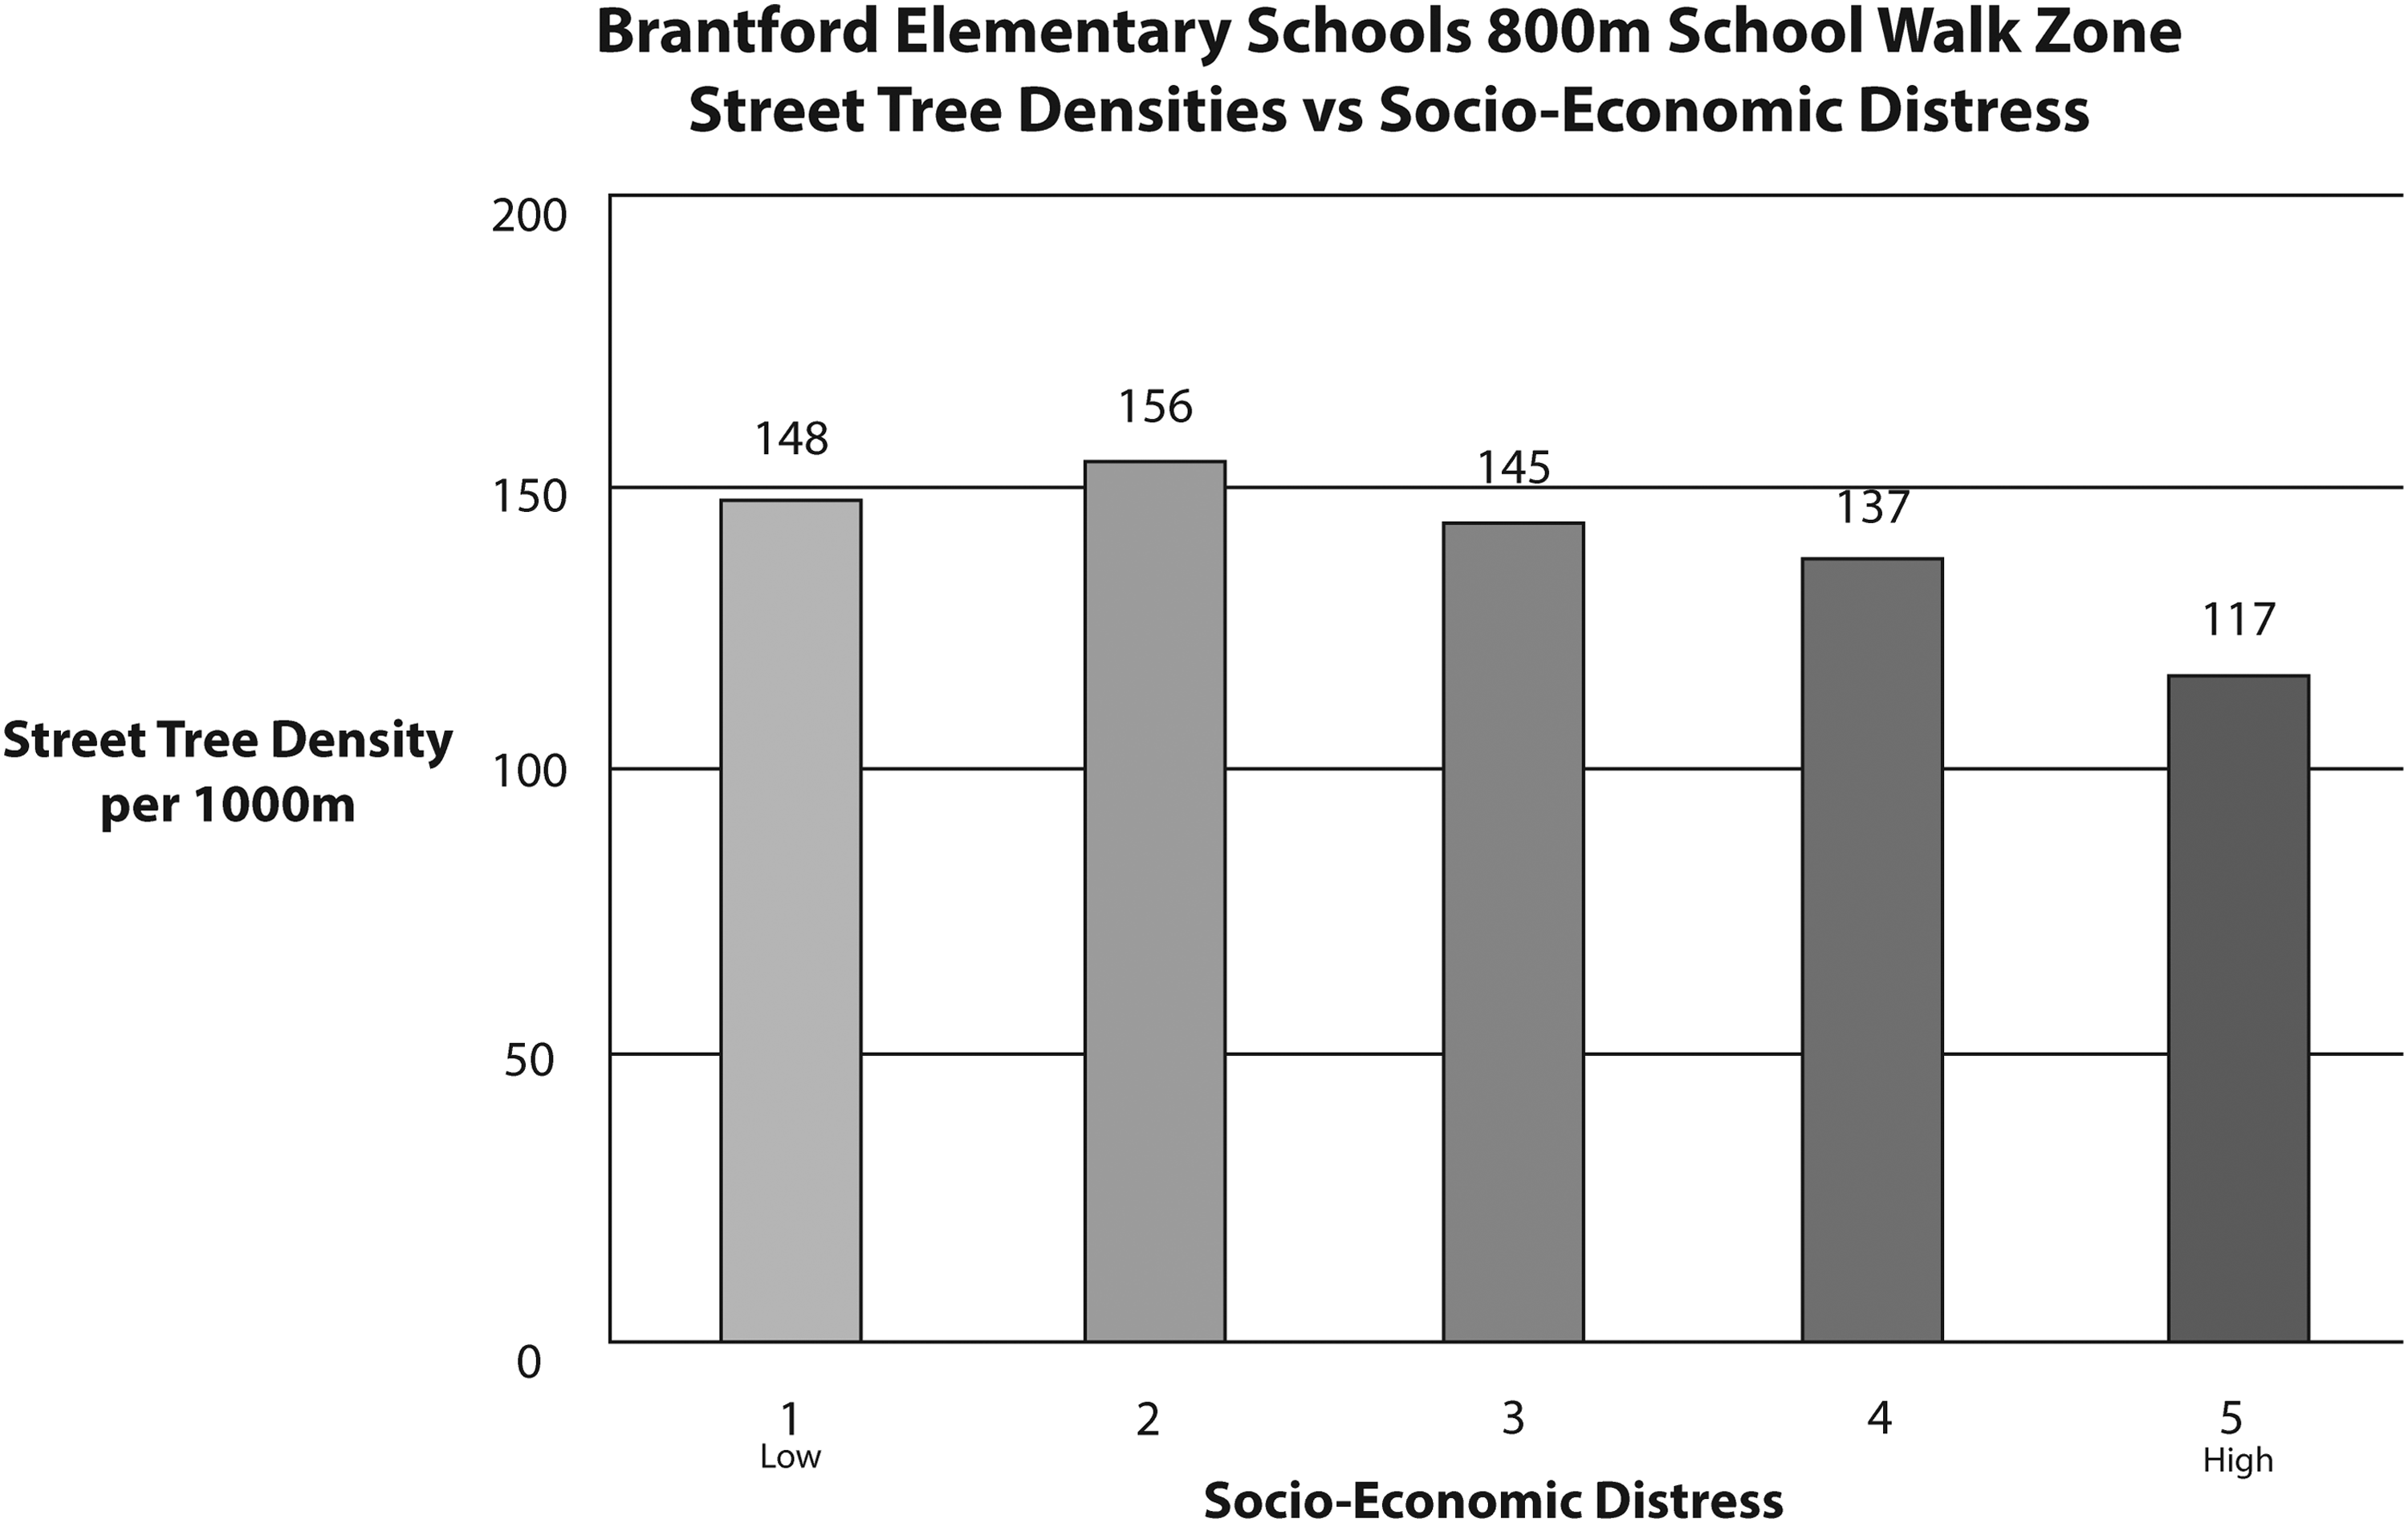
Brantford street tree density versus SEDI at 800 m.
Brantford street tree density at 800 m versus SEDI.
Woodstock
The second smallest city in the study, Woodstock, proved to be relatively homogeneous in comparison with the other three study cities in levels of socioeconomic distress. Although still exhibiting a spatial distribution with the lowest SEDI and highest street tree density in the northwest (Fig. 6), the overall variation between areas was relatively low. Despite what appears to be a relationship of overall homogeneity, the correlation between street tree density and SEDI was p = −0.553 (Fig. 7).
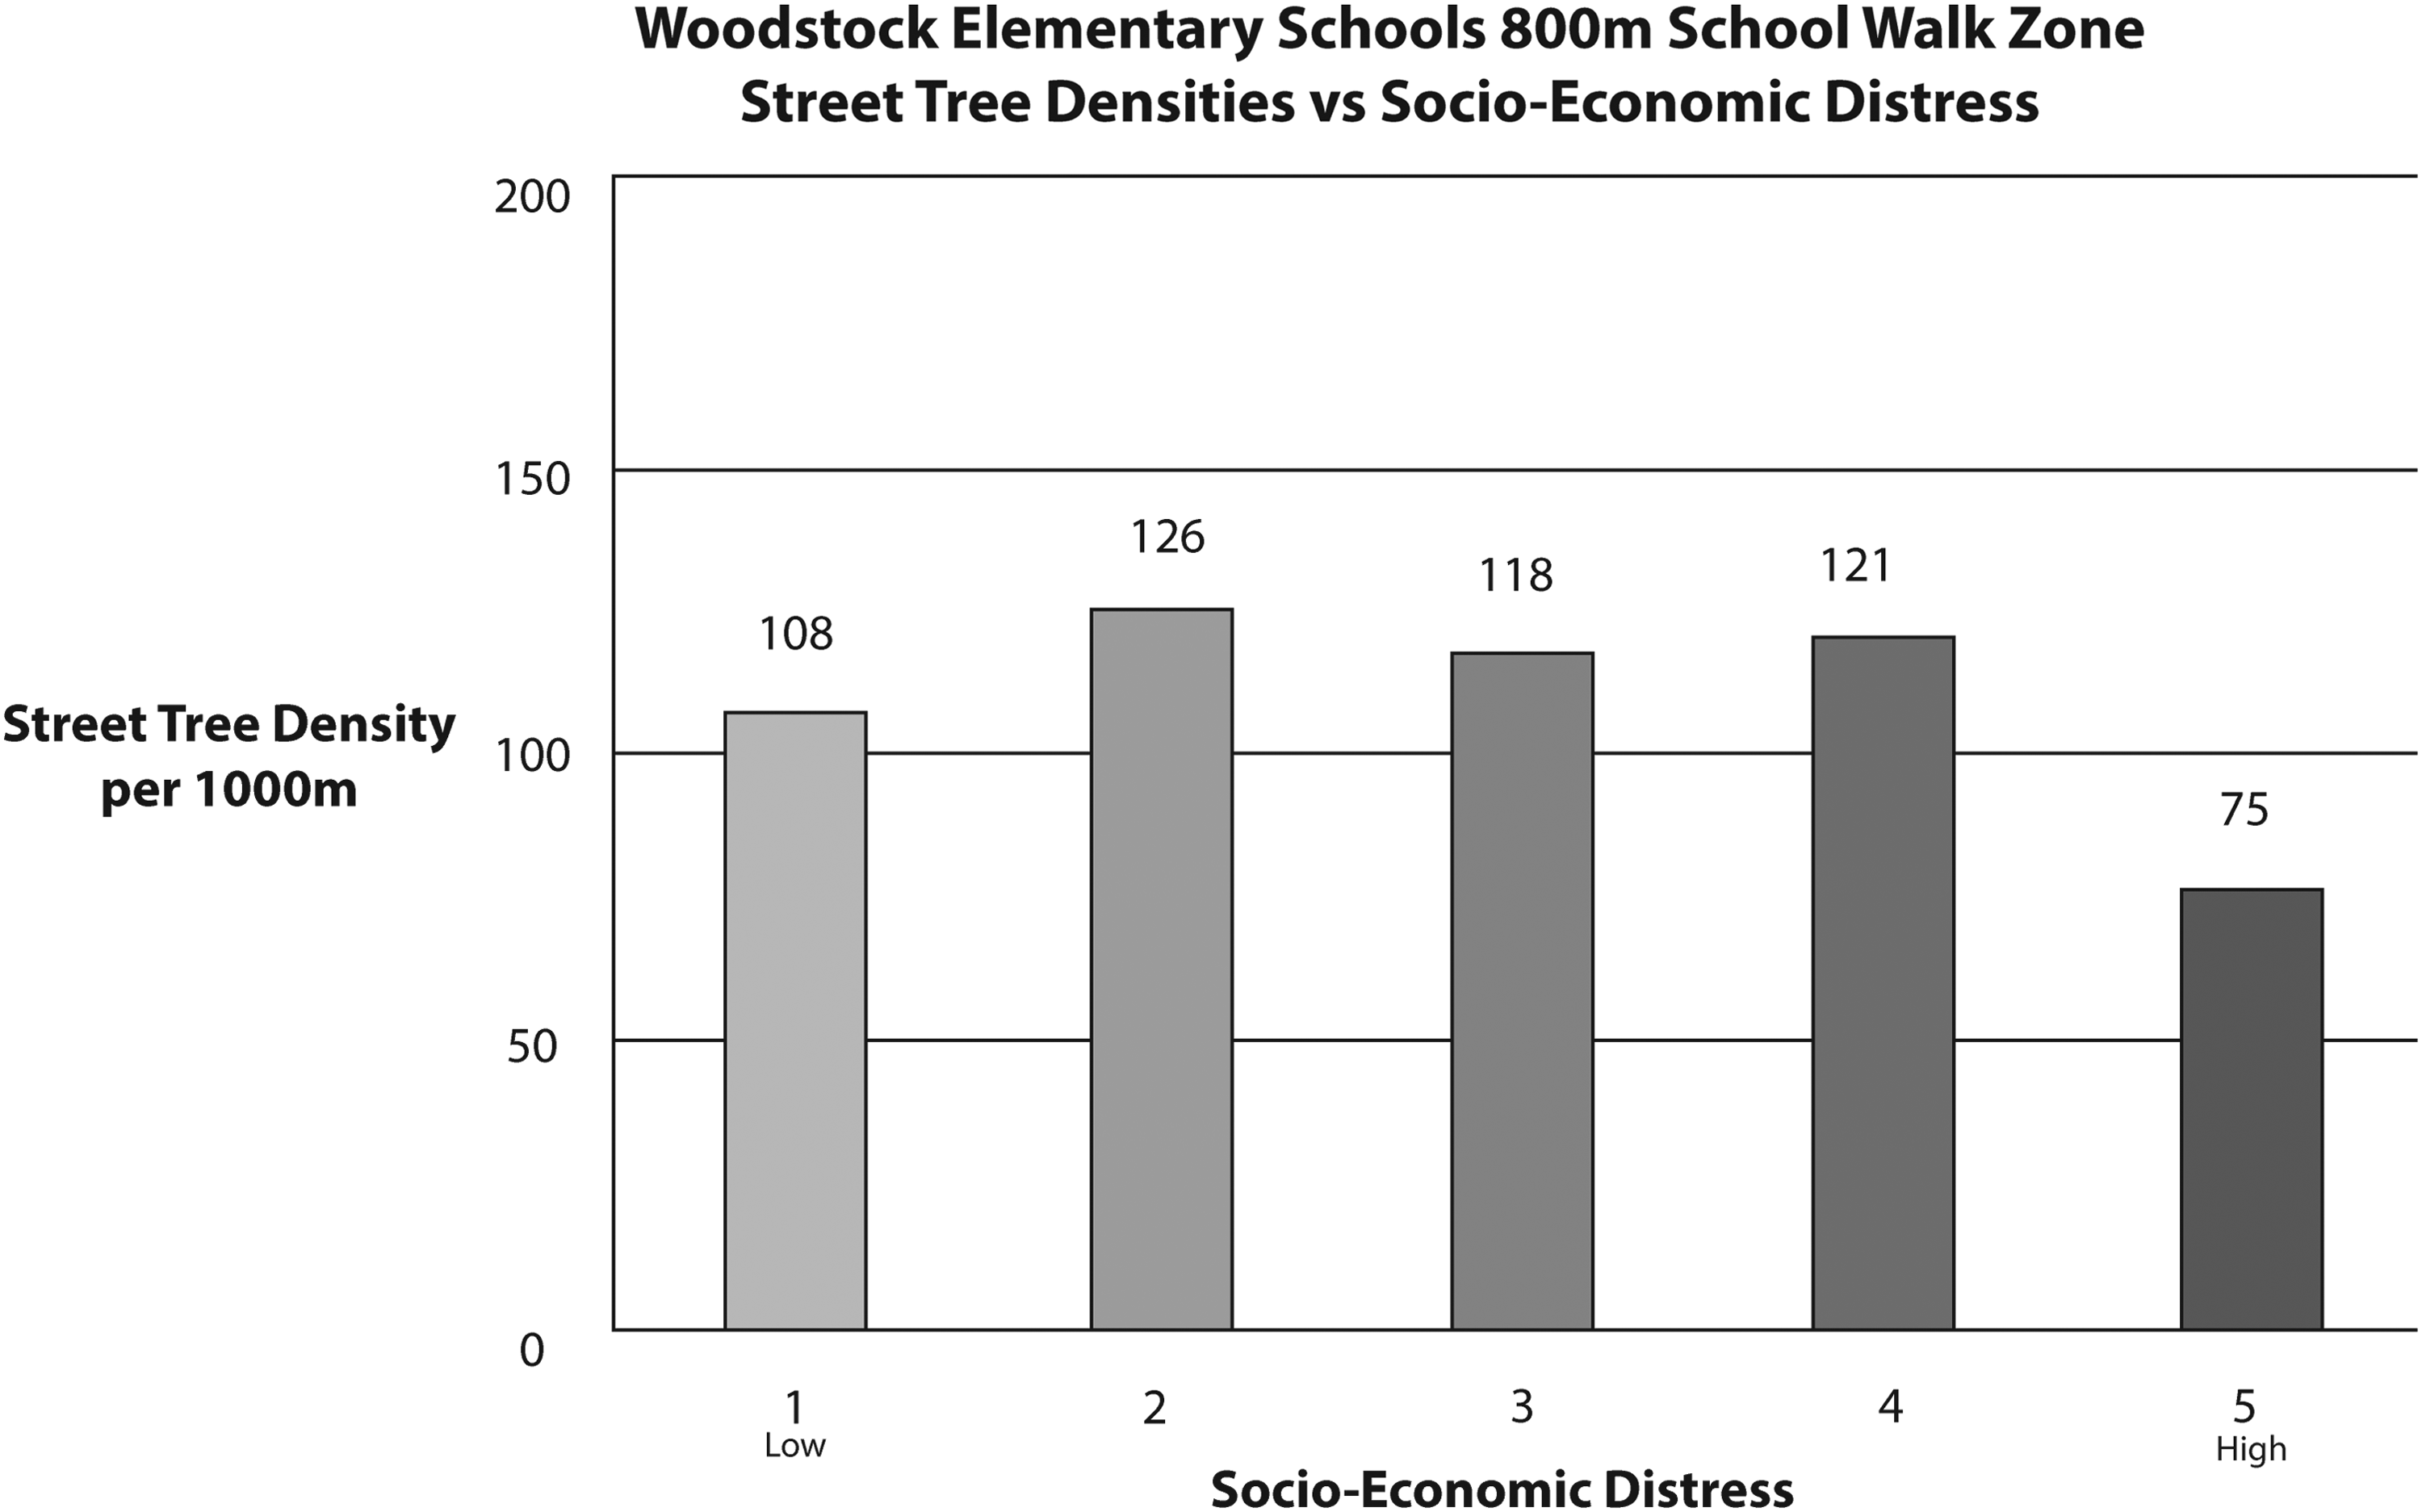
Woodstock street tree density versus SEDI at 800 m.
Woodstock street tree density at 800 m versus SEDI.
Stratford
The smallest city in the southwestern Ontario study sample shows a significant range of street tree densities from a low of 33 street trees per 1000 m to 198 street trees per 1000 m, the biggest range of any of the cities studied. When charted in relation to SEDI, it becomes evident that Stratford's street tree density, an inverse relationship is suggested (Fig. 8). When analyzed statistically, the correlation between street tree density and SEDI is p = −0.618 and that the relationship is supported by the trends shown when the data are charted (Fig. 9).

Stratford street tree density versus SEDI at 800 m.
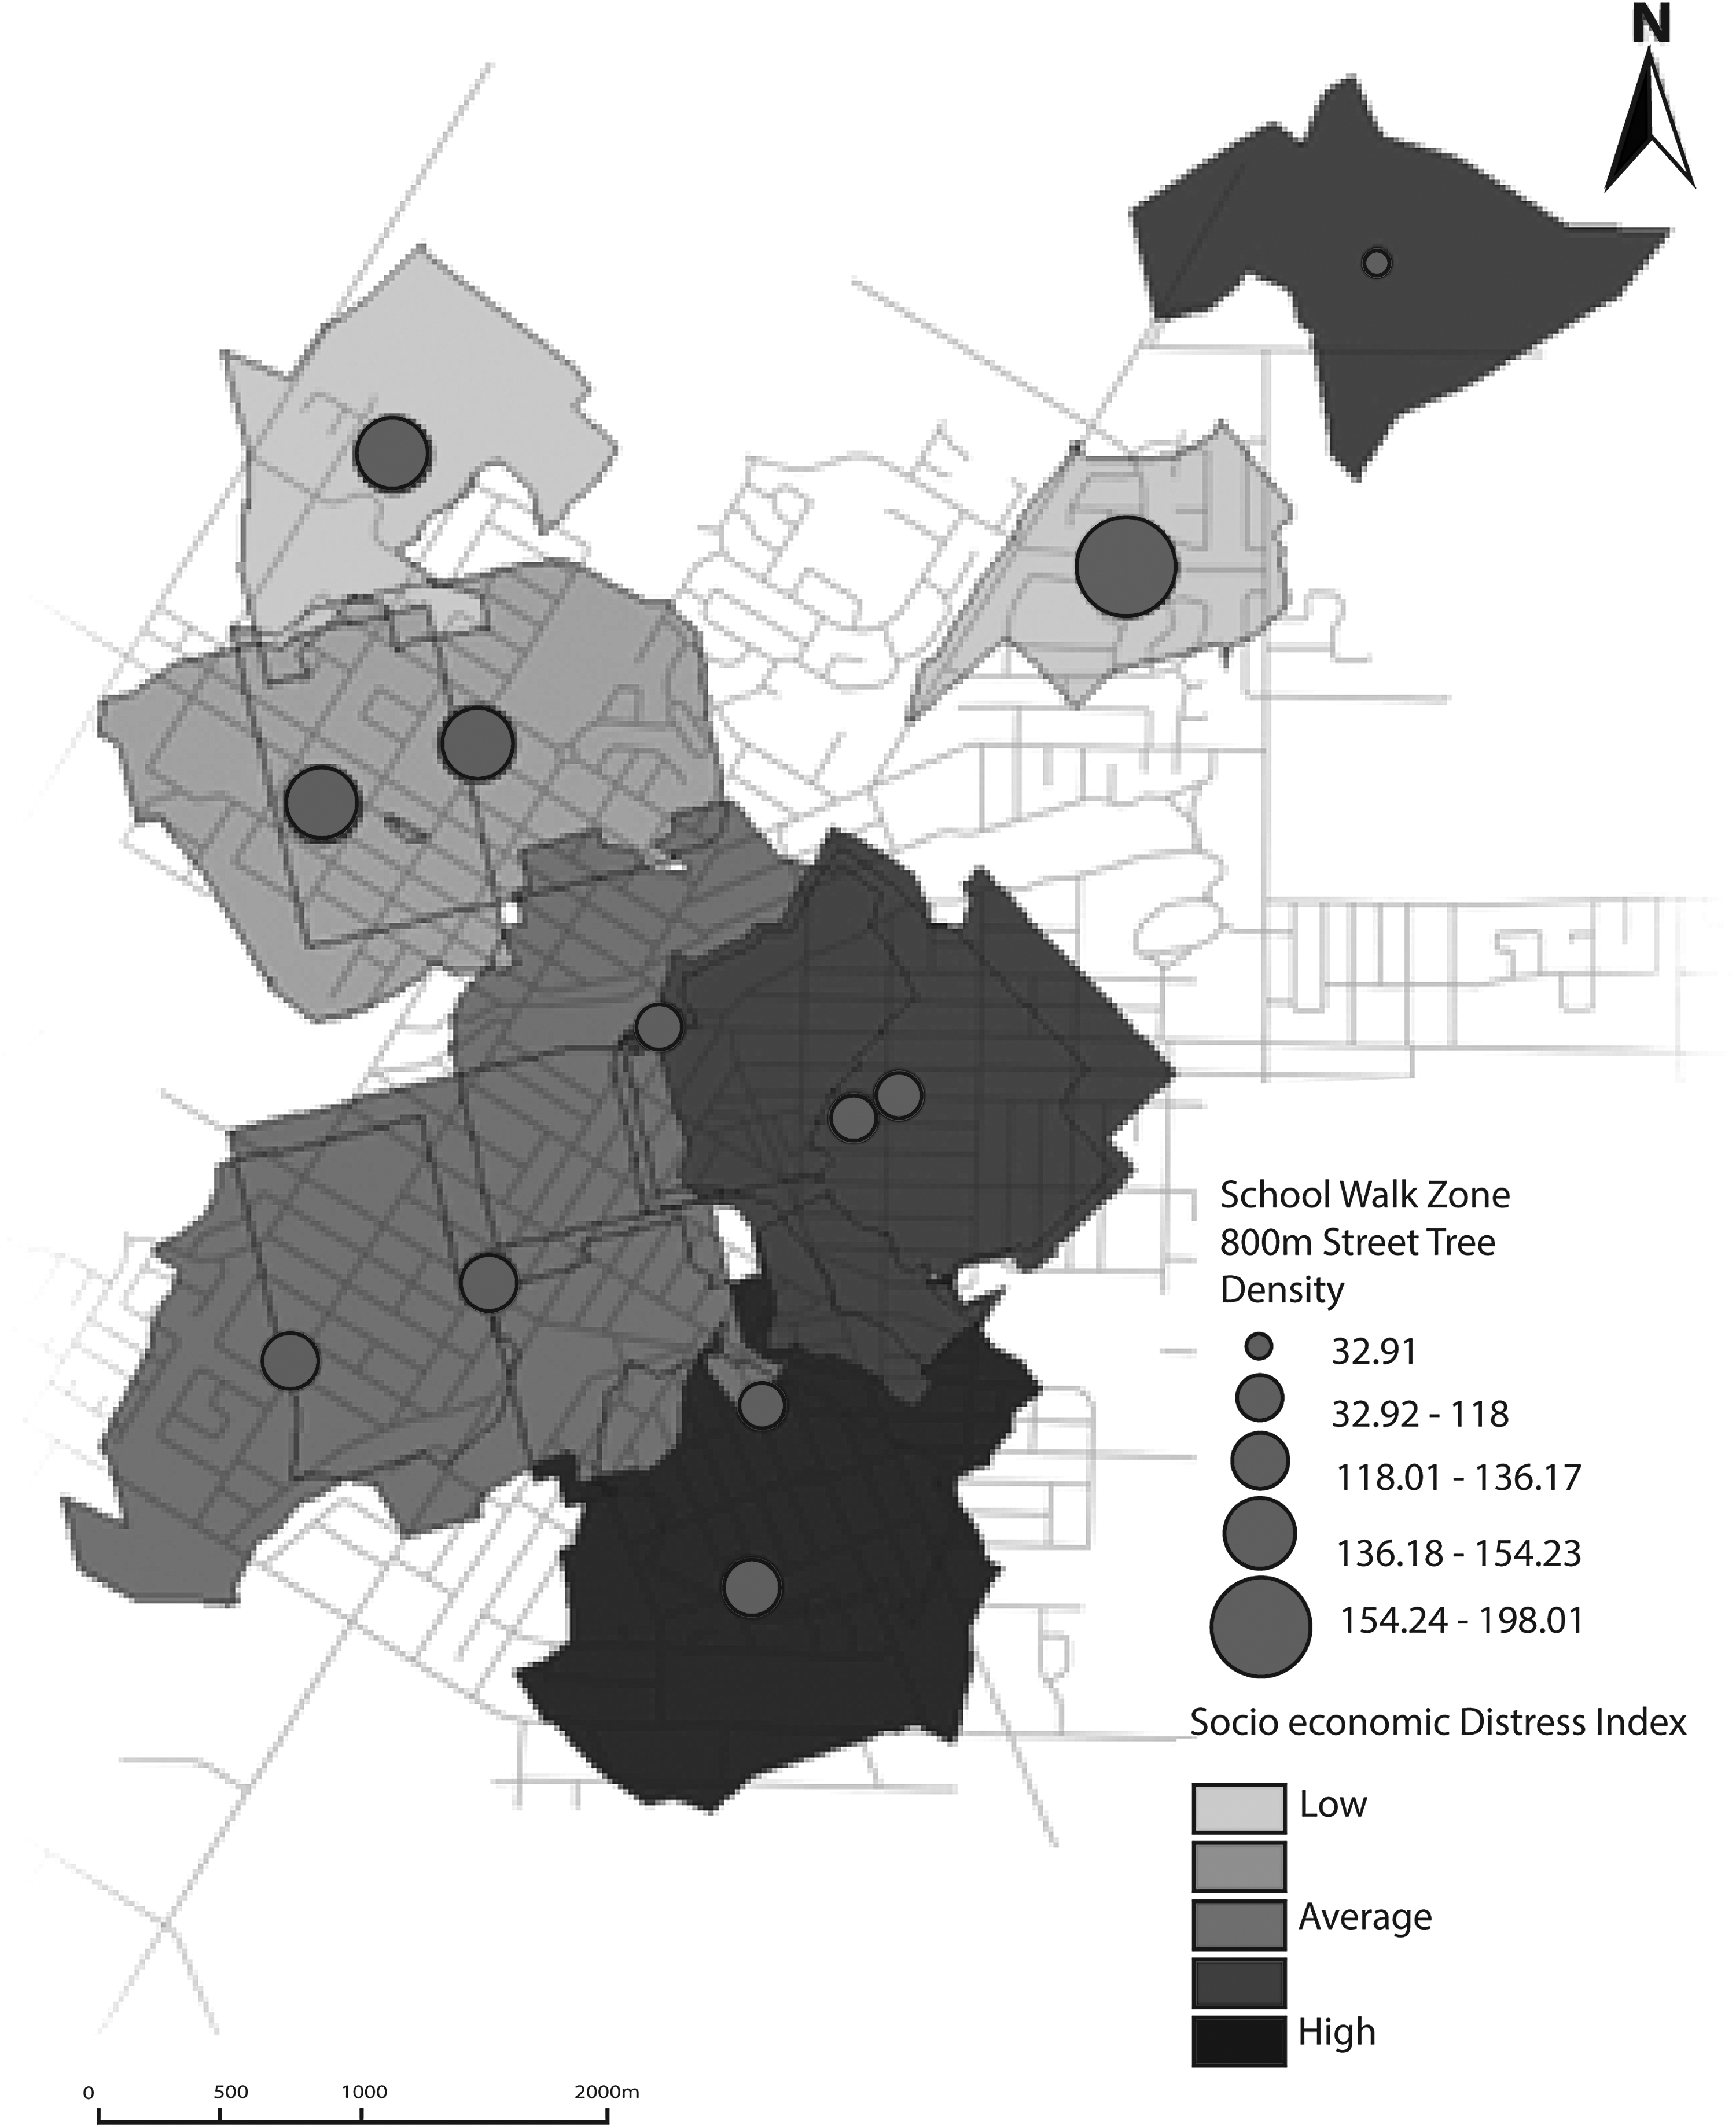
Stratford street tree density at 800 m versus SEDI.
Discussion
Life is not necessarily fair, but it is often more unfair for urban children living in areas of high socioeconomic distress. Research worldwide has shown that disadvantaged children are subject to more negative environmental exposures, which has significant harmful health outcomes; however, as this study demonstrates, children are also inequitably provided with beneficial exposures. 33 , 34 Publicly owned street trees provide benefits to all those with exposure to them, especially elementary school children. As concerns over children's attention disorders grow, the failure to provide an equitable urban landscape in the walk shed surrounding elementary schools, which could function to provide a therapeutic benefit to affected children, raises issues that must be addressed through public policy, planning, and urban design.
This research reveals that environmental inequities exist across cultures as evidenced by the spatial distribution of street trees in school walk zones surrounding elementary schools in the southwestern Ontario cities studied. This relationship agrees with patterns observed elsewhere in locations such as South Africa and Los Angeles that would more likely be expected to demonstrate such an inequity. 35 , 36 The actual significance of this disparity is yet to be established; however, previous research on green exposures suggests that these already disadvantaged children are likely receiving less of the healthful benefits afforded by exposure to natural environments. This inequity compounds the effects of their greater exposure to negative environmental factors as they are robbed of the nearby nature exposures that may have aided in their recovery.
One group that has significant and prolonged levels of the potentially positive exposure to street trees is children who live within the walk zones around school. Previous research demonstrates that exposure to green environments, even seemingly minor or brief exposure, offers many benefits related to learning that would aid in a student's scholastic success. However, it has also been shown that children in socioeconomic distress typically have the least access to the green environments, which would provide support to their healthy development and learning, despite the fact that they would benefit from it to the greatest extent.
As this research has demonstrated, the provision of street trees in the walk zones surrounding elementary schools in London, Brantford, and Stratford continued to exhibit the same inverse relationship with socioeconomic distress at the 800 m school walk zone level.
Conclusions
It could be argued that the relationship between street tree density and socioeconomic distress is simply a result of the wealthy utilizing their economic means to self-select to the neighborhoods that have higher quality urban forests; however, all of the cities studied have active, on-going tree planting programs and planning regulations mandating tree planting. Although it might make sense for there to be more large caliper trees in affluent neighborhoods, street tree density should not vary dramatically. One might think that it would seem likely that older, more affluent neighborhoods might have lower tree density as a result of the greater spatial demands of mature, large canopy trees. This, however, is not the case. Planners and designers working in the public realm of the streetscape need to focus their efforts upon planting more trees in neighborhoods, and specifically school walk zones, with high levels of socioeconomic distress. Although there is ample evidence already to motivate change, ongoing research could further explore the relationship between tree sizes: type, density, and the relative restorative benefits provided to further focus tree planting and design efforts.
Although this study identifies that street tree density is distributed in an inequitable manner, the actual effect of that inequity and the extent to which it is perceptible by a user in first person street level, lived perspective as opposed to the top-down, and aerial view used in GIS analysis have not been demonstrated. An investigation of less tangible benefits potentially provided by street trees, such as the ability to support health attention function and reduce stress, should be undertaken. The tree density measured in this study is a linear relation ship; however, lateral density across the street is also a factor to be considered. Narrower streets offer the opportunity for mature, large canopy trees to spread such that they create a contiguous overhead canopy that may influence perceived density. Research investigating the perception and benefit of street trees and street tree density, including lateral density, needs to be completed to achieve a full accounting of this positive environmental exposure.
Footnotes
Acknowledgments
The authors thank the cities that facilitated the study. They also thank Martin Healy, Sandra Kulon, and Ron Koudys Landscape Architects for their research support.
Authors' Contributions
E.P. and J.G. conceived the study; E.P. designed the study, created the database, analyzed the data, and wrote the first draft of the article; J.G. advised on study design and data analysis, and cowrote the article. Both authors have read and approved the final article.
Author Disclosure Statement
No competing financial interests exist.