
Abstract
Abstract
Several South Carolina (SC) communities are overburdened by pollution and may suffer from environmental health disparities. To address these disparities, improvements in screening approaches are needed to understand and mitigate risk. The purpose of this study was to develop a cumulative stressors and resiliency index (CSRI) that includes environmental stressors and resiliency buffers to rank human health and environmental risks at the census tract level in SC. We performed principal component analysis on variable subcategories to reduce the proposed indicators to 20 that reflected environmental stress and resiliency in communities impacted by environmental injustice. CSRI scores (0–100) were computed at the census tract level and high-risk census tracts were identified as CSRI scores in the 90th percentile. We performed a one-way analysis of variance (ANOVA) on CSRI scores by Environmental Affairs (EA) region and linear regression for percent non-white and CSRI scores. Choropleth maps were developed in ArcMap 10.5 using natural breaks to visualize spatial relationships. CSRI scores ranged from 7.4 to 64.0. The mean CSRI score for SC was 29.1, which was lower than the mean score for Upstate (35.2) and Midlands (31.7) regions. The one-way ANOVA results indicated a statistically significant difference in CSRI scores by EA region (p < 0.0001) except between the Lowcountry and Pee Dee regions [95% CI −1.53 to 2.68]. Based on the regression results, a one-unit increase in the percentage of non-white populations per census tract increased CSRI scores by roughly 6.1%. The results of our study support the inclusion of resilience factors in environmental justice assessments.
Introduction
R
CRA and environmental justice (EJ) screening tools have become more effective in identifying inequalities and population clusters impacted by environmental injustice. 4 Non-white and economically disadvantaged groups are often disproportionately burdened by environmental stressors and have the greatest exposures in their communities. 5 They may also lack access to health-promoting resources (i.e., grocery stores). 6 Without this salutogenic infrastructure in place, overburdened populations may not be equipped to counteract negative environmental exposures. Unfortunately, salutogenic factors 7 have not been systemically integrated into CRA screening tools to represent the relationship between resiliency, risk, and community-level vulnerability.
Community health resilience is defined as “the ability of a community to use its assets to strengthen public health and healthcare systems and to improve the community's physical, behavioral, and social health to withstand, adapt to, and recover from adversity.” 8 A population's physical, mental, social, and economic health may significantly impact community resilience 9 ; however, prioritizing and meeting the needs of highly vulnerable populations may foster macrolevel improvements in overall resilience. 10 When communities lack resiliency, they are also more likely to have higher mortality rates for adverse health conditions (i.e., heart disease). 11 Indices developed to quantify resilience have been limited by the following: (1) low applicability to community resilience, 12 (2) predominant focus on disaster resiliency, 13 (3) lack of granularity, 14 or (4) failure to directly measure environmental stressors and assets in a way that quantified and compared resiliency across communities. 15
Despite current efforts to design and refine resiliency and CRA tools, more work is needed to create an index that quantifies risk based on a community's exposure to environmental stressors and presence of resiliency buffers that may reduce risk. In this study, we developed a cumulative stressors and resiliency index (CSRI) hybrid that comprised environmental exposures and resilience factors used to rank human health and environmental risk at the census tract level. We apply the CSRI to South Carolina (SC) to determine which indicators can be used to examine the cumulative burden of environmental stressors and resiliency. Moreover, we assess potential disparities in CSRI scores by region and race/ethnicity.
Materials and Methods
Overview
We designed a CSRI that screens for cumulative risk based on the relationship between chemical and nonchemical stressors and resiliency factors that may buffer against environmental exposures, hence creating a more accurate risk calculation. The primary categories in the index are “environmental stressors” and “resiliency buffers,” while subcategories include environmental hazards, environmental exposures, pathogenic factors, and salutogenic factors (inverse) (Fig. 1).
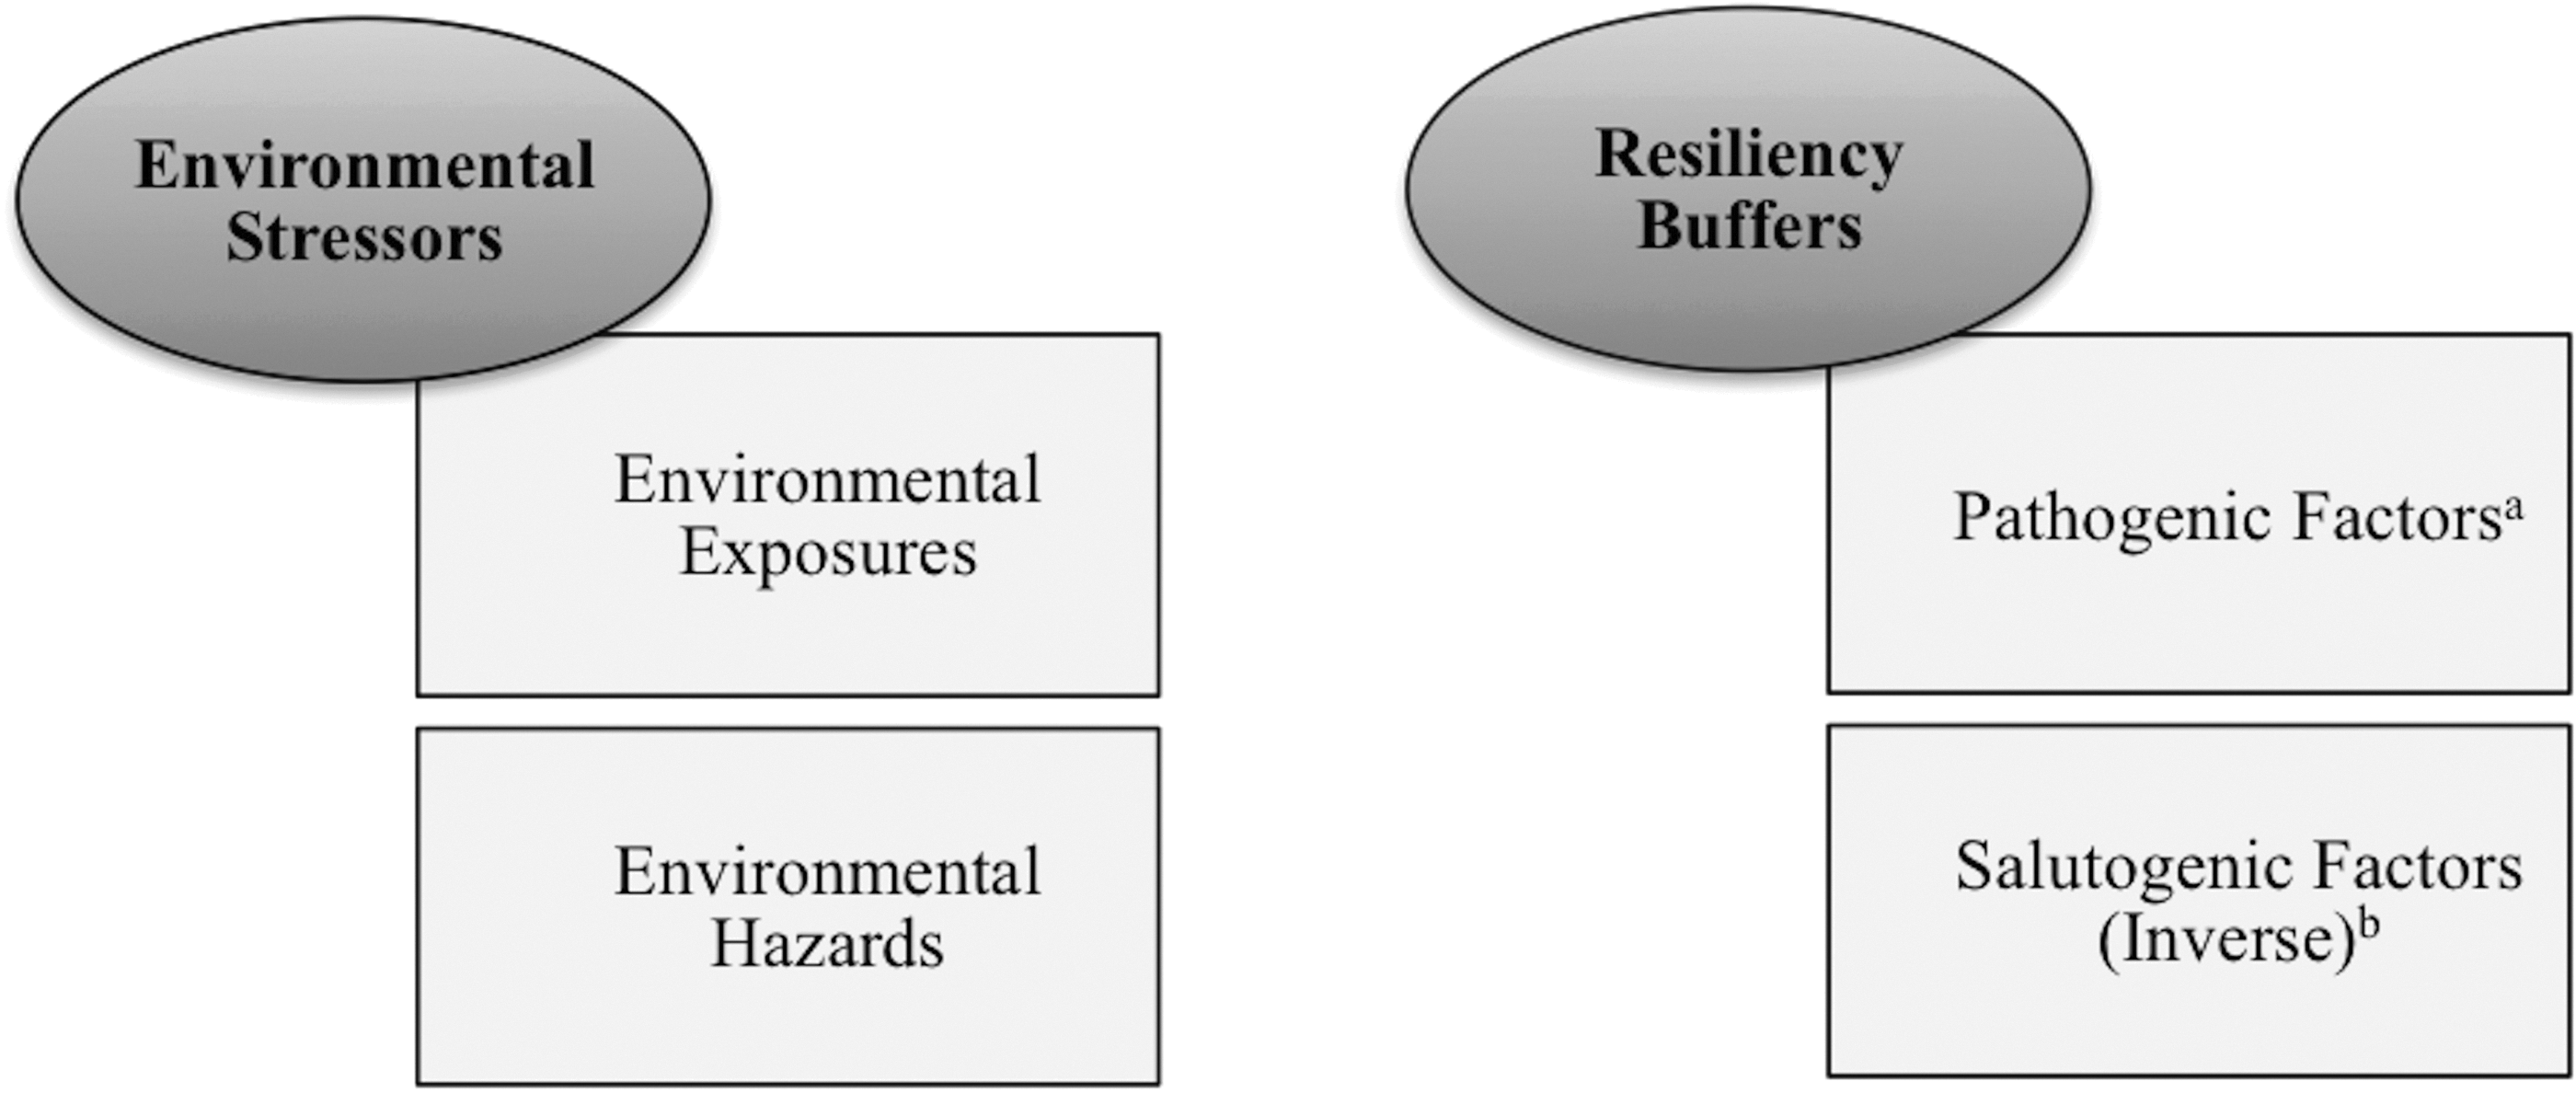
Primary and subcategories of the CSRI. aPathogenic factors on the lower spectrum create a buffer effect (i.e., low violent crime promotes resiliency compared with high violent crime). bTaking the inverse of salutogenic factors meant assigning lower scores to neighborhood assets on the higher end of the spectrum (i.e., adequate or high access to grocery stores) to represent greater resiliency, and higher scores to assets on the lower end of the spectrum (i.e., low access to grocery stores) to reflect low resiliency. CSRI, cumulative stressors and resiliency index.
Approach
The relationship between stressors and resiliency is embedded in our CSRI where we multiply environmental stressors (environmental exposures+environmental hazards) by resiliency buffers (pathogenic factors+inverse of salutogenic factors) to calculate a risk score for each census tract. We used a multiplicative approach for the calculation since a higher prevalence of stressors may increase community susceptibility to the impacts associated with pollution exposures.
16
Our calculation was modified based on a risk formula used by CalEPA
17
in its cumulative impact assessment tool:
Resiliency buffers are used instead of vulnerability since we focus more on individual-level and community-level assets and take into account the impact of common pathogenic factors that may influence vulnerability. The combination of pathogenic factors on the lower spectrum (i.e., low unemployment) and salutogenic factors on the higher spectrum (i.e., high access to grocery stores) allows the resiliency buffers to become protective against environmental exposures and reduces the overall CSRI score.
Indicators
The 26 indicators selected for the CSRI were informed by interviews with community residents and scientific literature known to have a positive or negative association with adverse health outcomes. We created a potential list of CSRI indicators (Table 1) and used principal component analysis (PCA) to systematically construct the final list using SAS Enterprise Guide version 7.1. PCA does not make assumptions regarding the causal structure of variables, but it is a variable reduction procedure used to capture indicators that explain most of the variance among observed variables. Other studies have documented the use of this variable reduction procedure in creating an index. 18
PM, particulate matter; TRI, toxic release inventory.
We performed a separate PCA for all subcategories and entered each variable into the model based on our findings from a previous study where African American residents in North Charleston, SC, prioritized EJ issues impacting their community.
19
For example, the highest percentage of residents ranking an indicator as an extremely high priority was entered into the PCA model first, followed by the next highest ranking variable within a respective subcategory. Any indicator accounting for >10% of the total variance among observed variables in a subcategory was a candidate for the final CSRI based on the following equation:
where the denominator (total eigenvalues of correlation matrix) is equal to the total number of variables (N = 26) being analyzed. 20 The 26 proposed indicators were reduced to the 20 used in the equation to calculate CSRI scores for each census tract (Table 2).
ACS, U.S. Census American Community Survey; ACRES, Assessement, Cleanup and Redevelopment Exchange System; HPSA, Health Professional Shortage Area; HRSA, Health Resources & Service Administration; NPL, National Priorities List; PCA, principal component analysis; RSEI, Risk-Screening Environmental Indicators; SC, South Carolina; SCDHEC, SC Department of Health and Environmental Control.
Indicators were assigned a score from 0 to 1 in increments of 0.25 based on a census tract's percentile range and represented a community's rank for each stressor or resiliency factor (Table 3). For example, a census tract with a high mean concentration of diesel particulate matter (PM) would receive a higher score closer to 1, while a tract with a low mean concentration of diesel PM would be ranked closer to 0. Each census tract could receive a score of 0, 0.25, 0.50, 0.75, and 1 that would correspond with percentiles calculated from state estimates.
CSRI, cumulative stressors and resiliency index.
The “access to grocery stores” indicator was scored as 1 or 0 to represent a low access or nonlow access tract, respectively. For environmental exposures, environmental hazards, and pathogenic factor subcategories, being in the lower percentile represented lower exposures. Regarding salutogenic factors, being in the lower percentile meant a census tract had greater access to community assets such as higher education, more health insured individuals, and was not designated as a Health Professional Shortage Area (HPSA) or was a HPSA with a lower need for primary health professionals in the area.
The environmental hazard indicator scores corresponded with four groups that were developed based on a census tract's distance to a specific hazard. We decided not to use a weighting method for our environmental hazards indicators previously applied in CalEnviroScreen 3.0 21 since we still need to consider how to appropriately weight the resiliency buffers in a way that counteracts environmental hazards. The CSRI scores could range from 0 to 100 (Table 3), where low scores were indicative of low risk/high resiliency and high scores represented high risk (HR)/low resiliency.
Results
Study area
CSRI scores were calculated for census tracts in SC, which is located in the southeastern region of the United States and spans ∼30,061 square miles of rural and urban landscape. SC may be further divided into four Environmental Affairs (EA) regions that provide local support to communities located within their boundaries: (1) Upstate, (2) Midlands, (3) Pee Dee, and (4) Lowcountry. SC has 1103 census tracts that equate to 3059 block groups and 181,901 blocks. 22 Census tracts (15) assigned to bodies of water and those with little or no residential population were excluded from the analysis, 23 thereby reducing the total number of census tracts to 1088.
The population consists of ∼4,625,364 residents with 153.9 persons/square mile. 24 The population is mostly non-Hispanic white (66.2%), followed by non-Hispanic black (27.9%) and Hispanic/Latino (5.1%). SC's median household income ($45,483) is roughly $8,400 lower than the median income for the United States ($53,889). 24 The percentage of persons below poverty level in SC (16.6%) exceeds the U.S. average (13.5%).
Analysis
CSRI scores were calculated for the 1088 SC census tracts. Indicator data were obtained from various publicly available websites, requested from an agency, or purchased from a vendor. A crosswalk was used to convert all data to the appropriate scale using SAS Enterprise Guide version 7.1. Data sets were linked with SC census tracts and percentiles were calculated based on the raw scores for each indicator (Table 4). The percentiles for each census tract were assigned a value ranging from 0 to 1 that was incorporated into the final CSRI calculation.
N/A, not applicable; VMT, vehicle miles traveled.
Census tracts were assigned a score of 0 if they had a raw score of 0 for the respective indicator, while census tracts with scores in the <25th percentile range (excluding 0) received a score of 0.25. Census tracts in the >25th to 50th percentile were scored as 0.50, those at the >50th to <75th percentile receive a score of 0.75, and any census tract at the >75th percentile range was scored as 1. The salutogenic factors received an inverse indicator score based on the respective raw score. For example, census tracts with adequate or high access to grocery stores received a low indicator score (0) to represent greater resiliency. Census tracts with low access to grocery stores had a higher indicator score (1.00), which contributed to an increase in the overall CSRI score.
The scores assigned to each percentile were summed for both categories and multiplied to compute the final CSRI score. An example calculation for the CSRI is shown in Table 4. Descriptive statistics for mean (M), standard deviation, minimum, and maximum values of CSRI scores were calculated for the state and four EA regions. We calculated CSRI scores in the 90th percentile for the state and EA regions to represent HR tracts. Any census tract with a CSRI score ≥90th percentile for the state was a HR community with high stress/low resiliency. A one-way analysis of variance (ANOVA) was also performed to assess mean differences in CSRI scores by EA region.
Choropleth maps were created using ArcMap 10.5 to illustrate the spatial relationship between CSRI scores (Fig. 2) and percentage of non-white populations (Fig. 3) across the state. Each map contained five classes using natural breaks that depicted variations between the highest and lowest class of scores. Linear regression was used to assess racial/ethnic disparities in cumulative exposures to environmental stressors and resiliency buffers at a significance level of 0.05 (Table 6). Percent non-white was the independent variable and CSRI score was the dependent variable in the model.
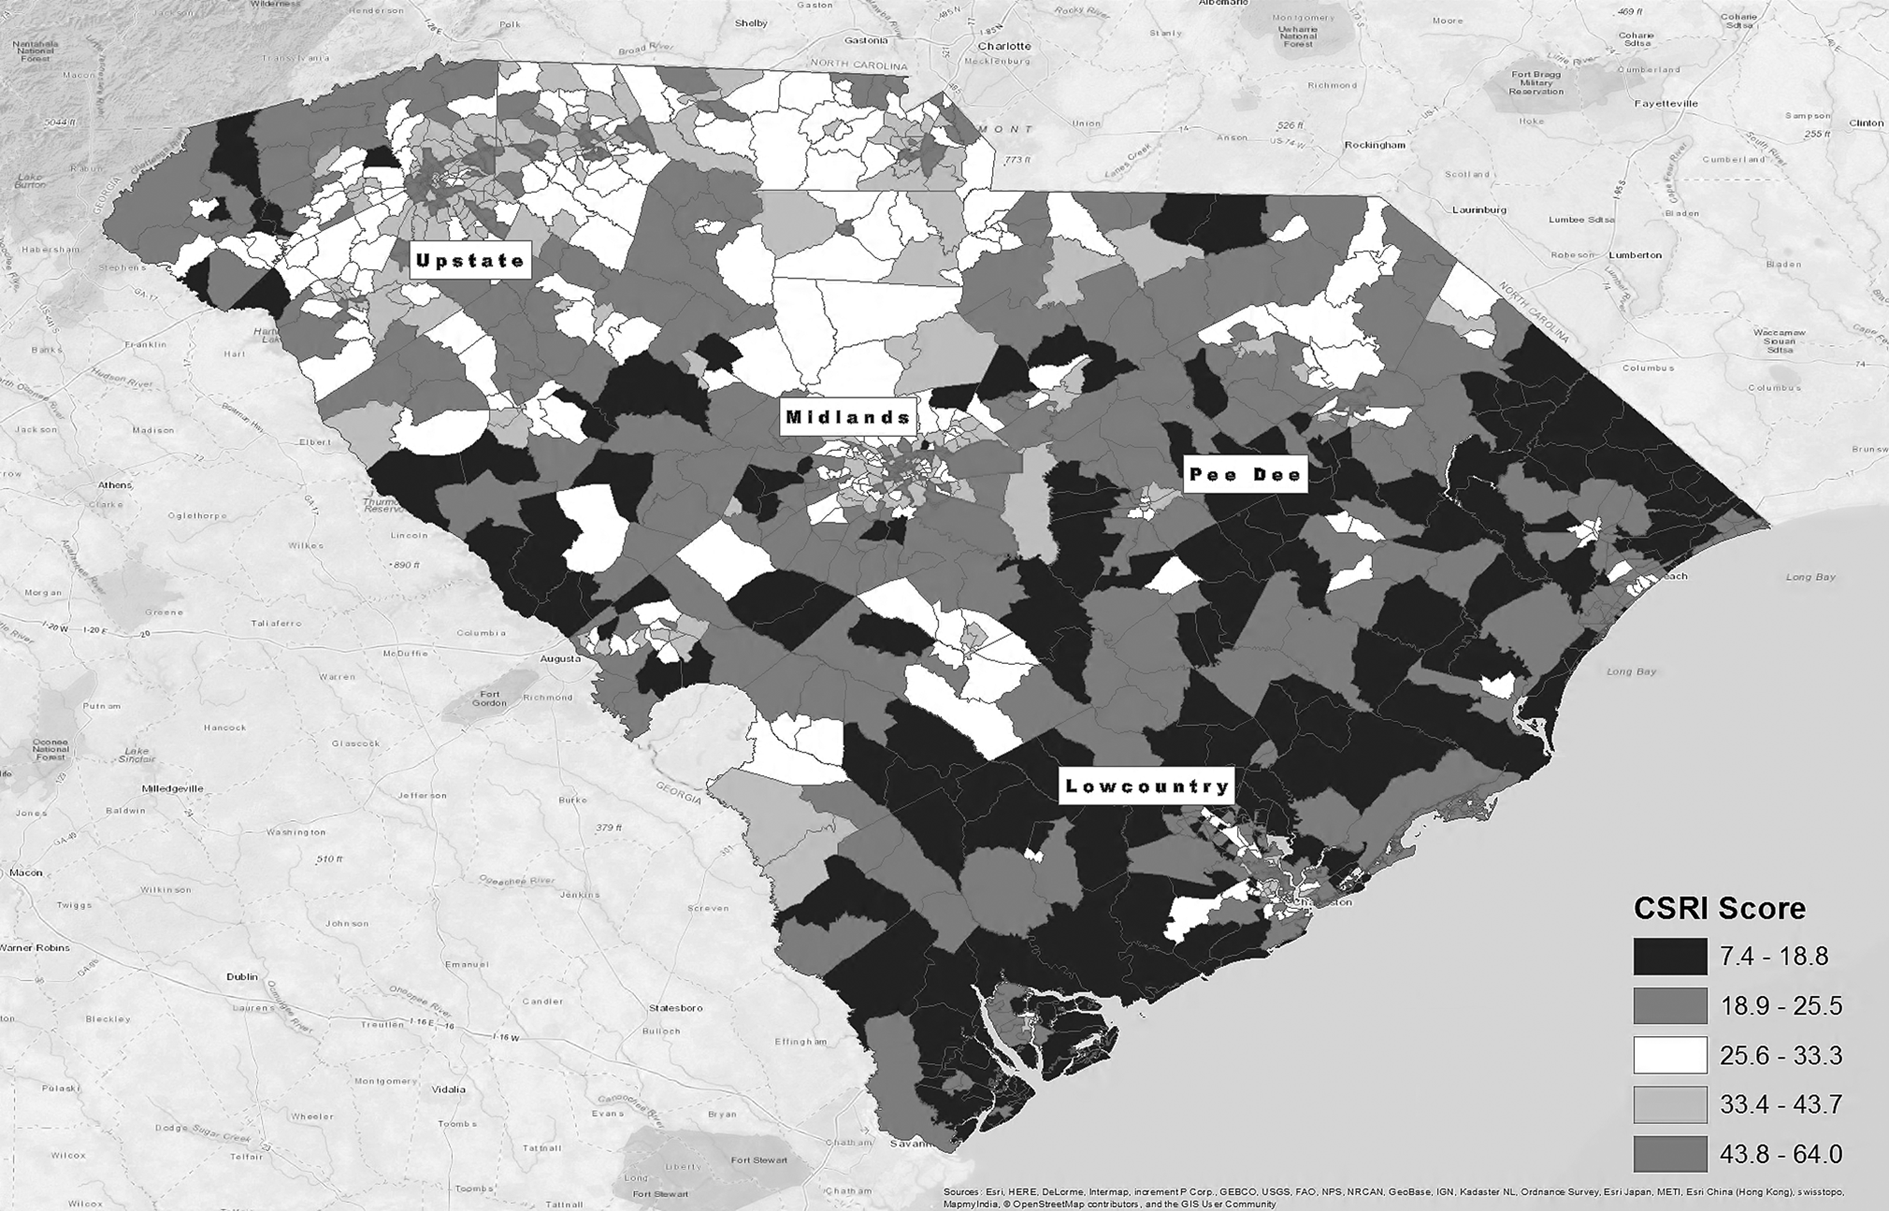
Choropleth map of CSRI scores by census tract. Fifteen census tracts (marked in gray) were excluded due to their census assignment to bodies of water (9900s) and have little or no residential population (9800s, 45027960202, and 45061920301). CSRI scores range from low risk to high risk based on a community's combined load of environmental stressors and resiliency buffers. The highest class of CSRI scores (43.8–64.0) represents communities in the 90th percentile for risk or those classified as “high risk.”
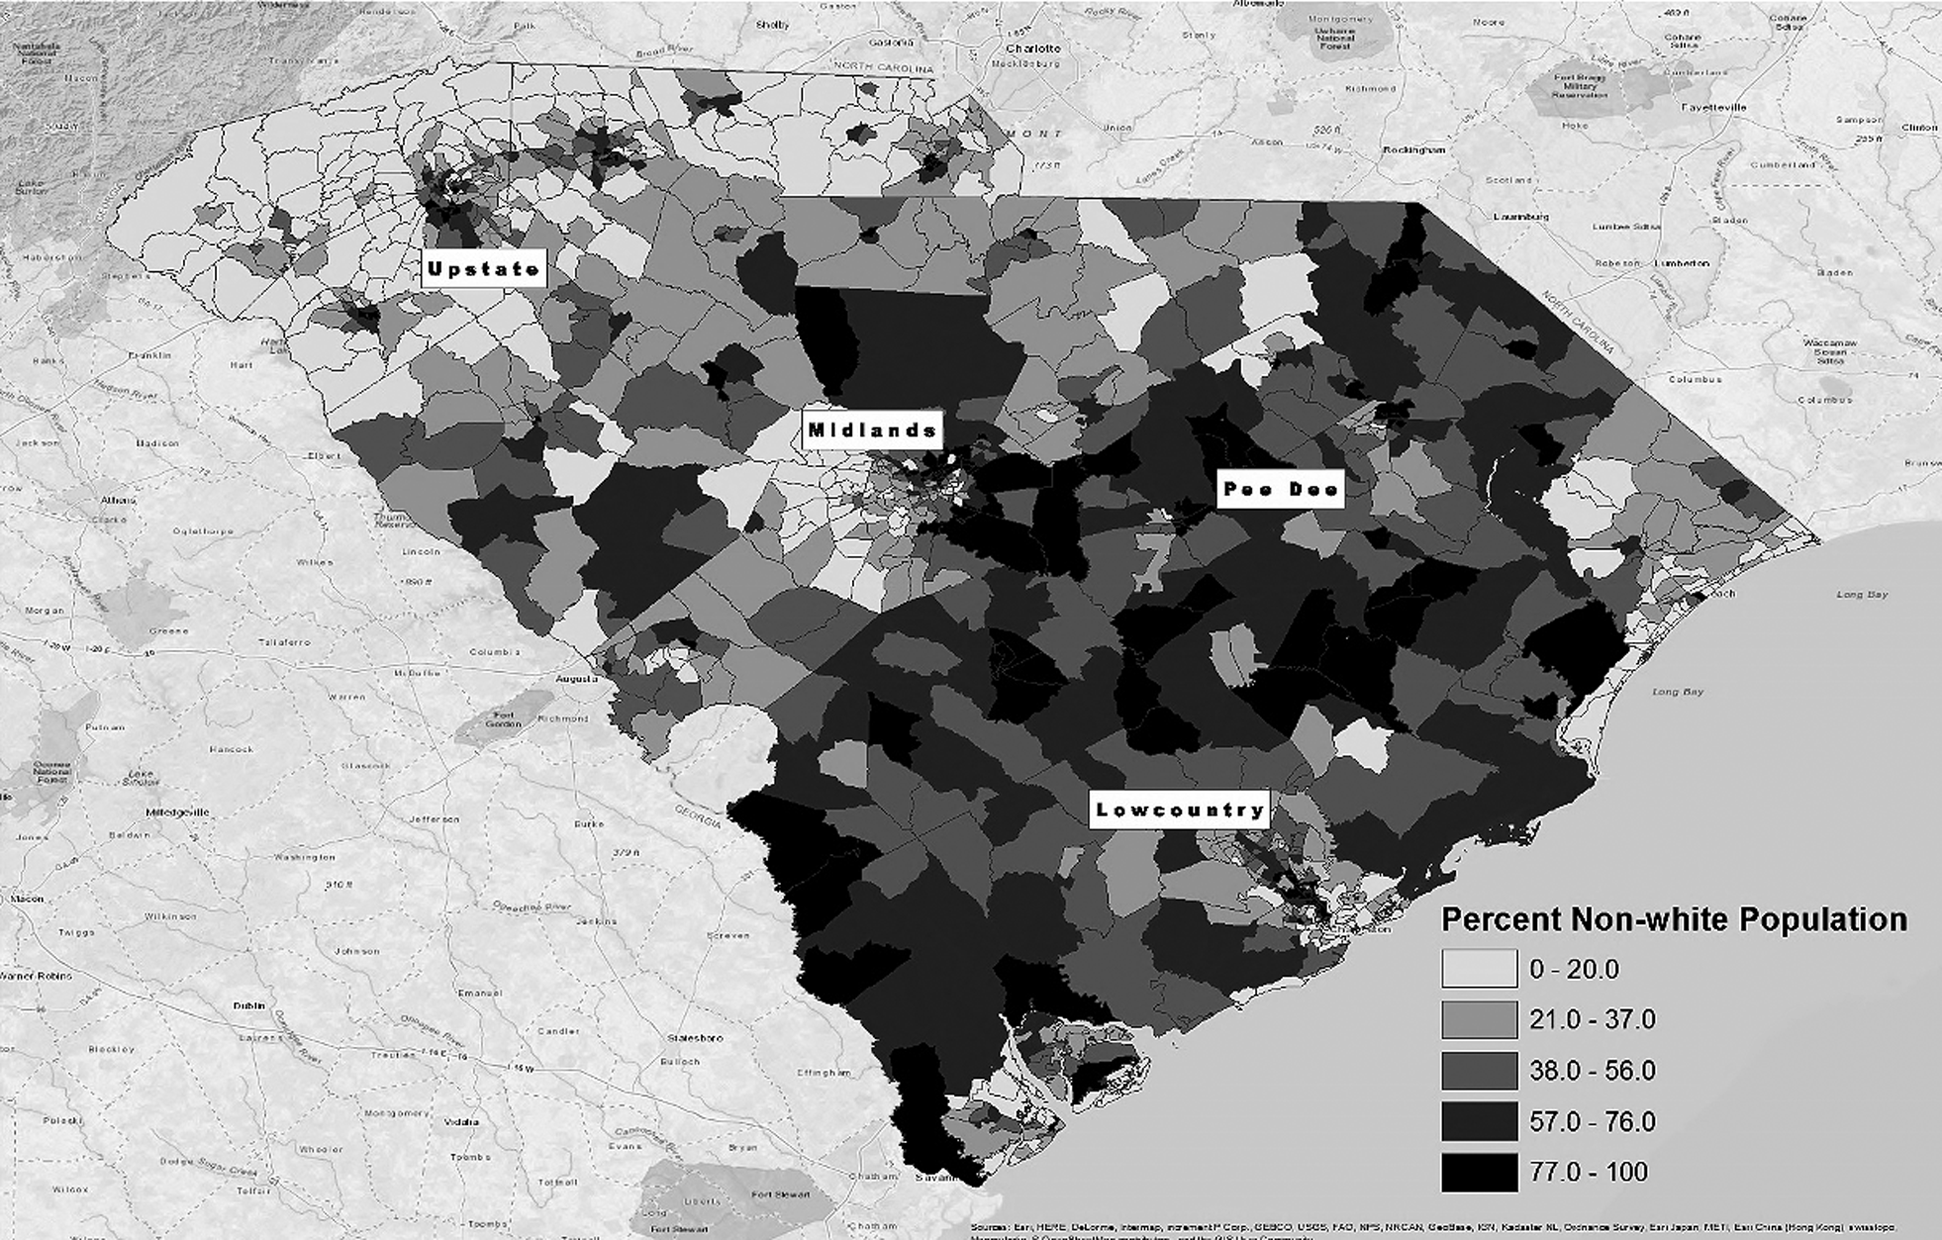
Choropleth map of percent non-white population by census tract. Fifteen census tracts (marked in gray) were excluded due to their census assignment to bodies of water (9900s) and have little or no residential population (9800s, 45027960202, and 45061920301).
Based on our PCA criteria for selecting the final CSRI model, 17 indicators explained ≥10% of the total variance for their respective subcategory (Table 2). Traffic density (4.8%), toxic releases from toxic release inventory facilities (6.4%), and leaking underground storage tanks (3.6%) did not meet the ≥10% variance criteria; however, they were still included in the index due to their impact on health and presence in other EJ assessment tools (i.e., CalEnviroScreen). Five of eight pathogenic indicators met the inclusion criteria, which eliminated linguistic isolation (8.7%), Gini index (5.1%), and low birth weight (3.9%) from the final CSRI. Five of eight salutogenic indicators also met the inclusion criteria, thereby excluding mental health services (8.5%), access to green space (5.4%), and homeownership (4.7%). CSRI scores for each census tract ranged from 7.4 to 64.0 (M = 28.0) (Table 5).
90th percentile score.
Fifteen census tracts were excluded due to their census assignment to bodies of water (9900s) or those with little or no residential population (9800s, 45027960202, and 45061920301).
SD, standard deviation.
p is statistically significant at alpha level 0.05.
ANOVA, analysis of variance.
The one-way ANOVA findings yielded a statistically significant difference in CSRI scores by EA region (p < 0.0001) (Table 6). The Tukey's Honestly Significantly Difference (HSD) test calculated more specific regional comparisons, and results indicated significant differences in CSRI scores only applied to certain regions. There was no statistically significant difference in mean CSRI scores when Lowcountry was compared with Pee Dee since the 95% confidence intervals (CIs) [−1.53 to 2.68] overlapped. All other regional comparisons remained significant in the HSD (α = 0.05). The linear regression model containing percent non-white populations and CSRI scores was also statistically significant (α = 0.05; p < 0.0001), where a one-unit increase in the percentage of non-white populations increased CSRI scores by roughly 6.1% at the census tract level (Table 6).
Results from the choropleth maps (Figs. 2 and 3) show the highest scores in areas containing the highest percentage of non-whites. The red areas on the CSRI map represent tracts close to or within the 90th percentile for CSRI scores (≥43.8) in the state. These HR tracts are primarily located in more densely populated counties such as Charleston, Florence, Greenville, Spartanburg, Anderson, and York. The census tract with the highest CSRI score (64.0) and hence the low resiliency was detected in the Upstate region in Greenville County, SC. The tract with the lowest CSRI score and high resiliency (7.4) was located in Berkeley County, SC, in the Lowcountry region. Many HR census tracts were geographically adjacent to tracts with low stress/high resiliency.
Discussion
This study was designed to address the lack of assessment tools that include resiliency as a protective factor in mitigating the impacts of exposure to environmental stressors. We integrated a unique combination of environmental stressors and community assets into one model that has traditionally been omitted from CRA tools. 25 For example, we used pathogenic indicators such as “segregation” and “violent crime” paired against salutogenic factors such as “access to primary healthcare” and “access to grocery stores” to buffer the negative impacts of the stressors. CRA tools that only consider pathogenic factors may overestimate risk.
We found a direct relationship between percentage of non-white populations per census tract and CSRI scores and identified HR census tracts with CSRI scores in the 90th percentile for the state that would benefit from a risk reduction plan. For example, there were two census tracts in the Lowcountry region with similar population sizes and over a fourfold difference in CSRI scores (11.3 vs. 52.6). The high resiliency census tract was predominately white (76.0%) with the following characteristics: (1) access to grocery stores, (2) highly insured, (3) no alcohol outlets or fitness facilities, (4) low crime and unemployment rate, (5) moderate access to primary healthcare, and (6) high educational attainment. Despite the high percentage of poverty (83.1%), lack of fitness facilities nearby, and exposures to environmental stressors (e.g., TRI facilities ≤2.5 km and toxic releases) in this tract, risk remained low.
In contrast, the low-resiliency census tract was predominately non-white (88.0%) with the subsequent characteristics: (1) no nearby grocery stores or fitness facilities, (2) low insured population and educational attainment, (3) high alcohol outlet density, (4) high crime and unemployment rates, (5) low access to primary healthcare, and (6) low poverty. This census tract had a lower poverty rate (39.0%) than the previous tract and similar outcomes for PM2.5 and ozone concentrations, but their resiliency factors could not offset enough environmental stressors to have an overall impact on the cumulative score. This census tract was located near TRI facilities, superfund sites, LUSTs, and brownfields (≤2.17 km), which may have contributed to some differences in scores. Nevertheless, the interaction between resiliency factors and environmental stressors requires further exploration to determine the exact combination of salutogens required to significantly reduce the effects of exposures to environmental hazards.
While CRA is an iterative process, there are still actionable solutions that can be implemented to reduce environmental health disparities. For example, our tool may be used in a decision-making capacity to prioritize needs of specific communities based on the individual assessment of indicators before they were combined into a cumulative index. We also see this tool as an opportunity to create sister communities in the four EA regions in SC that can share resources. Our map of CSRI scores indicates low-resiliency communities are often located adjacent to high-resiliency/low-stress communities, which means they could partner in risk reduction activities and provide support to one another in areas of weakness to build healthy community ecosystems.
Despite efforts to follow CRA principles in our study, there were limitations. We selected variables mostly derived from publicly available data sets, and so, our CSRI scores would be comparable to census tracts in other states; however, a few of the variables required a license to gain data access (i.e., fitness facilities, alcohol outlets). As a result, some entities may not have the resources to obtain access to these data sets. We also could not include all possible measures of environmental exposure in our index or capture every exposure during the exact same time period. Most of our indicators were collected from the American Community Survey from 2011 to 2015, but ozone, PM2.5, and risk screening environmental indicators concentrations represented 2010 estimates and hazards data (i.e., Superfund sites, TRI facilities, LUSTs) had variable years (Table 2).
Although we used community stakeholder feedback to populate the PCA model, the results were still driven by the order the variables were loaded. Therefore, it was important to engage communities most impacted by EJ issues to inform this process so the index addressed community-specific problems. The issues in low–middle-income African American urban communities may not reflect priorities in communities with differences in race/ethnicity and socioeconomic status. Moreover, a few variables were only available at the county level (e.g., violent crime, low birth weight, traffic density), and so, we applied county-level estimates to all census tracts in that county. Air pollution concentrations were estimated from a few monitors located in densely populated areas; therefore, extrapolating that data may have introduced misclassification and conditional bias. Using crosswalks and combining data sets into one cumulative index may have compounded error already embedded in the individual data sets (i.e., missing data, sampling error).
In the next version of the CSRI, we plan to explore other variables that could be incorporated into the index and improve our calculation. We will also examine weighting classifications that appropriately reflect the level of impact each variable may contribute to environmental stress and resiliency. Furthermore, we will focus our analysis on just Charleston, SC, and evaluate our index against other CRA and EJ assessment tools. We will also perform this analysis in other states in USEPA Region IV to determine the utility of the tool beyond the borders of SC.
Conclusion
This study demonstrates that a CRA tool embedded with salutogenic and pathogenic factors is a viable method for screening risk and community resiliency. Finding racial/ethnic disparities in CSRI scores and HR census tracts located in more urban landscapes is not necessarily novel; however, our index allowed us to identify a blueprint for targeting communities that have low resiliency. Our findings indicate that resiliency factors may be more important in reducing risk than attempting to eliminate exposures to environmental hazards. Moreover, our methods may be used by federal, state, and local agencies to better identify and prioritize HR areas in a single tool based on a community's stressors and assets. These methods could also be used to inform actionable solutions for programs similar to the Green Zone Initiative 26 that creates more resilient, equitable, and healthy communities.
Footnotes
Acknowledgments
We thank Mr. Charles Naney for his support with data management, GIS, and analysis-related activities. We also thank Qi Yang from the UMD GIS and Geospatial Services Center for his support with GIS, as well as all of the agencies that provided us with data for the CSRI variables. Finally, we thank Drs. Donald Milton and Sharon Desmond from the UMD School of Public Health for their contribution to the article.
Author Disclosure Statement
No competing financial interests exist.