




Abstract
Abstract
Across the United States, low-income populations, people of color (POC), and marginalized and disenfranchised groups experience an unequal burden from environmental hazards such as Superfund sites, toxic release inventory (TRI) facilities, and other locally unwanted land uses (LULUs). Disproportionate distribution of these exposure sources causes inequities in exposure to natural disasters such as hurricanes since LULUs could release chemicals and contaminants that can exacerbate environmental injustice and increase vulnerability within communities that are susceptible to flooding. We conducted spatial analysis to examine proximity to these environmental hazards and determined the vulnerability of underserved populations in Houston, Texas, to chemical contaminants mobilized by Hurricane Harvey in 2017. Health care infrastructure (e.g., federally qualified health centers [FQHCs], hospitals, and home health centers) were also assessed as potential salutogens since Houston is home to a large concentration of industrial sites. We determined significant differences in aggregate pollutant counts between quartiles of both POC (51 sources in the lowest quartile and 217 in the highest) and people in poverty for TRI facilities (Chi-Square = 27.402, DF = 3, p < 0.001), air pollution sources (Chi-Square = 32.092, DF = 3, p < 0.001), and FQHCs (Chi-Square = 29.029, DF = 3, p < 0.001); whereas no significant differences existed for percent elderly and home health centers (Chi-Square = 4.2731, DF = 3, p = 0.2334). Essentially, low-income communities of color experience disproportionate exposure to chemical hazards mobilized by floods, and the elderly especially lack access to quality medical care. Policies should aim toward reducing exposure to environmental toxicants and targeting health care resources to under-resourced populations since differential exposure could adversely impact the health of residents.
Introduction
Across the United States, low-income populations, people of color (POC), and marginalized and disenfranchised groups bear an unequal burden from environmental hazards, including Superfund sites, toxic release inventory (TRI) facilities, petrochemical facilities, heavily trafficked roads, landfills, incinerators, and other locally unwanted land uses (LULUs). 1 Inequities in exposure to natural disasters exist within these areas as well. For example, African Americans are disproportionately located within a few states along the Atlantic coastline, and African American and Hispanic populations in Miami have been found to be differentially located in high-risk flooding zones. 2 The disproportionate burden of environmental hazards on these populations and their close proximity to areas that are susceptible to flooding combine to increase the vulnerability of these groups to natural disasters, such as hurricanes. If disturbed or physically damaged, LULUs have the potential to release chemicals and other contaminants that can lead to or exacerbate environmental injustice. 3
On August 25th, 2017, Hurricane Harvey made landfall outside Houston, Texas, as a Category 4 hurricane, bringing with it intense rainfall and wind speeds. Harvey was the most significant tropical cyclone rainfall event in U.S. history, causing severe flooding, destroying infrastructure, and submerging hazardous sites. Houston is home to a large concentration of chemical and plastic plants, oil and gas refineries, Superfund sites, and fossil fuel plants, which are often located near rivers for ease of trade. Further, these industrial sites are rarely in full compliance with the state's environmental policies, due to low rates of enforcement. 4
During Hurricane Harvey, numerous industrial facilities in Texas, including plastic and chemical manufacturers, Superfund sites, and petrochemical facilities, reported flood damage. 5 More than 42 reportable emissions events were reported in Houston between August 23rd and September 1st, 2017. 6 These facilities handle numerous hazardous chemicals, including polycyclic aromatic hydrocarbons (PAHs), volatile organic compounds, and heavy metals, which are released during emergency shutdown and start-up operations or flooding. 7 A study comparing PAH levels pre- and post-Hurricane Harvey in the Manchester neighborhood of Houston (known for hosting petrochemical plants) found an increase in PAH levels after the storm. 8 In addition, during flooding events, these compounds can interact synergistically to form more dangerous chemicals. 9
Analysis of past hurricanes, most notably Hurricane Katrina, has shown that hurricanes further exacerbate environmental injustice and health inequities. During Hurricane Katrina, many of the cities near the Mississippi River were submerged, but the hardest-hit community was the predominantly African American Lower Ninth Ward in the racially and economically segregated city of New Orleans. 10 After Hurricane Katrina, floodwater samples from numerous sites in New Orleans showed significantly higher levels of arsenic and lead in relatively low-income neighborhoods, with arsenic exceeding the drinking water standards of the United States Environmental Protection Agency (US EPA). 11
In addition to physical impacts, flooding impacts mental health, causing psychological distress, post-traumatic stress disorder (PTSD), and anxiety. 12 Exposure to arsenic, present in flood waters, has been associated with skin, lung, and bladder cancer, and it is considered an important issue in public health. 12 Human exposure to PAHs has been strongly linked to genotoxic, teratogenic, and carcinogenic effects, and PAHs have acute and chronic health effects. 13
Disparities in health outcomes in the aftermath of hurricanes also exist due to lack of targeted health care and disaster relief resources to POC, low-income populations, and people with disabilities before, during, and after hurricanes. Federally Qualified Health Centers (FQHCs) are an important health care resource for disadvantaged communities in Texas, with 77% of patients in 2016 belonging to a population of color, and 70% living at or below 100% of the federal poverty level. 14 Home health centers serve people with disabilities and elderly individuals who are highly vulnerable to natural disasters, as their dependence on caregivers, reliance on medical equipment, and limited mobility prevent them from adequately preparing for evacuation, shelter, and medical needs before and after a hurricane. 15 Assessing which populations are most at risk to the negative impacts of hurricanes, as well as the magnitude of their vulnerability, is necessary for the development and implementation of effective policies that are designed to mitigate these impacts.
In this study, we performed a spatial analysis of social, economic, and geographic vulnerabilities of overburdened populations within Houston, Texas, before Hurricane Harvey. EJSCREEN was used to highlight various environmental hazards and underlying social, economic, and health care infrastructure vulnerabilities before and after Hurricane Harvey in communities of color and low-income areas in Metropolitan Houston. We also examined differences in the impact of the hurricane by race/ethnicity, socioeconomic status (SES), and access to various health care resources post-Harvey.
Methods
EJSCREEN was used to provide descriptive statistics, and environmental and demographic indicators for Houston were examined by using EJSCREEN. POC and low-income populations were included because they are disproportionately burdened by LULUs and have fewer resources to withstand major flooding incidents. Linguistically isolated populations were included because they face communication barriers when responding to evacuation orders and obtaining resources. Populations younger than the age of 5 and older than the age of 64 rely on medical services and people who might not be available during a hurricane. Environmental variables considered in the EJSCREEN analysis included PM2.5, ozone, cancer risk, Superfund site proximity, hazardous waste proximity, traffic proximity and volume, and wastewater discharge. These indicators demonstrate the concentration of pollutants and vulnerable populations within the region and are compared with state and national averages.
ArcMap 10.5 (ESRI, Inc., Redlands, CA) was used to perform exploratory analysis on vulnerability to environmental health hazards resulting from flooding in the Houston area. Data for percent POC, poverty, and people aged 65 years and older were obtained from the 2012 to 2016 American Community Survey (ACS). 16 Demographic variables were analyzed at the census tract level, as census tracts have a smaller margin of error than block groups. POC, poverty, and age were examined for the same reasons listed earlier.
Demographic variables were divided into quartiles, mapped, and overlaid with environmental indicators, including TRI facilities, Superfund sites, brownfields, and stationary sources of air pollution regulated by the US EPA, state, and local agencies. Data on TRI facilities, Superfund sites, brownfields, and ICIS AIR were downloaded from EPA's TRI Explorer, Superfund database, ACRES brownfields dataset, and the ICIS-AIR database, respectively. 17 A Kruskal–Wallis rank-sum test and a Dunn's test were conducted in R (R Core Team, Vienna, Austria) by using the package's stats (version 3.5.1) and FSA (version 0.8.20) to establish the significance of the differences between quartiles (p < 0.05; 95% confidence interval).
This spatial analysis was repeated for home health agencies, hospitals, and FQHCs. Locations of health care facilities were downloaded from the Health Resources and Services Administration's Data Portal. 18
Results
Ejscreen Analysis
The environmental and demographic indicators confirm that there were negative environmental justice conditions in Houston pre-Harvey (Table 1). High percentile values for certain indicators (respiratory hazards, traffic proximity and volume, Superfund proximity, and wastewater discharge concentration) demonstrate that Houston has a high concentration of disadvantaged communities that are overburdened by environmental hazards compared with many U.S. cities.
EJSCREEN Analysis of Environmental and Demographic Variables in Houston, TX
EPA, Environmental Protection Agency.
Spatial analysis
Results from our analysis of the location of TRI facilities compared with % people in poverty reveal that the quartile with the lowest amount of people in poverty (0%–10.6%) had the lowest amount of TRI facilities (19) (Fig. 1a). The 2nd (10.7%–21.7%), 3rd (21.8%–34.1%), and 4th (34.2%–63.1%) quartiles had 35, 39, and 38 sites, respectively. Further, a Kruskal–Wallis rank-sum test determined a statistically significant difference between the mean TRI counts of the quartiles (Chi-Square = 29.79, DF = 3, p < 0.001). The Dunn's test revealed that the mean TRI counts of quartiles 1 and 4 (p < 0.001), 1 and 3 (p = 0.001), and 2 and 4 (p = 0.001) differed significantly from each other.

Likewise, comparing the location of TRI facilities with % POC in Houston shows an increasing number of facilities as quartiles for % POC increase (Fig. 1b). The quartile with the lowest amount of POC (8.8%–45.5%) had two TRI facilities. The 2nd (45.6%–78.3%), 3rd (78.4%–93.2%), and 4th (93.3%–100%) quartiles had 26, 49, and 54 facilities, respectively. The Kruskal–Wallis rank-sum test determined a statistically significant difference between the mean TRI counts of the quartiles (Chi-Square = 27.402, DF = 3, p < 0.001). The Dunn's test revealed that the mean TRI counts of quartiles 1 and 4 (p < 0.001), and quartiles 1 and 3 (p < 0.001) differed significantly from each other.
Comparing the location of major sources of air pollution with % people in poverty demonstrates that the lowest quartile (0%–10.6%) had the lowest number of air pollution sources (53) (Fig. 2a). Quartiles 2 (10.7%–21.7%), 3 (21.8%–34.1%), and 4 (34.2%–63.1%) contained 60, 68, and 59 sources, respectively. The Kruskal–Wallis rank-sum test determined a statistically significant difference between the mean pollution source counts of the quartiles (Chi-Square = 32.092, DF = 3, p < 0.001). The Dunn's test revealed that the mean source counts of quartiles 1 and 4 (p < 0.001), 1 and 3 (p = 0.013), 2 and 3 (p < 0.001), and 3 and 4 (p = 0.037) differed significantly from each other.
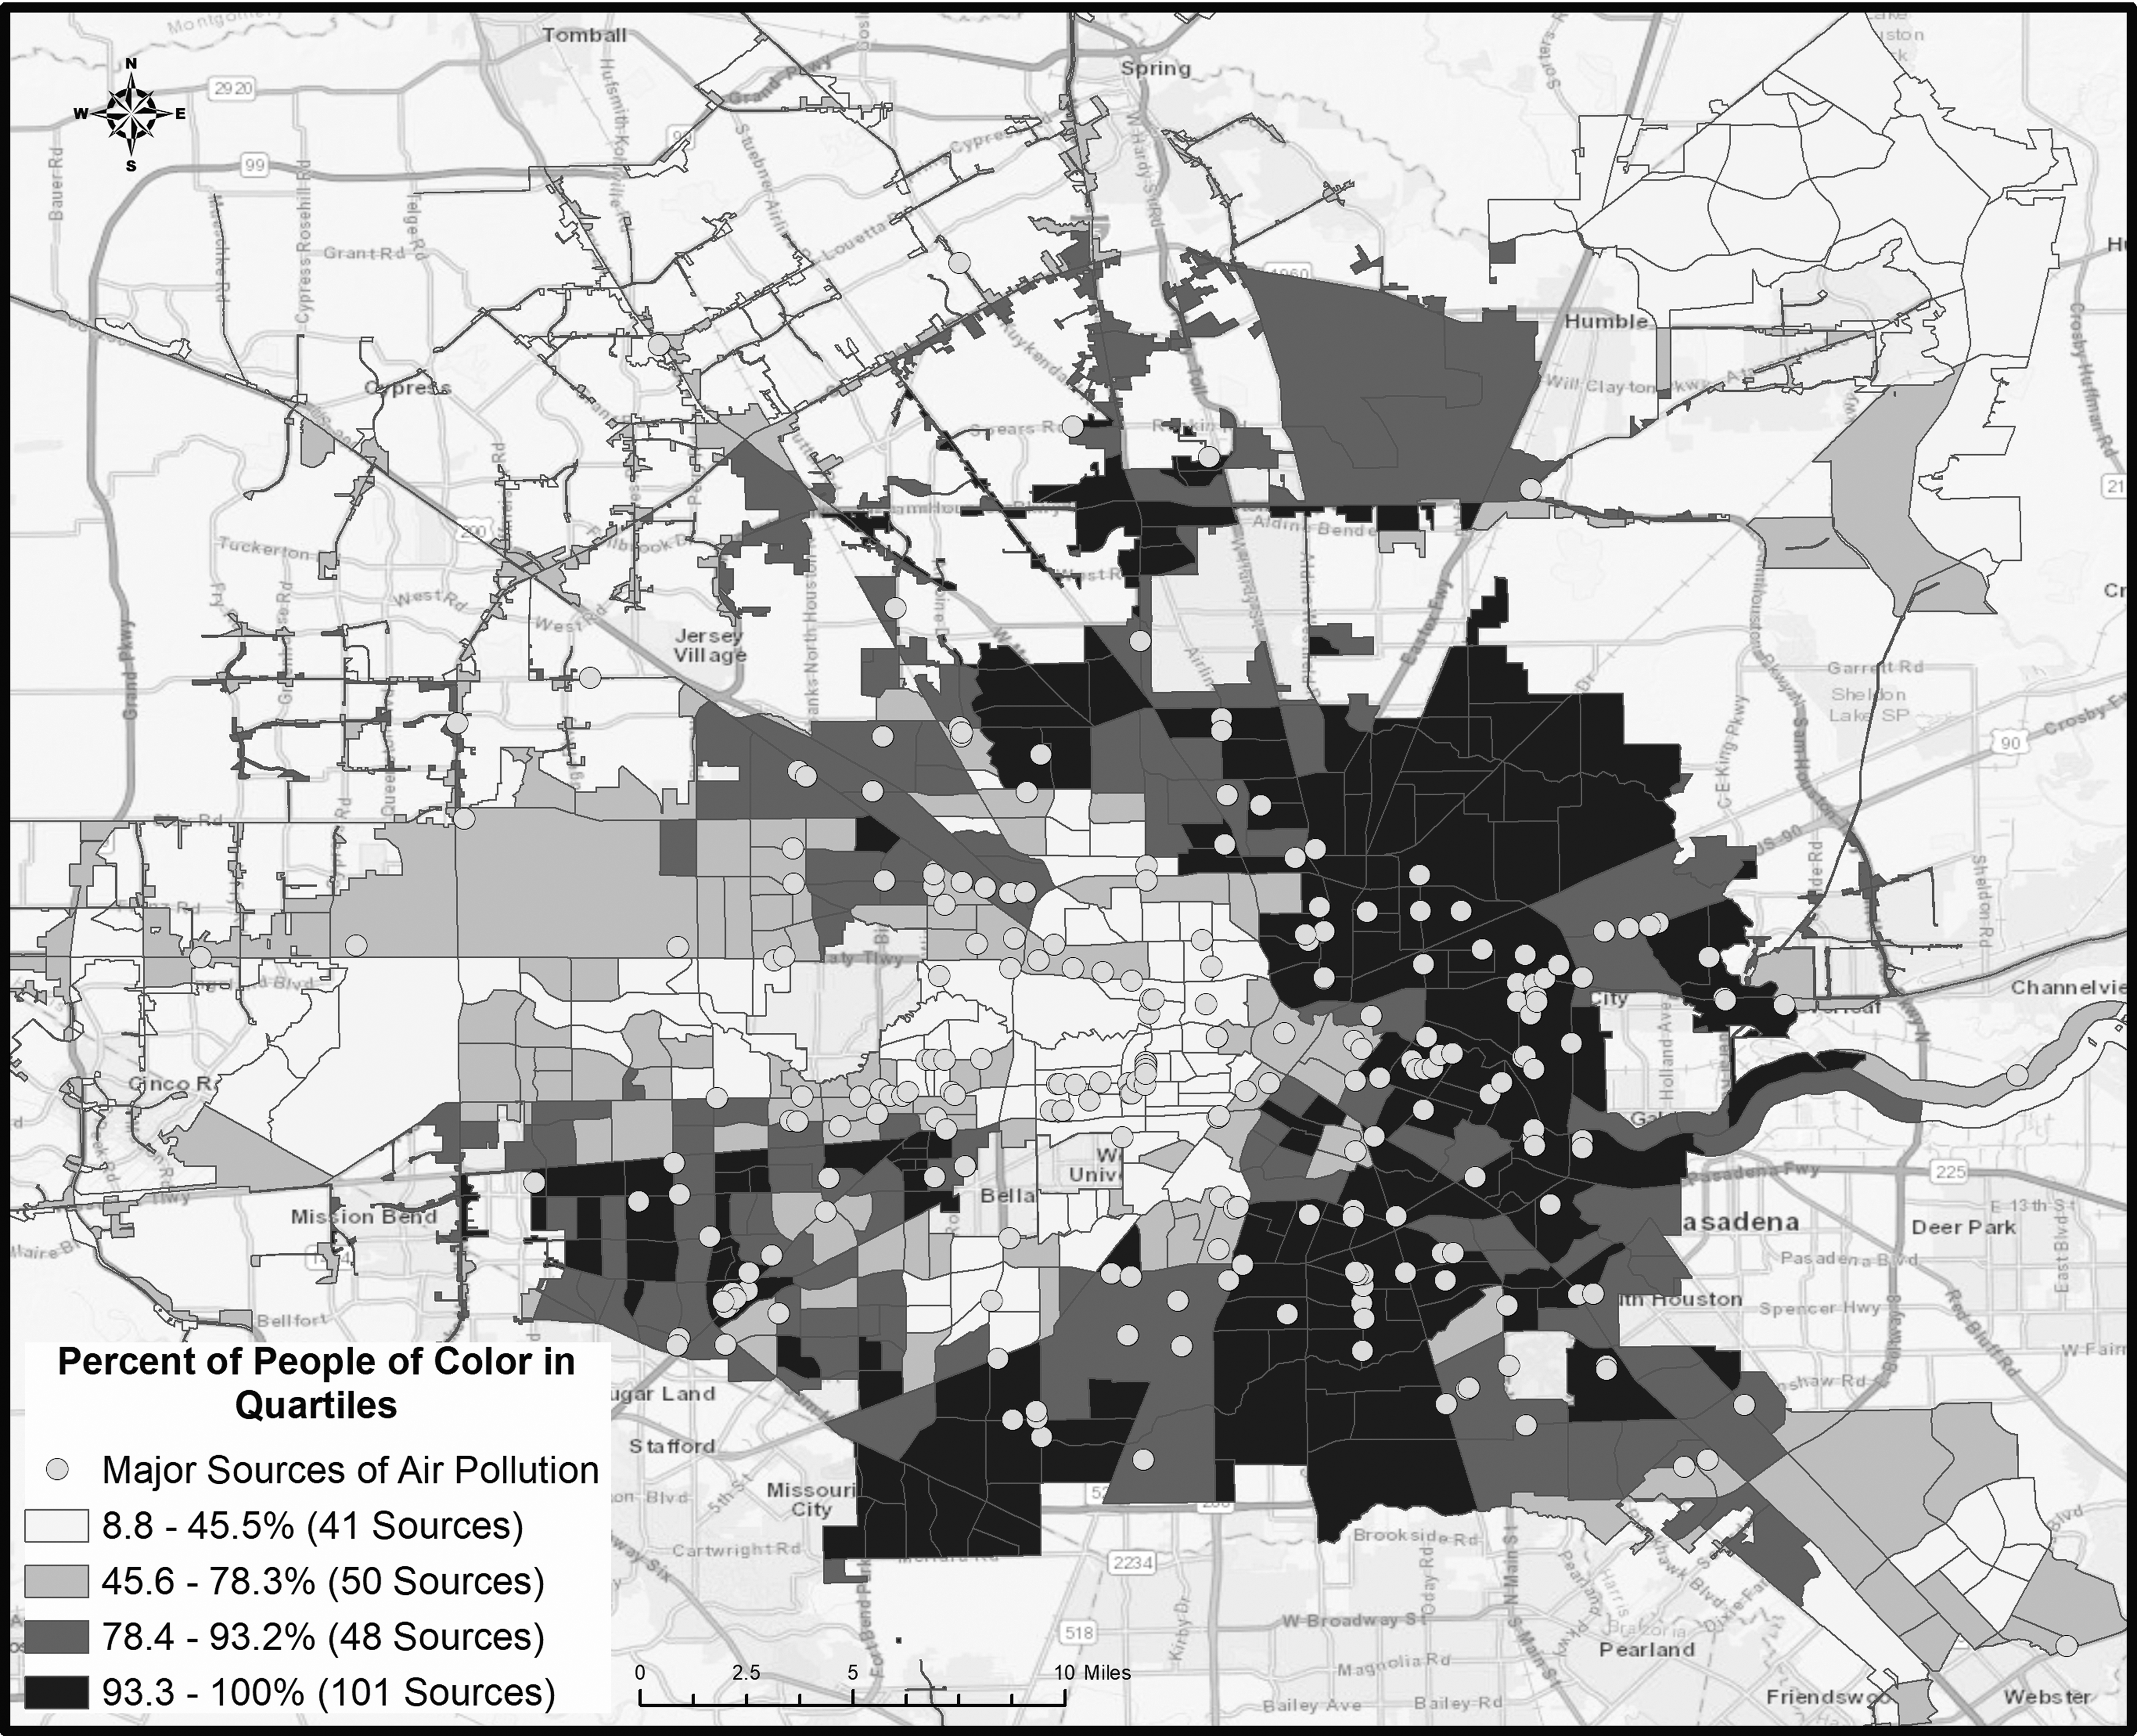
Similarly, the location of major air pollution sources compared with % POC in Houston shows that the quartile with the lowest amount of POC (8.8%–45.5%) had 40 major air pollution sources; whereas the 2nd (45.6%–78.3%), 3rd (78.4%–93.2%), and 4th (93.3%–100%) quartiles had 50, 49, and 101 major air pollution sources, respectively (Fig. 2b). The Kruskal–Wallis rank-sum test determined a statistically significant difference between the mean pollution source counts of the quartiles (Chi-Square = 21.512, DF = 3, p < 0.001). The Dunn's test revealed that the mean TRI counts of quartiles 1 and 4 (p < 0.001), 2 and 4 (p = 0.005), and 3 and 4 (p = 0.005) differed significantly from each other.
Examining the location of hospitals and FQHCs compared with % people in poverty, we find that the quartile with the lowest percentage of people in poverty (0%–10.6%) had the highest number of hospitals (21) and the lowest number of FQHCs (4) (Fig. 3a). Quartiles 2 (10.7%–21.7%), 3 (21.8%–34.1%), and 4 (34.2%–63.1%) had 26 hospitals and 16 FQHCs, 4 hospitals and 13 FQHCs, and 2 hospitals and 20 FQHCs, respectively. The Kruskal–Wallis rank-sum test determined a statistically significant difference between the mean FQHC counts of the quartiles (Chi-Square = 29.029, DF = 3, p < 0.001), but not the mean hospital counts of the quartiles. The Dunn's test revealed that the mean FQHC counts of all the quartiles differed significantly from each other for quartiles 1 and 4 (p < 0.001), 1 and 3 (.023), 2 and 4 (p = 0.001), and 3 and 4 (p = 0.037).
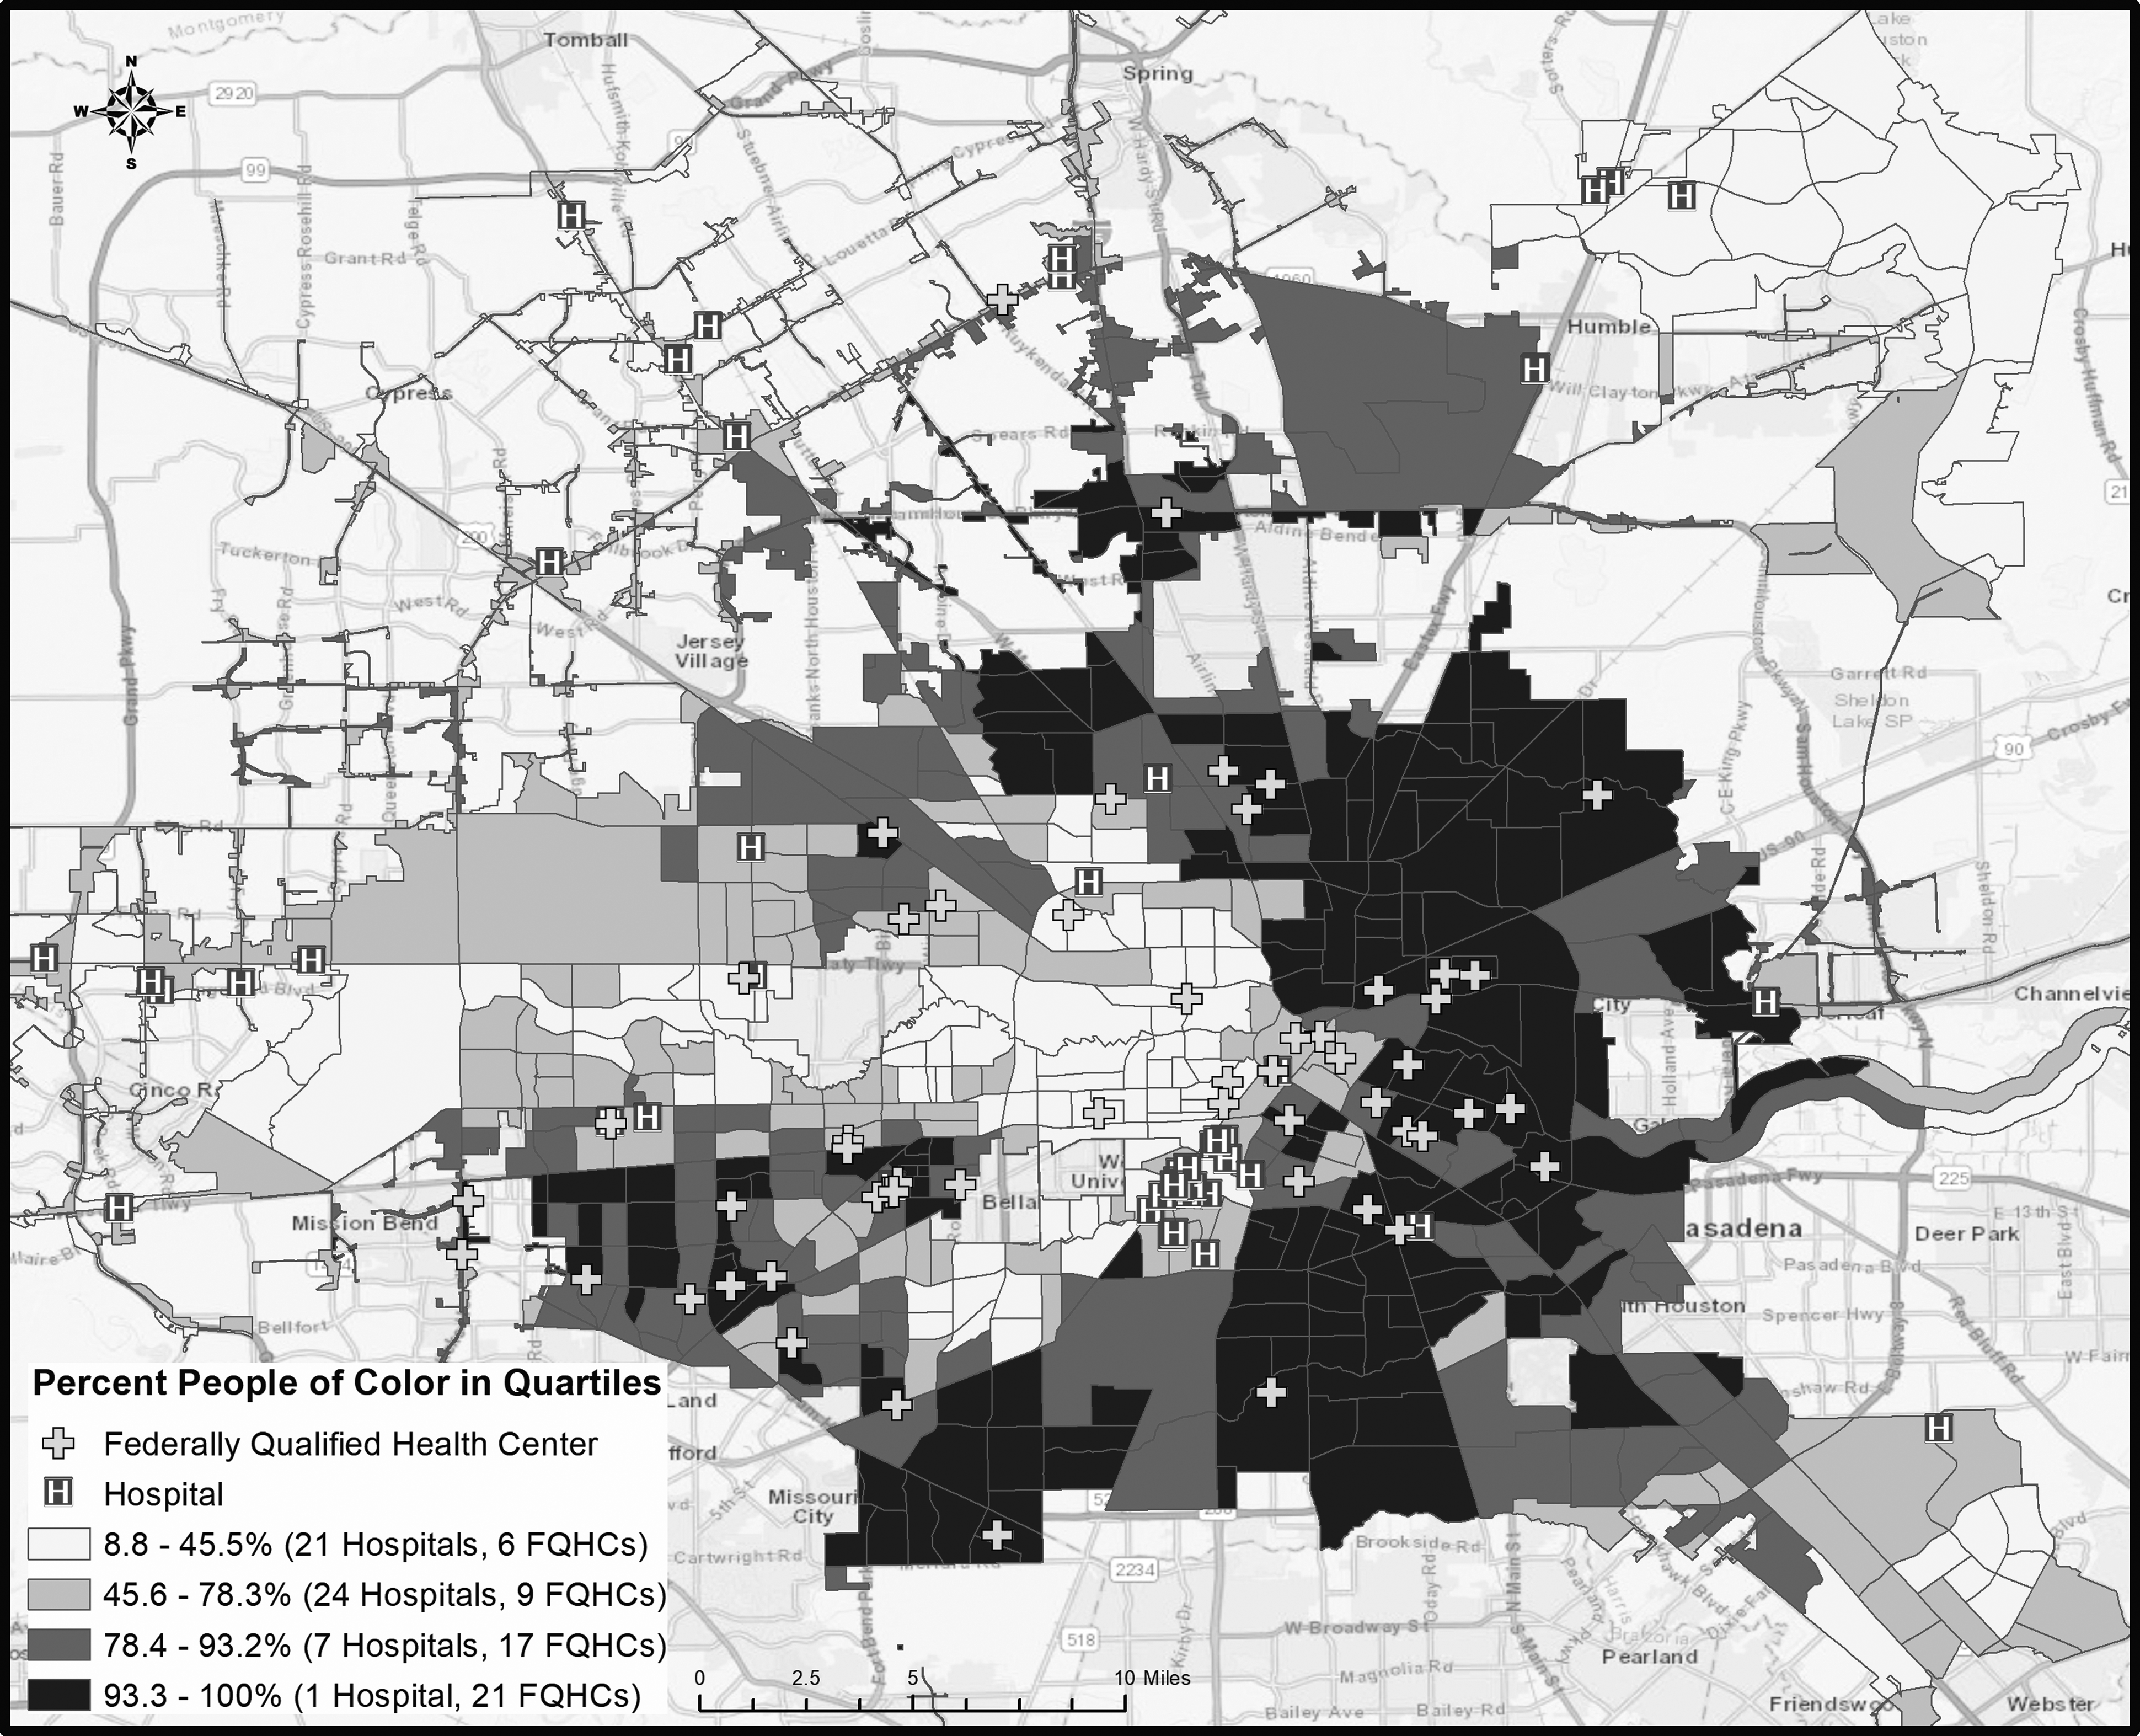
Figure 3b depicts the location of hospitals and FQHCs compared with % POC. The quartile with the lowest percentage of POC (8.8%–45.5%) had 21 hospitals and the lowest number of 6 FQHCs. Quartiles 2 (45.6%–78.3%), 3 (78.4%–93.2%), and 4 (93.3%–100%) had 24 hospitals and 9 FQHCs, 7 hospitals and 17 FQHCs, and 1 hospital and 21 FQHCs, respectively. The Kruskal–Wallis rank-sum test determined a statistically significant difference between the mean FQHC counts of the quartiles (Chi-Square = 14.441, DF = 3, p = 0.002) and the mean hospital counts of the quartiles (Chi-Square = 21.869, DF = 3, p < 0.001). The Dunn's test revealed that the mean FQHC counts of quartiles 1 and 4 (p = 0.006), and 2 and 4 (p = 0.005) differed significantly from each other, and the mean hospital counts of quartiles 2 and 4 (p < 0.001), 2 and 3 (p = 0.005), and 1 and 2 (p = 0.010) differed significantly from one another.
Analysis on the aggregate number of TRI facilities, Superfund sites, brownfield sites, and major sources of air pollution in relation to % poverty in Houston, Texas, shows that a total of 81 sources of pollution were found in the quartile with the lowest percentage of people in poverty (Fig. 4). Quartiles 2, 3, and 4 had 119, 134, and 136 sources, respectively. For the quartiles of POC, the lowest quartile had 50 sources; the second lowest had 85; the third lowest had 116; and the highest quartile had 217 sources. The Kruskal–Wallis rank-sum test determined a statistically significant difference between the mean aggregate counts of the quartiles (Chi-Square = 41.97, DF = 3, p < 0.001). The Dunn's test revealed that the mean aggregate counts of all quartiles differed significantly from each other, for quartiles 1 and 3 (p = 0.005), 1 and 4 (p < 0.001), 2 and 4 (p < 0.001), and 3 and 4 (p = 0.006). The Kruskal–Wallis rank-sum test run for percent poverty determined a statistically significant difference between the mean aggregate counts of the quartiles (Chi-Square = 46.894, DF = 3, p < 0.001). The Dunn's test revealed that the mean aggregate counts of quartiles differed significantly from each other for quartiles 1 and 4 (p < 0.001), 1 and 3 (p < 0.001), 2 and 4 (p < 0.001), 1 and 2 (p = 0.043), and 3 and 4 (p = 0.039).
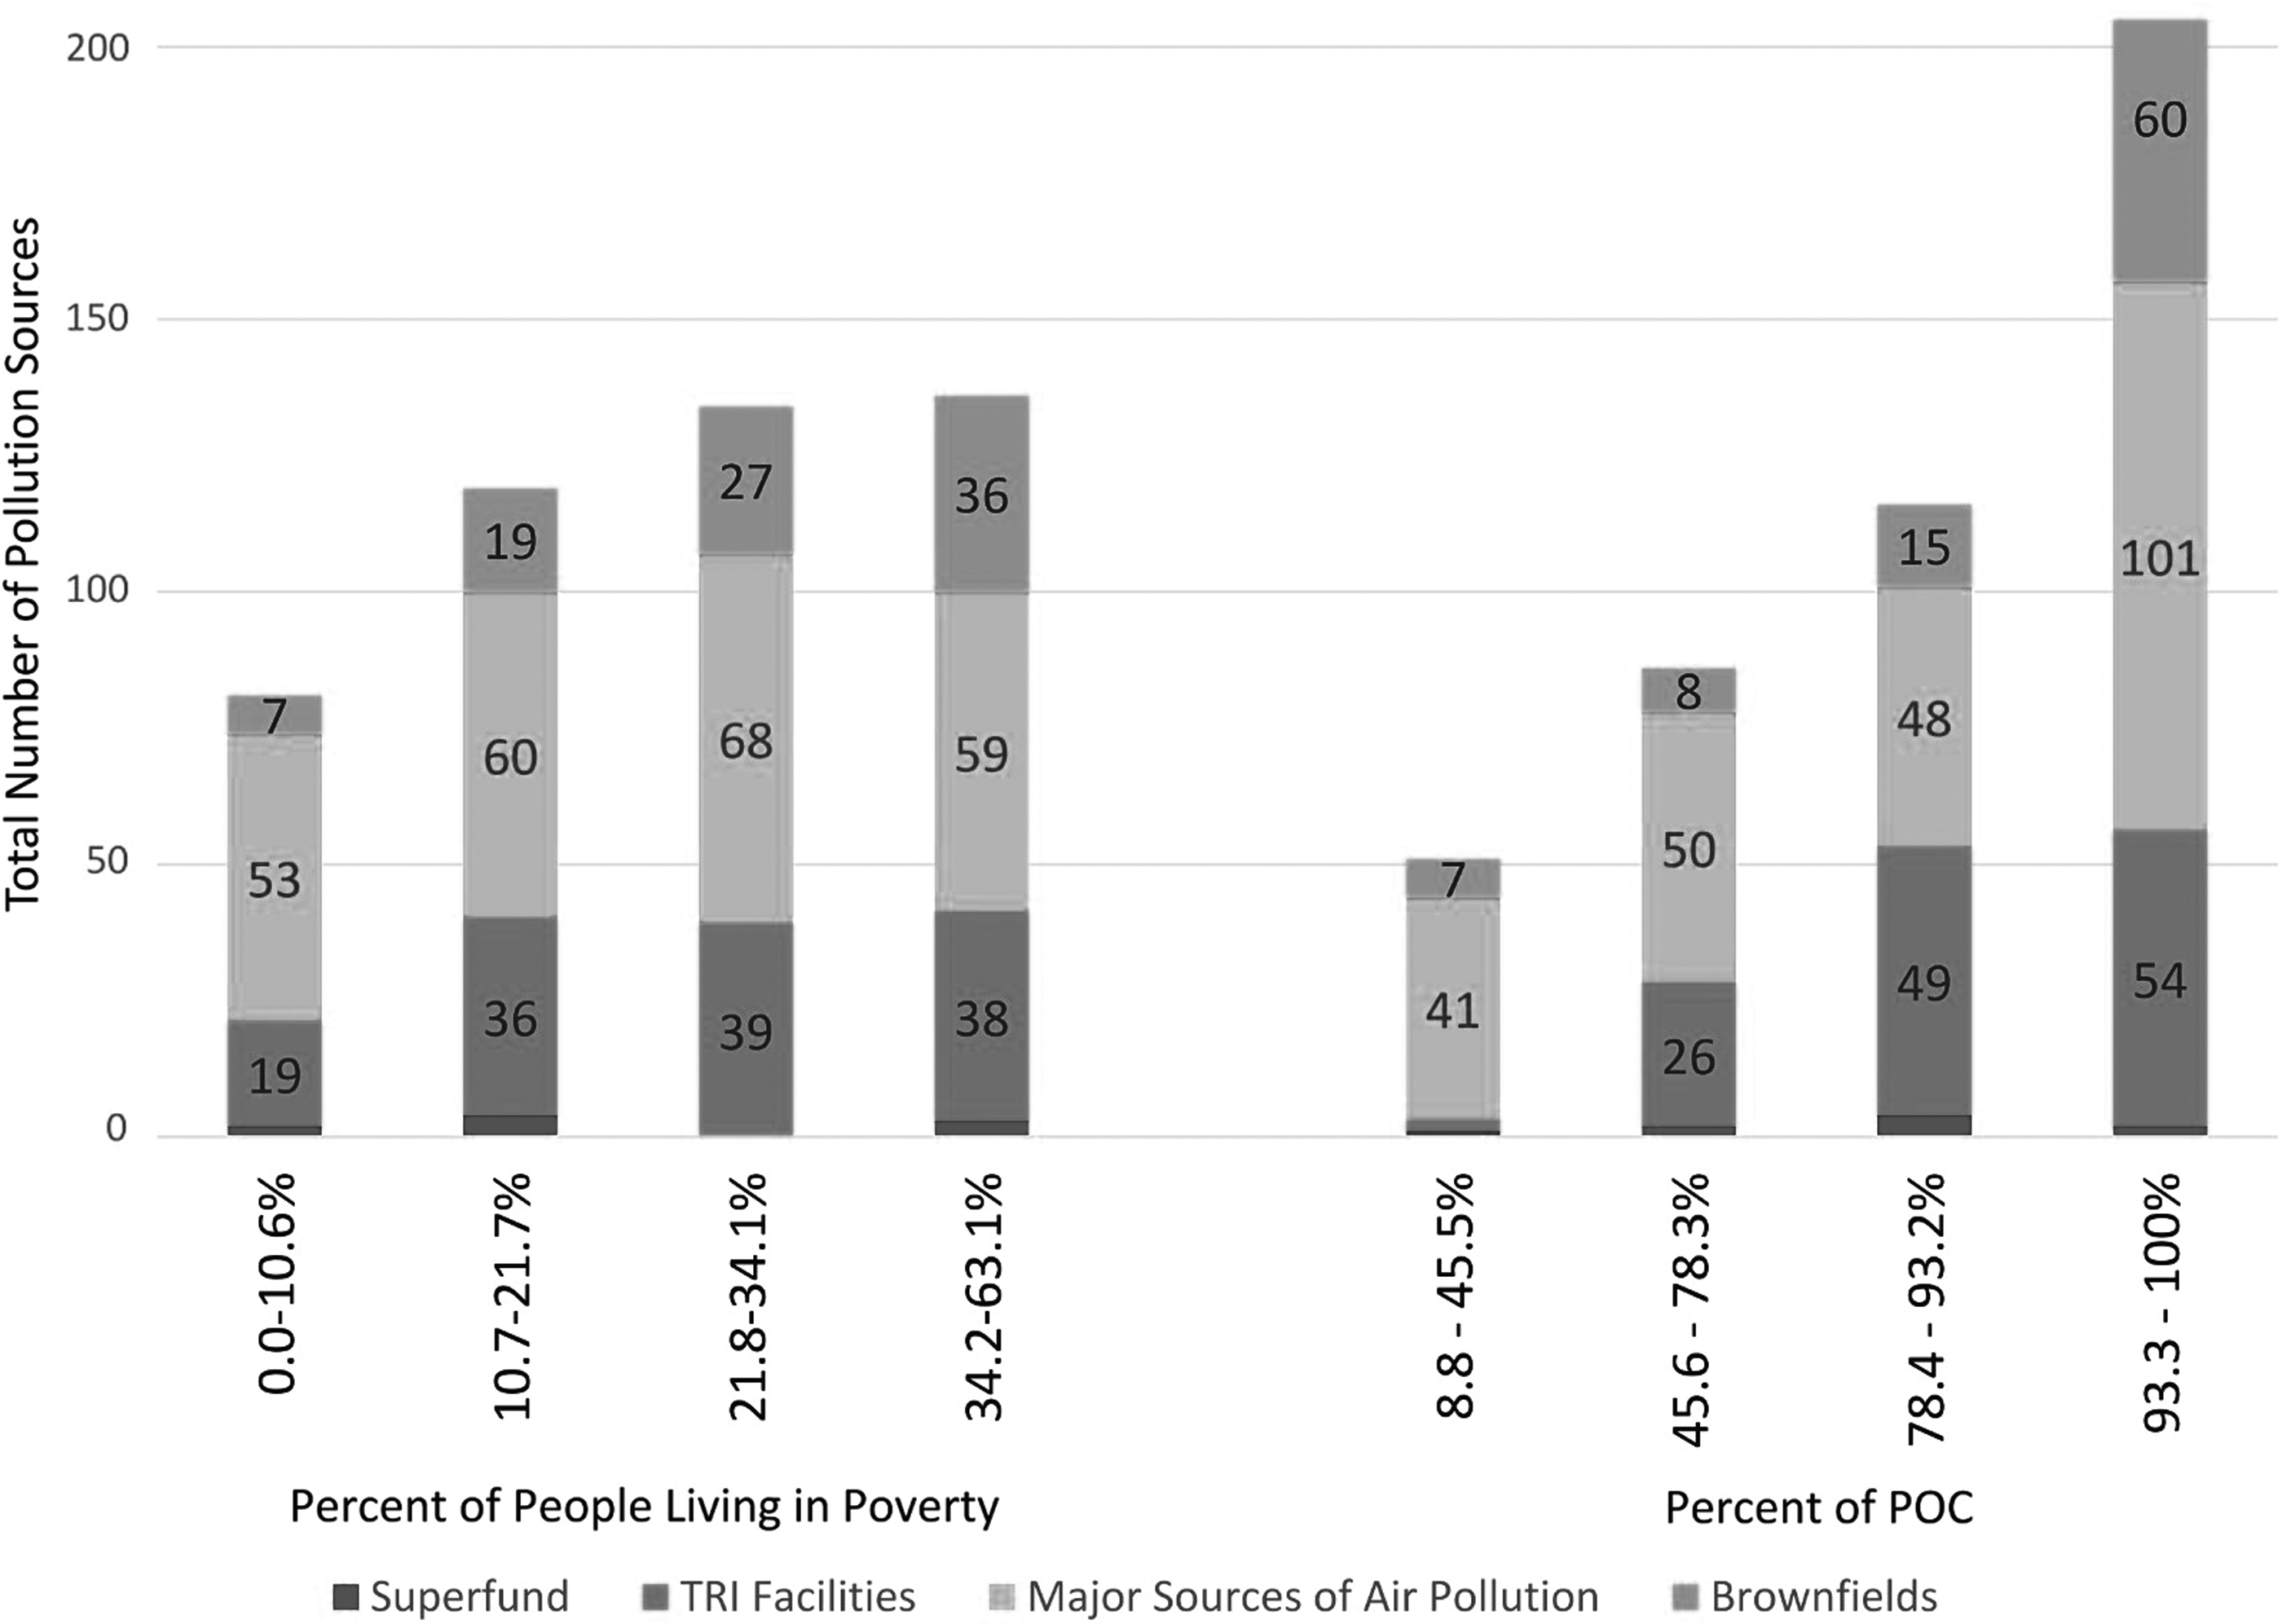
Aggregate number of environmental hazards in relation to percentage of people living in poverty and percentage of people of color in Houston, TX.
Home health agencies were found to be primarily located in the western portion of Houston (Fig. 5). Nevertheless, the distribution of individuals 65 years or older in each census tract varied widely across the area. The lowest quartile (0%–6.6%) had the highest number of home health agencies at 172. The 2nd (6.7%–9.2%), 3rd (9.3%–12.8%), and 4th (12.9%–36.1%) quartiles had 67, 80, and 37 home health agencies, respectively. The Kruskal–Wallis rank-sum test and Dunn's test determined no statistically significant differences between the mean home health agency counts of the quartiles (Chi-Square = 4.2731, DF = 3, p = 0.233). Though statistical tests find no significant differences, the differences in numbers show that, generally, the quartiles with the lowest percentage of elderly individuals had the largest number of home health centers.
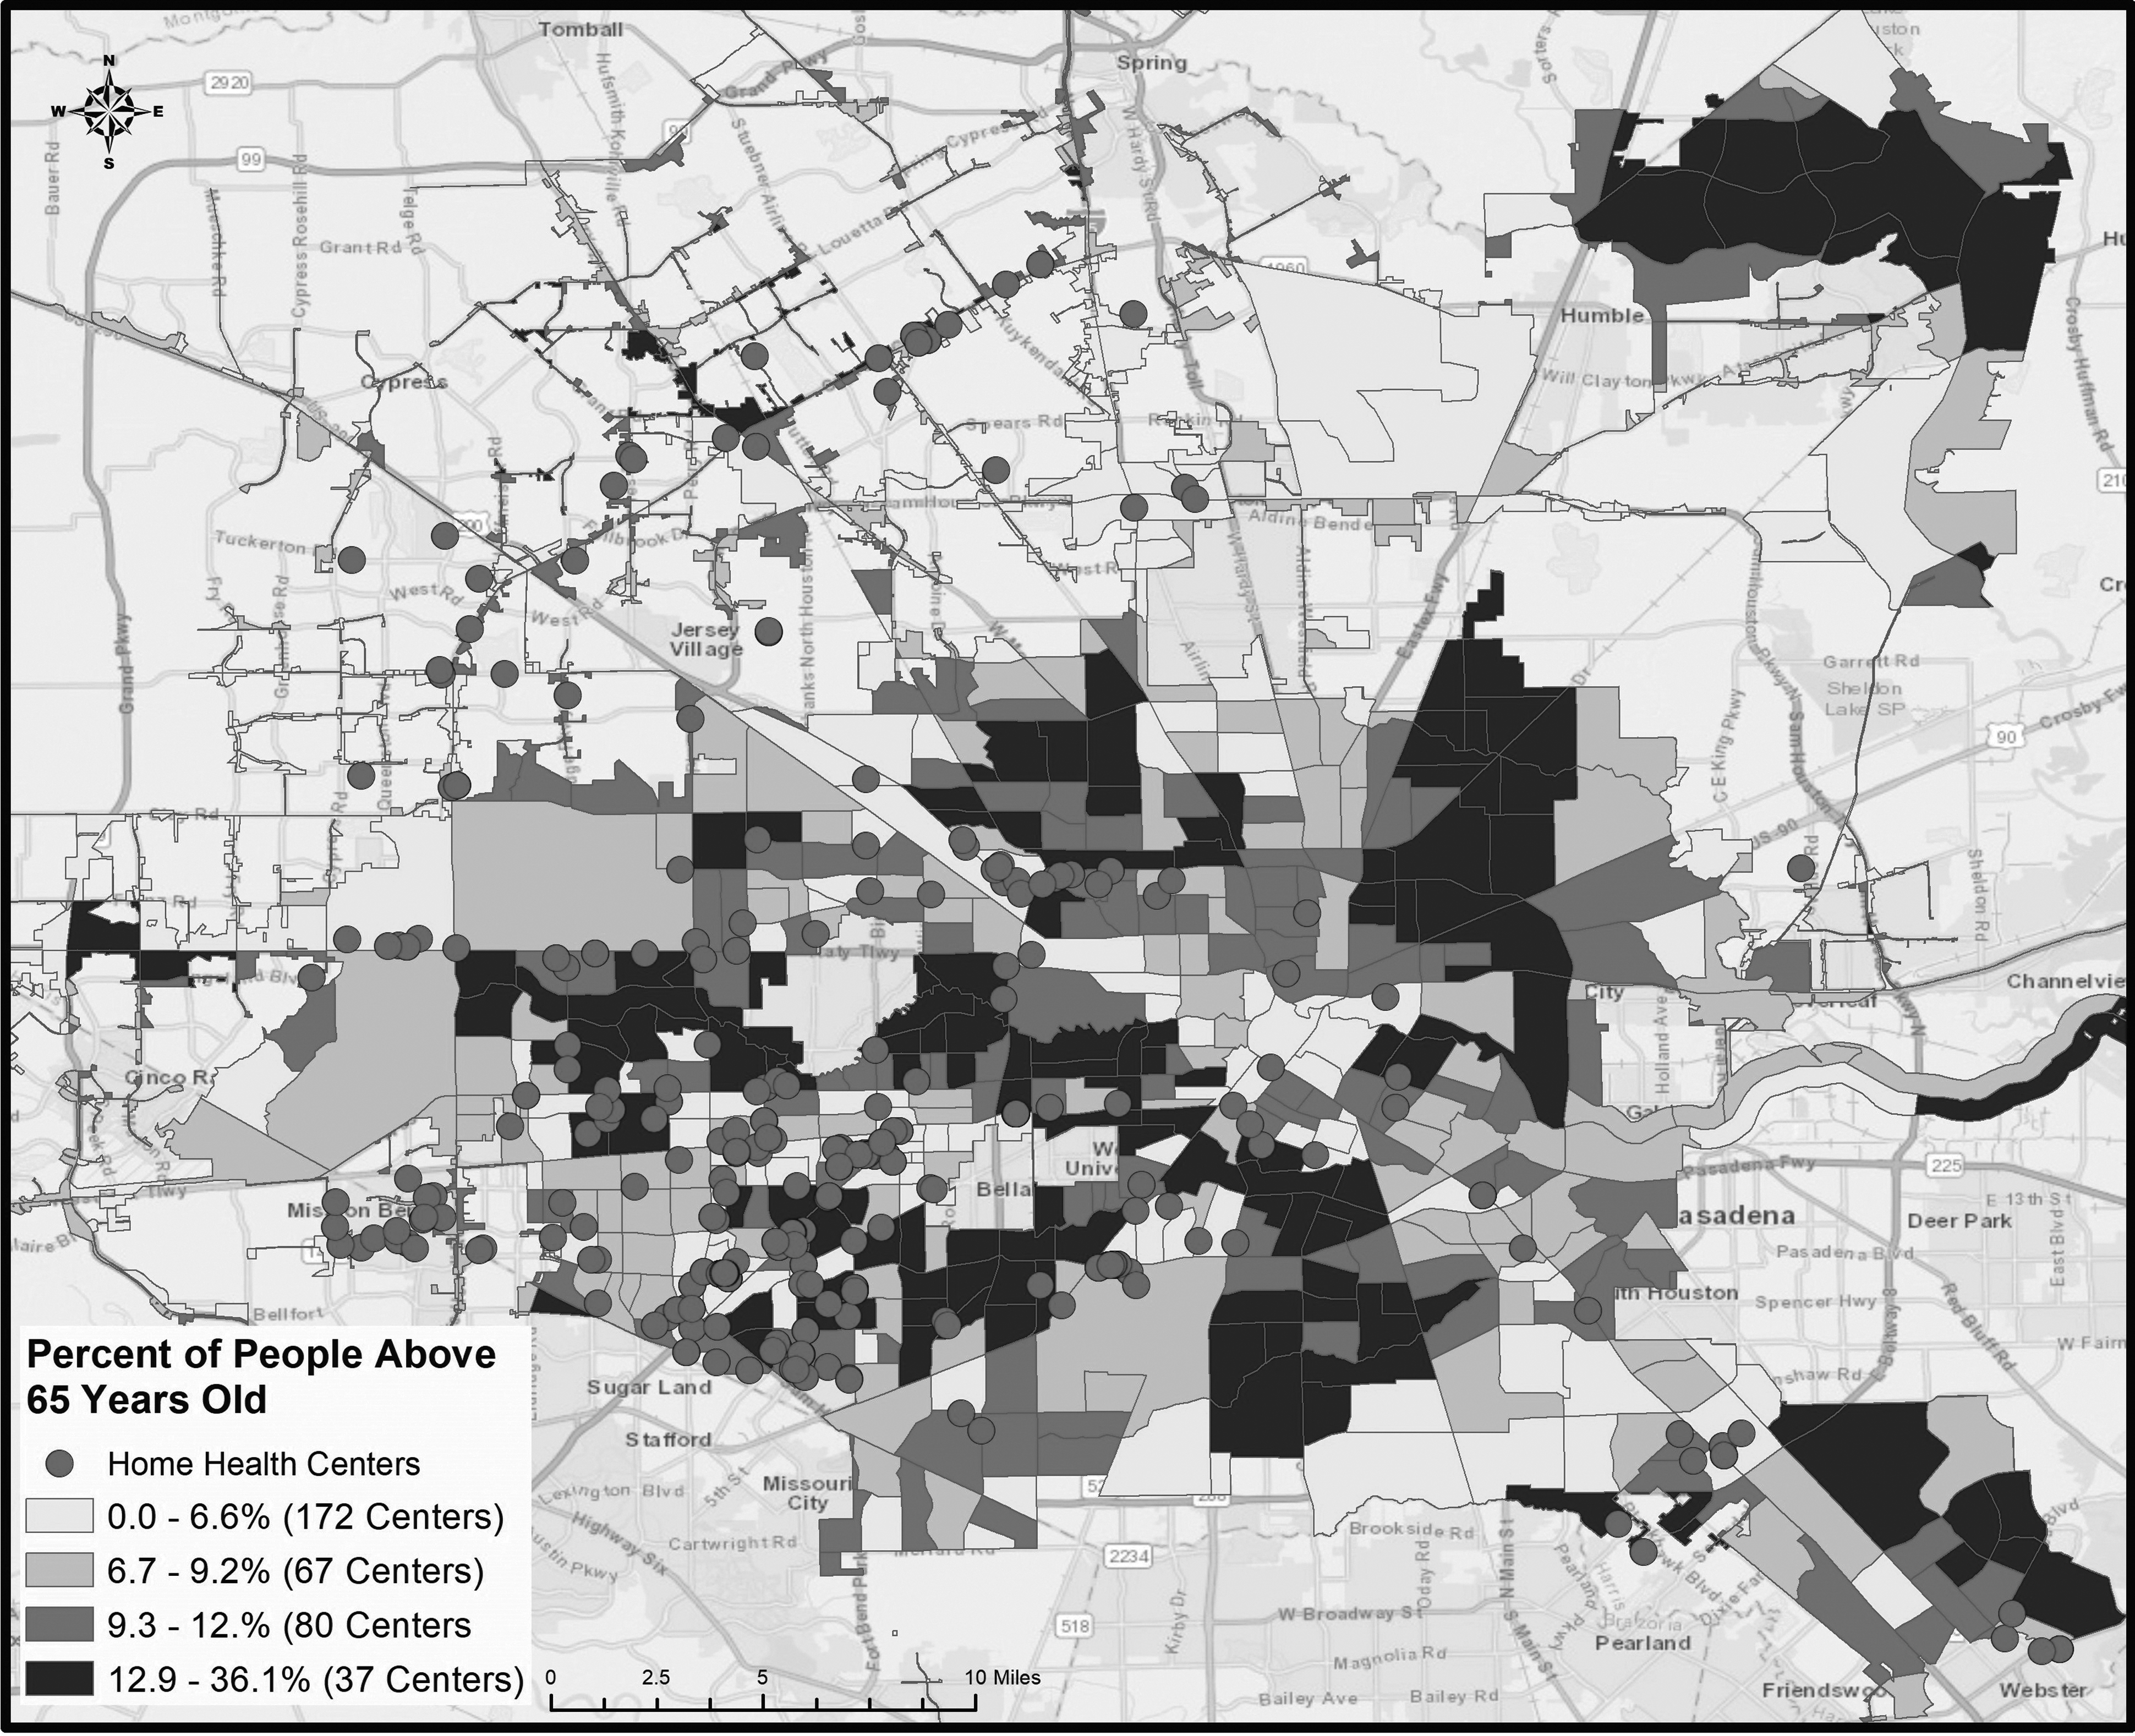
Distribution of home health care centers compared with percentage of people older than age 65 in Houston, TX.
Discussion
The impacts of natural disasters are inegalitarian in nature and have been well documented to disproportionately affect communities of color, people with disabilities, and individuals from low-income groups. 19 , 20 In Houston, areas with high numbers of individuals living in poverty also have a high density of POC (Figs. 1–3). In addition, these communities seem to experience higher environmental exposure than their White and higher income counterparts pre- and post-Harvey (Figs. 1–3). An abundance of evidence suggests that low-income populations and communities of color tend to live in areas with a higher number of environmental hazards and higher levels of pollution emitted from industrial sources. 21
Our analysis of environmental and demographic indicators in Houston corroborates previous findings established in the literature. The EJSCREEN reports indicate that a large proportion of disadvantaged residents live in close proximity to LULUs and other health hazards such as high volumes of traffic (Table 1). They also indicate that Houston has a relatively high concentration of disadvantaged communities that are overburdened by environmental hazards compared with other cities in the United States (Table 1).
As shown in Figures 1–4, a large number of TRI facilities and major sources of air pollution were located in neighborhoods with a high percentage of POC; for instance, 106 TRI facilities and 152 major sources of air pollution are located in the highest two quartiles of % POC, compared with 21 TRI facilities and 88 major sources in the lowest two quartiles. Conversely, the lowest 2 quartiles of % poverty contained 54 TRI facilities and 113 major sources, compared with the highest 2 quartiles, which contained 77 TRI facilities and 127 major sources. The release of toxic contaminants in vulnerable communities in Houston due to Hurricane Harvey has already been documented. One longitudinal study assessing samples collected in a neighborhood with EJ issues pre- and post-Hurricane Harvey found a redistribution and an increase in the concentration of PAHs after flooding. 22 Houston residents affected by the high concentration of petrochemical plants in the area were communities with high numbers of low-income residents and POC. 23 Even though these aforementioned studies support our findings, more studies examining toxicant exposure, distribution, and health impact of contaminants are needed to elucidate the relationships between hazards, race, place, vulnerability, and disasters in Houston, Texas.
In addition, the spatial distribution of health care resources in regards to race/ethnicity and SES demonstrates that low-income communities and communities of color have an abundance of access to FQHCs, but limited access to hospitals (Figs. 3a, b). Seven hospitals and 40 FQHCs were in the highest two quartiles of % POC, compared with 46 hospitals and 13 FQHCs in the lowest two quartiles. The lowest 2 quartiles of % poverty contained 47 hospitals and 20 FQHCs, compared with the highest 2 quartiles, which contained 5 hospitals and 33 FQHCs.
Despite the high numbers of FQHCs in poor and low-income areas, FQHCs operate with much smaller operating margins than hospitals, and therefore struggle with providing high-quality care to disadvantaged communities in a postdisaster context compared with hospitals. 24 Meanwhile, high-income, White communities are located closer to hospitals, and have access to higher quality care, thus contributing to health care disparities. To mitigate these access disparities, it is critical to target resources to low-income communities of color and provide equitable distribution of health care resources before and after a disaster.
In addition to health impacts caused by exposure to contaminants and distribution of health care resources during a hurricane, numerous other factors compound the issue and result in additional disparities. First, lack of flood insurance can result in catastrophic decreases in wealth, forcing people to delay retirement and declare bankruptcy. This is especially relevant, as only 17% of affected residents in Texas had flood insurance at the time Hurricane Harvey hit. 25 Moreover, POC are especially vulnerable to decreases in wealth, with the median wealth of African Americans in the United States being $11,000, compared with $141,900 for White Americans. 26 In Houston, disadvantaged communities are also disproportionately located close to flood zones, and are therefore more likely to experience damage to their homes, especially homes with structurally poor housing quality. 27 To mitigate these unequal impacts, hurricane preparedness efforts should be diverted toward improving the ability of housing in low-income, high POC areas to withstand flood events.
Exposure to toxicants and damage to personal property caused by flooding during Hurricane Harvey also had psychological impacts, with residents developing mental health symptoms and PTSD after the hurricane. 28 A study found that disaster impact is differentially associated with PTSD status among various racial groups, with African American and Latino communities being more at risk. 29 Flooding also causes oil spills, human sewage, pathogens, mold, toxic fumes, and many other differential impacts of hurricanes in areas with a history of environmental injustice.5,7,9 This, combined with inequities in economic, political, and social capital, results in inequities in health and disaster recovery. In addition, White neighborhoods are more likely to rebuild after flooding; whereas Black neighborhoods depreciate or are subject to redevelopment and gentrification, resulting in the upheaval and displacement of POC neighborhoods. 30
The cumulative effects of all of these factors intensify health inequities. The expected increase in the number of heavy rainfall events and sea level rise due to climate change will compound flooding in coastal cities such as Houston, and their disproportionate impacts on the health of low-income POC. 31
Conclusion
Our work has implications for public health and environmental justice by suggesting that low-income communities of color face disproportionate levels of vulnerability to health risks associated with hurricanes. Current policy measures related to disaster preparedness and response do little to protect disadvantaged communities. Government response to impending flooding should include increased monitoring of pollutants near sources of concern, strict enforcement of environmental laws, comprehensive zoning laws, and improved risk communication. Reducing disparate vulnerability to hazards also requires a synchronized effort between government and health care agencies to create emergency response plans and target resources to already overburdened and medically underserved populations.
Footnotes
Acknowledgments
The authors would like to acknowledge Reshma Nargund from the University of Maryland Libraries' GIS and Spatial Data Center, Lucy Kavi, and Alexis Ortiz for their assistance with the project.
Author Disclosure Statement
No competing financial interests exist.