
Abstract
A concrete block plant located in Bladensburg, Maryland, wants to expand to include a concrete batching plant on the same property. This expansion could further degrade air quality and impact the health of vulnerable residents. The purpose of this study is to provide information on particulate matter (PM2.5) levels near residential areas close to commuter traffic and industrial activity associated with the concrete plant. Air quality monitoring was conducted in Bladensburg at five sites: (1) Kingdom Missionary Baptist Church, (2) Bladensburg Waterfront Park, (3) Confluence area, (4) Bladensburg Elementary School, and (5) Hillcrest Apartment Complex using the AirBeam, a real-time sensor that can measure PM2.5 levels. Sampling was conducted in 30-minute intervals to capture morning on-peak, afternoon off-peak, and evening on-peak periods. Traffic counts were also conducted at the abovementioned sites to evaluate vehicular activity. Mean PM2.5 levels at the church (26.13 μg/m3), Waterfront Park (7.52 μg/m3), Confluence area (7.44 μg/m3) and Bladensburg Elementary School (5.92 μg/m3) were higher, compared with Hillcrest Apartments (5.36 μg/m3) during weekdays. On weekends, the mean PM2.5 concentrations ranged from 6.33 to 21.49 μg/m3. Also, the average PM2.5 levels at the church on Thursday (June 7, 2018) were 27.44, 20.67, and 11.73 μg/m3 during the morning, afternoon, and evening monitoring periods. Our results revealed spatial and temporal variations of PM2.5 levels across the sites. We observed higher mean PM2.5 levels in the morning compared with afternoon and evening. There were higher PM2.5 levels at locations closer to the concrete block plant and heavily trafficked roadways.
Introduction
Residents of urban neighborhoods are faced with industrial and traffic-related emissions of air pollutants, including particulate matter (PM). 1 PM is a composite of tiny solid and liquid particles, including chemicals, soot, and dust, all of which can be inhaled through the lungs. Also, it is distinguished by its aerodynamic diameter and there is an accumulation of evidence that links PM to various adverse health effects. 2 PM consists of diverse constituents such as nitrates, sulfates, elemental and organic carbon, organic compounds (e.g., polycyclic aromatic hydrocarbons), biological compounds (e.g., endotoxins), and metals (e.g., iron, copper). 3 Industrial PM is formed via three major routes—fuel combustion processes (e.g., furnaces, gas turbines), noncombustion processes (e.g., mechanical treatment of raw materials), and during handling, transport, and storage of dusty raw materials (e.g., cement). 4
Road traffic is an important source of PM formation via combustion of fuels (e.g., gasoline and diesel) through internal combustion engines, resulting in emissions from tailpipes. 5 Also, road traffic emissions can result from contact between vehicles and the road surface and the use of brakes, which generates PM referred to as nonexhaust emissions. 6 PM emissions from diesel engines are the major source of PM2.5, PM0.1, and PM0.05, which can be deposited deep into the respiratory tract transport to other systems and lead to various adverse health effects, including respiratory, nervous system, autoimmune disorders, and mortality. 7 Extant literature has linked exposure to PM with various adverse health effects, including increased risk of mortality from cardiovascular and respiratory illnesses, 8 increased risk of exacerbation for individuals with preexisting conditions such as diabetes on days with high PM concentrations, 9 negative birth outcomes (i.e., low birth weight and preterm births), 10 increased asthma incidents particularly among children between the ages of 5 and 17. 11
There may be variations in the temporal and spatial PM concentrations observed in a region. 12 There have been concerns about using PM concentrations recorded by a single monitoring site to estimate the exposure levels of people in an area not proximal to the monitor. However, to observe accurate and precise PM levels using the regulatory monitoring network maintained by the Environmental Protection Agency (EPA) would require having a high density of federal reference method air quality monitors, which are extremely expensive and require a lot of maintenance. 13 To address this challenge, portable, low-cost, easy-to-use air quality sensors have been developed for monitoring PM, volatile organic compounds (VOCs), black carbon, elemental carbon, and NO2. 14 These sensors can fill the need for real-time air quality data and are useful in identifying pollution hotspots and constructing PM maps in differentially burdened communities. 15 The use of low-cost sensors has led to short-term monitoring studies, which have recorded increased levels of pollution and resulted in efforts to protect public health. 16
Our study was focused on the town of Bladensburg, Maryland, which is located about 7 miles northeast of the center of Washington, DC. Residents of Bladensburg, Maryland, who are predominantly African American (65.6%) and/or Latinx (26.9%), are faced with environmental hazards because Bladensburg is an industrial corridor with a school bus depot, a trash company, a concrete block plant, other industrial facilities, and a high volume of industrial and commuter traffic. 17 Residents and business owners in the Port Towns of Bladensburg, Cottage City, Colmar Manor, and Edmonston are in opposition to the special exception permit requested by Ernest Maier to construct a concrete batching plant on its property. 18 Ernest Maier has been operating at Bladensburg since 1926. 19 Residents are organizing and working with Port Towns Environmental Action (PTEA) to ensure that the expansion does not happen. 20 They are concerned about the proximity of the plant to historic sites, which may lead to stormwater runoff, air and noise pollution, traffic congestion, thus affecting the public health and safety in their community. 21 The aim of this study was to provide data on temporal and spatial variations in human exposure to PM due to commuter traffic, industrial traffic, and industrial activities near the concrete block plant. We used low-cost PM2.5 air monitors to conduct a short-term monitoring study in Bladensburg, Maryland. We investigated diurnal patterns based on time of day and rush hour traffic by conducting air quality assessments and traffic counts during morning on-peak (rush hour), afternoon off-peak, and evening on-peak (rush hour) periods.
Methods
Community background and site selection
Bladensburg has a total area of 1.01 square miles. It shares borders with Edmonston on the north, Hyattsville on the northwest, Cottage City and Colmar Manor on the southwest, and Cheverly on the southeast. Air pollution from the location of the concrete block plant is of utmost importance because the plant is open for 6 days a week excluding Sunday. There is a school bus depot, a trash company, a concrete block plant, and high volume of industrial and commuter traffic in Bladensburg.
The concrete block plant is close to several historic sites in Bladensburg—Peace Cross, Battle of Bladensburg Memorial, Anacostia River, and Bladensburg Waterfront Park. 22 The selection of monitoring locations was driven by community concerns about additional air pollution due to the building of a new concrete batching facility on the property of the current concrete block plant, and pollution from industrial traffic and commuter traffic. We selected five monitoring locations due to their proximity to the plant (<1609 m from the facility) with the church as the closest location (about 15 m) to the plant. These locations are important sites for potential human exposures among children, adults, and the elderly (offices, residential, school, and recreational complexes). 23 Near roadway, air quality monitoring was performed because it would provide exposure information for individuals who live and work around the concrete block plant and near heavily trafficked roads. 24 The five locations selected were Kingdom Missionary Baptist Church (site 1), Bladensburg Waterfront Park (site 2), Bladensburg Elementary School (site 3), Hillcrest Village Apartments (site 4) and Confluence area (near King Pawn Auto as shown in Figure 1).
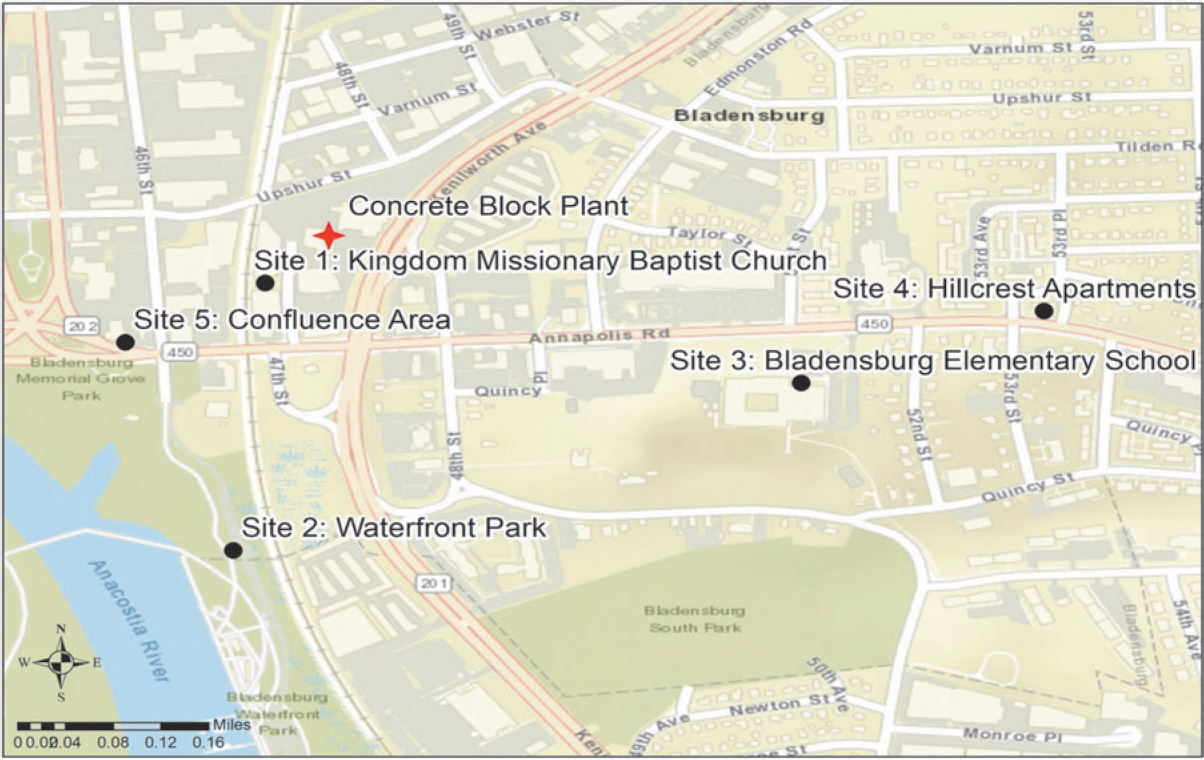
Map showing the five monitoring locations in Bladensburg, Maryland.
Environmental assessment
Air quality monitoring and traffic counts were conducted by the study personnel. Team members were trained in the operation, placement, and use of real-time monitors. Senior members of the research team provided oversight and logistical support for the project. The UMD Institutional Review Board (IRB) approved this study in March 2018.
We used low-cost, easy-to-use, portable air pollution monitors to provide high resolution data in near real-time. 25 The AirBeam sensor is a wearable air monitor that maps, graphs, and crowdsources PM2.5 exposures in real-time (1 second readings) via the AirCasting Android app. It measures PM2.5 by utilizing a light scattering method, which is registered by a detector and converted into measurements that estimate the number of particles in the air. 26 The measurements are sent through Bluetooth to the app on the Android device, which creates maps and graphs in real time on the device. At the end of the session, PM2.5 data are uploaded to the AirCasting website and crowdsourced to generate heat maps indicating where PM2.5 levels were high and low. AirBeams were worn around the necks of participants during monitoring at each location.
Air quality monitoring was conducted in June 2018. Monitoring was conducted Monday through Saturday when the facility was operating. Monitoring occurred during traffic peak and off-peak periods in a 30-minute time frame. Traffic peak times were from 7:00 am to 9:00 am (morning) and from 4:00 pm to 6:00 pm (evening), while off-peak time was between 11:00 am and 1:00 pm. Given these time frames, our monitoring was conducted from 8:30 am to 9:15 am, 11:00 am to 12:15 pm, and 4:00 pm to 5:15 pm. Weekend monitoring efforts also captured time periods when there was less commuter traffic compared with Monday to Friday when there was more commuter traffic. There were two study personnel at each monitoring location, one member of the team conducted air quality monitoring for 30-minute intervals using the AirBeam monitor, while the other conducted traffic counts. AirBeam monitors are calibrated by HabitatMap through updating the firmware on the AirCasting app when the sensor is connected to the app.
Statistical analysis
Box plots were used to display the descriptive statistics (minimum, first quartile, median, third quartile, and maximum) at the five locations at different times of the day to assess the spatial and temporal variations in PM levels. The data collected were analyzed using SAS Enterprise Version for Windows 9.3. Data obtained from traffic counts were categorized into weekdays (Wednesday and Thursday) and weekends (Saturdays). Traffic counts recorded were expressed as the mean counts of cars and trucks observed on the weekdays and weekends. The results of the traffic counts and the U.S. EPA's environmental justice (EJ) screen analysis can be found in our previous publication. 27
Results
Demographic analysis
There are 9148 people in Bladensburg, 53.1% were female, while 46.9% were male. 28 African Americans account for 65.6% of the population, while Hispanics were 26.9% of the population. In Maryland, 29.4% are African American, while 8.2% of the population are Hispanics. The demographics of Bladensburg has been discussed in detail with a table, which can be found in our previous publication. 29
Box plots for PM
Descriptive statistics were calculated on the observed PM2.5 concentrations at the five locations on six monitoring as shown in Figure 1. These were represented in box plots that display the distribution of observed data (Figs. 2–4). Box plots were calculated with 1800 measurement values (the AirBeam measures every second, and monitoring was conducted for 30 minutes, i.e., 30 × 60 = 1800).

Box plots of real-time PM2.5 concentrations at the five locations obtained during the morning shift on the 6 days on which monitoring occurred [
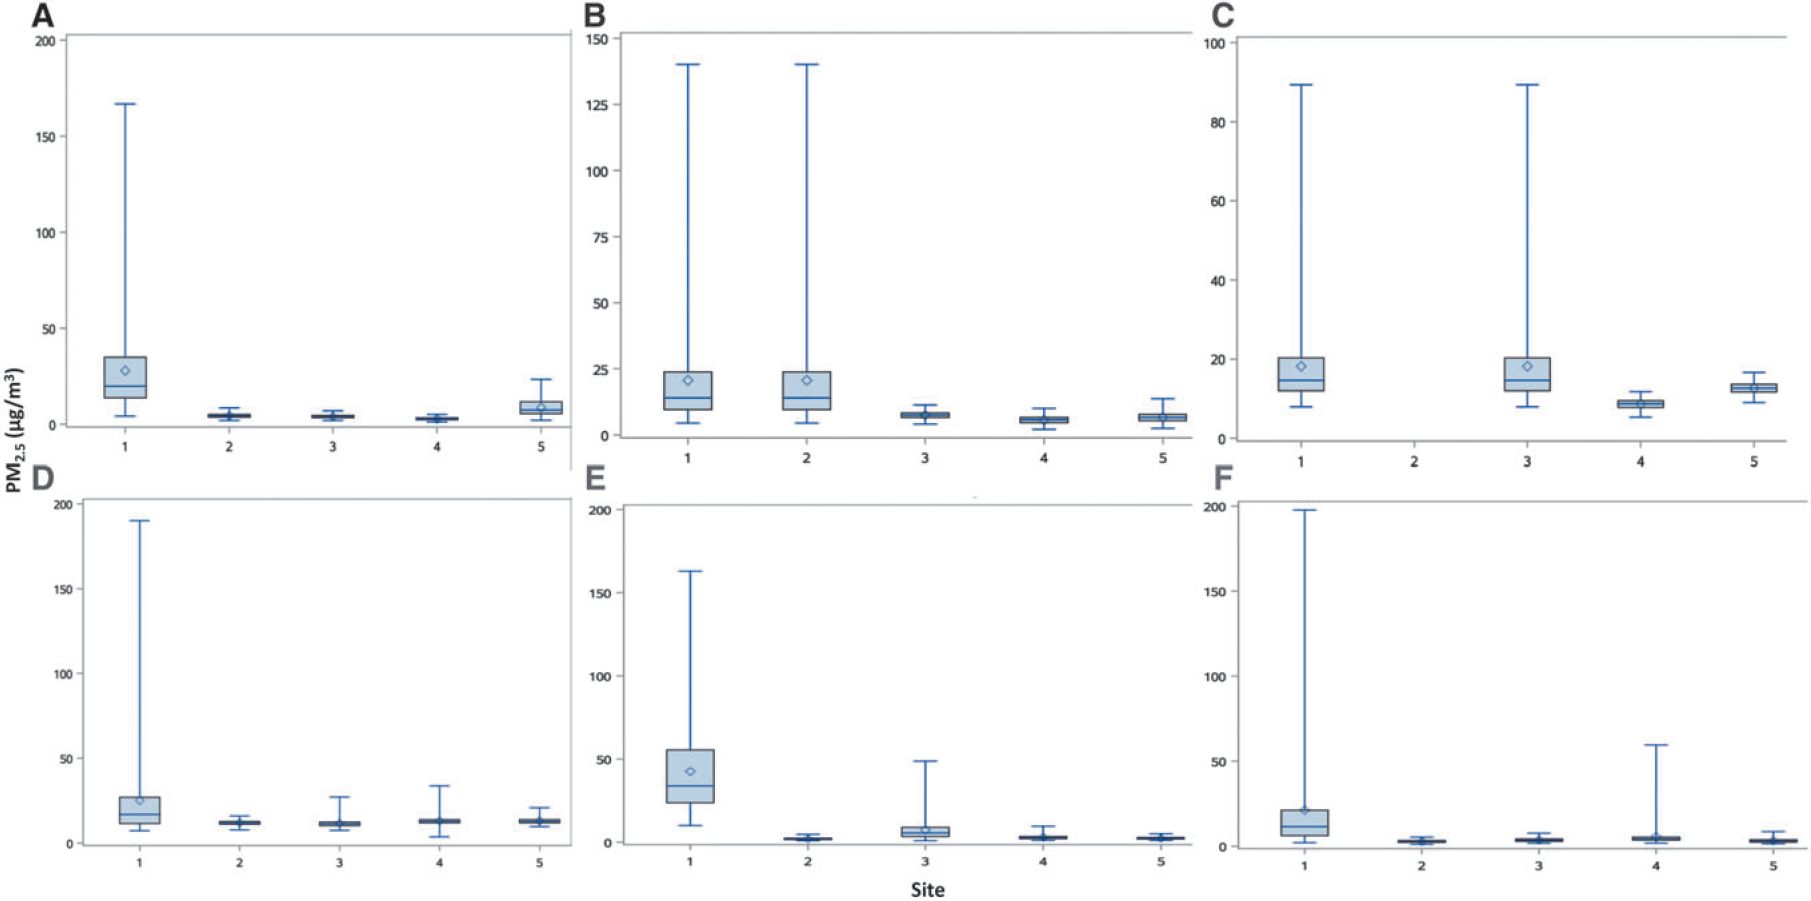
Box plots of real-time PM2.5 concentrations at the five locations obtained during the afternoon shift on the 6 days on which monitoring occurred [

Box plots of PM2.5 concentrations at the five locations obtained during the evening shift on the 6 days on which monitoring occurred [
The box plots shown in Figure 2 are the measurements recorded in the morning on the 6 days that monitoring occurred at the five locations. We observed that the levels recorded at site 1 (Kingdom Missionary Baptist Church) had the highest median (22.67 μg/m3), interquartile range (48.48 μg/m3), and maximum (195.93 μg/m3) values in the morning compared with other locations. However, on Thursday (June 7, 2018), the values at site 1 and site 2 (Waterfront Park) appear to be similar. The increase in PM2.5 concentrations at the Waterfront Park may be attributed to the activity at the park, in which various high school students had a sporting activity. Based on this box plot, it may be inferred that PM2.5 concentrations are higher during the morning period at Kingdom Missionary Baptist Church due to the activities of the concrete block plant.
The box plot of PM2.5 concentrations observed in the afternoon on the six monitoring days at the five locations is displayed in Figure 3. We observed that site 1 had the highest median (33.85 μg/m3), interquartile range (31.79 μg/m3), and maximum (197.67 μg/m3) values compared with other locations. Also, the plots show that on Thursday (June 7 2018) and Saturday (June 9, 2018), site 2 (Waterfront Park) and site 3 (Bladensburg Elementary School) had similar values to site 1. The increased levels at site 1 may be related to traffic for a sporting event while monitoring occurred at the Waterfront Park. However, we could not link the spike in observed PM2.5 levels at Bladensburg Elementary School to any activities (such as construction) close to the school.
The box plots in Figure 4 are the measurements recorded in the evening at the five sites on the six monitoring days. The measurements recorded at site 1 were higher than the other four locations. However, on Thursday (June 7, 2018), we observed that the readings at site 2 were similar to those at site 1. The observed increase in PM2.5 levels at the park on Thursday may be due to a sporting activity at Waterfront Park. Also, the readings on Saturday (June 9, 2018) at site 3 and site 4 (Hillcrest Apartment) were similar to readings observed at site 1. However, the readings observed on Saturday (June 9, 2018) at site 1, site 3, and site 4 were not higher than 15 μg/m3 and we observed that the concrete block plant closed at 12 pm on Saturdays. The maximum PM2.5 concentration observed at site 1 on Saturday (June 9, 2018) (<12.5 μg/m3) was lower compared with the maximum values (125–150 μg/m3) recorded on other days.
We compared the average PM2.5 concentrations observed on the days monitoring occurred. Average PM2.5 levels observed at the church were 28.87 μg/m3 on Wednesday (June 6, 2018) compared with 28.36 μg/m3 on Wednesday (June 13, 2018). This may mean that the average PM2.5 levels recorded on both Wednesdays were not different. The highest mean PM2.5 levels were recorded at the Kingdom Missionary Baptist Church of 33.91 μg/m3 on Thursday (June 14, 2018) compared with 27.44 μg/m3 (Thursday June 7, 2018). The mean PM2.5 levels recorded on Saturday were 27.74 μg/m3 (June 9, 2018) and 46.71 μg/m3 (June 16, 2018) at Kingdom Missionary Baptist Church. Also, the maximum values of PM2.5 concentrations obtained at Kingdom Missionary Baptist Church were 188.44 μg/m3 (Wednesday June 6, 2018), 153.95 μg/m3 (Thursday June 7, 2018), 190.06 μg/m3 (Wednesday June 13, 2018), and 162.91 μg/m3 (Thursday June 14, 2018). On Saturdays, the maximum PM2.5 levels observed at Kingdom Missionary Baptist Church were 133.9 μg/m3 (June 9, 2018) and 197.67 μg/m3 (June 16, 2018). In most cases, the mean PM values for each day at the church were lower than 35 μg/m3 (the daily PM2.5 standard), but higher than 12 μg/m3 (the annual PM2.5 standard). However, maximum values collected at the church for each day were above both the daily and annual PM2.5 standards.
Overall, the plots reveal that the Kingdom Missionary Baptist Church had the highest maximum values (197.67 μg/m3) recorded during the morning, afternoon, and evening periods compared with other monitoring locations. This could infer that PM2.5 levels are higher at or near the concrete block plant. Also, the box plots show that there were temporal variations of PM2.5 concentrations across the monitoring locations.
Discussion
Thirty-minute average PM2.5 concentrations observed during the weekdays and weekends in Bladensburg highlight the spatial variations of PM2.5 across the monitoring sites. We recorded daily 30-minute mean PM2.5 concentrations that ranged from 2.07 to 46.71 μg/m3 across the five locations. Average PM2.5 concentrations recorded during weekdays ranged from 5.36 to 26.13 μg/m3; while on weekends, it ranged from 6.33 to 21.49 μg/m3 across the various sites.
Our findings reveal that PM2.5 levels were generally higher at the church compared with other monitoring sites. We observed a maximum PM2.5 level of 197.67 μg/m3 at the church. This may be due to its proximity (<15 m from the concrete plant), use of vehicles at the plant that combust diesel fuel, and diesel truck trips/day in and out of the facility. Also, the concrete block plant had aggregates (sand, gravel) that were stockpiled in the open without covers. These could be dispersed by the wind as fugitive dust emissions causing an increase in the levels of PM in the ambient air.
We observed temporal differences in PM2.5 levels across the sites. At Kingdom Missionary Baptist Church, we observed high 30-minute mean PM2.5 concentrations in the morning, which decreased in the afternoon and evening monitoring periods. 30 For example, the mean PM2.5 levels at the church on Thursday (June 7, 2018) were 27.44, 20.67, and 11.73 μg/m3 during the morning, afternoon, and evening monitoring periods. The average PM2.5 levels recorded at the Waterfront Park on Thursday (June 7, 2018) were 9.39, 7.6, and 4.06 μg/m3 in the morning, afternoon, and evening periods. This trend was consistent with the measurements recorded during the weekend. Mean PM2.5 levels on Saturday (June 9, 2018) at the church were 27.74 μg/m3 in the morning, 18.18 μg/m3 in the afternoon, and 7.02 μg/m3 in the evening. Also, at the park on Saturday (June 9, 2018), the mean PM2.5 levels were 11.14, 8.66, and 7.82 μg/m3 in the morning, afternoon, and evening, respectively. We can infer that proximity to the concrete plant, proximity to traffic, and time of day may be drivers of spatial and temporal variations in PM2.5 levels.
Other studies have illustrated how industrial sources can emit PM and impact air quality. One study recorded morning 30-minute mean PM2.5 levels of 46.2 and 21.6 μg/m3 during the summer and winter months near a steel plant near Braddock, Pennsylvania. 31 In Louisiana, after the Deep Water Horizon spill, the mean PM2.5 concentrations recorded during regional, stationary urban, and coastal monitoring were 22.3, 9.68, and 17.33 μg/m3, respectively. 32 In Northeastern Oklahoma, the mean PM2.5 concentrations of 11 μg/m3 were observed at a mine waste site. 33
In addition, PM concentrations may increase around areas due to industrial truck traffic. 34 In Detroit, PM2.5 levels averaged 16.8 μg/m3 in a study that used time-series and simulation models to estimate vehicle contributions to pollutant levels near roadways. 35 Another Detroit-based study revealed that traffic and industrial plants were major sources of PM. 36 A study conducted in Harlem, New York, recorded mean PM2.5 levels that ranged from 26.5 to 53.5 μg/m3, which revealed that local diesel truck traffic may influence PM2.5 concentrations. 37 In South Bronx, New York, the mean outdoor school-site PM2.5 concentrations were 14.3 μg/m3, which were associated with vehicle traffic around the school on weekdays and proximity to roadways. 38 A study conducted in Newark, New Jersey, to demonstrate the effect of TRAP on PM2.5 concentrations in an urban area recorded mean PM2.5 levels that ranged from 4.75 to 11.1 μg/m3. 39 In North Charleston, South Carolina, a study that measured PM levels before port expansion recorded annual average PM2.5 concentrations that ranged from 11.0 to 13.5 μg/m3. 40
People of color and economically disadvantaged individuals are more likely to live in highly trafficked areas and near environmental hazards, which may result in an increased risk of adverse health outcomes, such as cancer. 41 Communities of color were observed to have higher pollution exposures and were twice as likely to live in the most polluted counties than whites. 42 For example, our EPA EJ screen analysis revealed that 53% of the population were low income who live within a 1-mile radius of Bladensburg are exposed to an average annual daily traffic count of 1500 vehicles. A study conducted in Hunts Point, New York, revealed that increased concentrations of elemental carbon (∼2.6 to 7.3 μg/m3) were found at intersections and varied due to large truck traffic. 43 In Wilmington and western Long Beach, adjacent to the Ports of Los Angeles and Long Beach, California, the volumes of heavy-duty diesel trucks were as high as 400 to 600 trucks per hour for several hours around sensitive land use areas, such as schools, parks, and residences. 44 In North Charleston, South Carolina, a study that measured PM levels before the port expansion recorded PM2.5 measurements that ranged from 3.4 to 28.3 μg/m3. 45
In the future, we will develop a hyperlocal monitoring network using stationary monitors. Unfortunately, the three closest EPA monitors are 11, 22, and 25 miles away from Bladensburg. 46 The use of stationary monitors will ensure that air quality monitoring would be conducted year-round at more locations to better capture spatial and temporal (including seasonal) variations in PM levels in the study area. The development of a hyperlocal network would expand the scope of our research to PM10, PM1, VOCs, and NOx. We also plan to build a data platform that will consolidate demographic, environmental health, and air quality data into maps and reports, which will focus on identifying disadvantaged groups 47 and providing near real-time data to inform risk aversion behaviors and risk mitigation activities. Electronic traffic counts will be conducted to capture the high diesel truck traffic that occurs during the early part of the day near Kingdom Missionary Baptist Church, which is the closest site to the concrete block plant.
Conclusion
This study revealed spatial and temporal variations in PM2.5 levels in Bladensburg and provided preliminary information on residential exposure to PM2.5 due to commuter traffic, industrial traffic, and industrial activities associated with the concrete block plant. Our study utilized low-cost air quality sensors to provide localized air pollution data. The localized air pollution data will help to identify pollution hotspots as the foundation for more intensive exposure research in Bladensburg and other communities in Prince George's County impacted by stationary pollution sources, and heavy industrial and commuter traffic. Our work in Bladensburg has improved knowledge and understanding of residential PM2.5 exposures among economically disadvantaged individuals; however, we plan to monitor for longer periods of time and at more locations in the future. The expansion of the concrete block plant may boost economic development by providing additional jobs and tax revenue for the community. However, based on our findings, the expansion of the plant may further degrade local air quality due to the high PM2.5 levels observed at locations close to the concrete plant. The expansion of the plant may produce externalities that lead to more social, economic, and health costs for nearby residents. These findings were shared with County officials. Our partnership and findings were instrumental in a recent decision on March 25, 2019, by the County council to not give a special exception to the concrete block plant. 48 We feel that this project and collaboration are an example of how community-driven research can be translated to action and positive social change.
Footnotes
Acknowledgments
We acknowledge the assistance and the participation of the residents of Bladensburg, Port Towns Environmental Action (PTEA), B5 Initiative, and other local and statewide community stakeholders. We truly appreciate their contribution. We also send special thanks to student interns who assisted with the project.
Author Disclosure Statement
No competing financial interests exist.
Funding Information
No funding was received for this article.