




Abstract
Breathing healthy air is one of the most basic rights of human societies. Air pollution is currently one of the main global environmental health and justice concerns, because it is imposing its burden more severely on low socioeconomic regions and countries. Understanding the time pattern of these pollutants can help in better management and control. The aim of this study was to forecast ambient air pollutants by time series models in Tehran, Iran. This study was an ecological study about six ambient air pollutants (ozone [O], carbon monoxide [CO], nitrogen dioxide [NO2], sulfur dioxide [SO2], particulate matter [PM]10 and PM2.5) measured in Tehran during 2005–2018. Monthly mean values were calculated for each pollutant, and Holt-Winters models were used to predict values for the next 3 years (2019–2021). O3, CO, NO2, and SO2 had a decreasing trend from 2005 until 2018, but PM10 had an increasing trend. All pollutants showed a seasonal pattern. Higher concentrations of O3 and PM10 occurred in the warm months; and for CO and SO2 higher concentrations occurred in the cool months. The forecasting models showed that PM10 will increase, whereas other pollutants will decrease in the future. It can be concluded that in the next years (2019–2021), PM10 could be a huge environmental problem for Tehran. Other pollutants have had a decreasing trend, but they still need surveillance.
Introduction
Air pollution is a complicated environmental health problem that endangers human life, especially in developing countries. Nowadays, air pollution has attracted the attention of researchers more than ever before. 1
Air pollution reduces visibility; causes eye irritation, cardiovascular and respiratory diseases, spontaneous abortion, and premature delivery; and reduces life expectancy. 2 , 3 , 4 , 5 , 6 It also causes global warming, loss of stratospheric ozone, and acidic rain. 7 , 8
Air pollution in developing countries is mainly due to overpopulation, vehicle malfunction, and the widespread use of fossil fuels. Urbanization and development of cities, inappropriate patterns of industrial development, and the improper location of facilitates are also other important factors leading to air pollution. 9 Each air pollutant affects human health in a different way. Particulate matter (PM), sulfur dioxide (SO2), nitrogen oxides (NOX), ozone (O3), and carbon monoxide (CO) are the most important ambient air pollutants.6, 10
According to the World Health Organization (WHO), in 2016, ∼91% of the world population was living in places where the WHO air quality guideline levels were not met. It is estimated that in 2016, outdoor air pollution in urban and rural areas caused 4.2 million premature deaths around the world; and nearly 91% of these premature deaths occurred in low- and middle-income countries, and most of these deaths were due to ischemic heart disease and strokes (58%), or chronic obstructive pulmonary diseases and acute lower respiratory infections (18%), and 6% of deaths were due to lung cancer. 11
Clean air and breathing in healthy air are one of the most basic rights of humans. Air pollution is currently one of the main global environmental health and justice concerns, because it is imposing its burden more severely on low socioeconomic regions and countries. In Tehran, air pollutants, especially PM, have higher concentrations in less privileged areas. Also, although regions with a higher rank in terms of socioeconomic status have a greater share in the production of pollution, they suffer less from the adverse effects of air pollution, because of their better economic, social, and educational status; and regions with the lowest socioeconomic rank are more likely to suffer from air and noise pollution, and face the consequences of environmental injustice. 12 Environmental justice is defined by the U.S. Environmental Protection Agency as “fair treatment and meaningful involvement of all people regardless of race, skin color, origin, or income, with respect to the development, implementation, and enforcement of environmental laws, regulations, and policies.” 13 , 14
In recent decades, various statistical models have been used for studying air pollution. Common descriptive statistics have limitations in interpreting the changes of ambient air pollutants. Although there are different models for prediction, such as regression, and artificial neural network, the time series model has been more popular and has been used to forecast air pollutant values in many cities around the world. 15 , 16 , 17 , 18 Time series data are continuous observations recorded over time in a specific location. 19 The main objective of time series analysis is picturing and forecasting the temporal changes of variables over time. Univariate time series methods can do forecasting better than other univariate models. 12 Holt-Winters is one of the most popular forecasting techniques for time series.
Several studies have predicted air pollution in Tehran. However, they differ from this study in terms of the period under study and the models used for prediction. Some have only made predictions for parts of Tehran. 20 , 21 This is the first time series study conducted about air pollution in greater Tehran.
Tehran, the capital of Iran, has a population of more than 12 million people. It is one of the world's most polluted cities with respect to air pollution and lies in a geographical setting between mountains at an altitude of 3300 to 5000 feet. Like many mountain-valley locations, the topography has exacerbated Tehran's air pollution problems. 22 The aim of this study was to determine the long-term variability of air pollutant concentrations in Tehran and predict the likely concentrations of ambient air pollutants for the next several years.
Materials and Methods
Study plan
This study was based on the hourly air pollution data (CO, O3, NO2, SO2, and PM10) measured in Tehran, Iran. Data from March 2005 to February 2018 were acquired from the Tehran Province Environmental Protection Agency and the Tehran Air Quality Control Unit. There are currently 21 air quality monitoring stations supervised by the Municipality Air Quality Control Units and 16 stations supervised by the Tehran Province Environmental Protection Agency. However, most stations have been established in recent years and have only limited data. Thus, seven stations that had recorded air pollutant concentrations for at least 10 years and had the least missing data were selected.
Measurement, quality assurance, and quality control
In all stations, beta absorption (β attenuation) was used to measure PM10. Ground level ozone (GLO) was detected by UV absorption instruments. Nitrogen oxides (NO and NOx) and SO2 were measured by using chemiluminescence and UV fluorescence, respectively. CO was measured by using infrared absorption. As part of the QA/QC program, calibrations for the instruments were performed at the time of installations. Daily inspections (regular and unprecedented), weekly zero check, span check, and semiannual interval calibrations were conducted by experts.
The reported measurement units differed from station to station and even within one station for different years. Therefore, the measurements at all stations were converted to a uniform set of units. The measurement units for O3, SO2, and nitrogen dioxide (NO2) were converted to ppb. The unit for CO was ppm. The units for PM10 and PM2.5 were μg/m 3 .
Statistical analysis
A spatiotemporal tool was used to detect outliers, and a range was defined for each observation. This range included 2-hour intervals before and after each observation in the same station and adjacent stations. Then, the mean and standard deviation was calculated for each spatiotemporal range and the values that were not within the mean ± 2 standard deviation (SD), and were outliers, were deleted and considered missing data. More than 75% of the data of air pollutants was recorded every month and at all stations; for this reason, the monthly average of recorded data was calculated regardless of the hours when the data were not recorded.
In this study, we used trend analysis by Minitab 17 software to detect the trend, seasonality, and pattern of air pollutants. The Mean Absolute Percentage Error index was used to select the model. Also, the trend of pollutants was tested with the Mann-Kendall test by using the “Kendal” package in R software.
Because of the non-normal distribution of air pollution data, the Holt Winters model was used to predict data for the next 36 next months (March 2018–February 2021). The Holt Winters model is a prediction model that has been used since 1960 to predict the linear and seasonal trends of time series. This model uses the modified form of the exponential smoothing formula and applies three exponential smoothing steps:
The mean is smoothed to give a local average value for the series. The trend is smoothed, and then each seasonal sub-series is smoothed separately to give a seasonal estimate for each season. The exponential smoothing formula is applied to the series with a trend and constant seasonal component by using the Holt Winters additive or multiplicative methods.
23
Minitab17 was used to calculate the descriptive indicators (mean, median, SD, minimum, maximum, and percentile) and draw the graphs of time series.
Results
Table 1 presents the monthly descriptive statistics of air pollutants from March 2005 to February 2018 in Tehran, Iran. The annual averages of PM10 and NO2 are higher than the air quality standard values. Spearman correlation coefficients between the air pollutants are shown in Table 2. Some pollutants such as NO2, SO2, and CO were correlated. O3 was correlated with SO2.
Monthly Descriptive Statistics of Air Pollutants in Tehran from 2005 to 2018
CO, carbon monoxide; NO2, nitrogen dioxide; O3, ozone; PM, particulate matter; SO2, sulfur dioxide.
Spearman Correlation Coefficients Between Air Pollutants
p < 0.01.
p < 0.001.
Figure 1A–E shows the pollutant time trends. Figure 1A depicts the seasonal pattern for O3. The maximum and minimum concentrations were observed in the warm (July, August, and September) and cool (November, December, and January) months, respectively. Decreasing trends can be seen in the O3 plot (p < 0.001).

The trend of air pollutants in Tehran from March 2005 until February 2018.
Ambient CO has significantly decreased during these years in Tehran (p < 0.001). Also, a seasonal pattern was observed with maximum and minimum levels in the cold (November, December, and January) and warm (July, August, and September) months, respectively (Fig. 1B).
NO2 showed a seasonal and significant decreasing time trend (p < 0.001) (Fig. 1C). High concentrations of NO2 were seen in October and November.
A significant seasonal pattern was seen for SO2 (Fig. 1D), in which SO2 concentrations were higher in the cold months (November and December). SO2 showed a significant decreasing trend (p < 0.001).
PM10 showed an increasing trend (p = 0.011) and seasonal variation during the time interval under study. The highest PM10 concentrations occurred in June and July (Fig. 1).
The annual average of air pollutants in Tehran from 2005 to 2018, and the average forecast of air pollutants for 2019 to 2021 are shown in Table 3.
Annual Average of Air Pollutants in Tehran from 2005 to 2018 and the Average Forecast of Air Pollutants for 2019 to 2021
Forecasts for all pollutants can be seen in Figure 2A–E for 2019–2021. These forecasts indicate that if the sources of pollution continue emitting at their current rates and do not increase, except for PM10, none of the pollutants under study will increase by 2021. And the trend of all pollutants will be decreasing. But the increasing trend of PM10 is alarming.

The prediction of air pollutants in Tehran from 2019 until 2020.
Figure 3 shows Q-Q Plot charts for determining the fitness of prediction models. As can be seen, the forecasting models have a good fit for all pollutants under study.
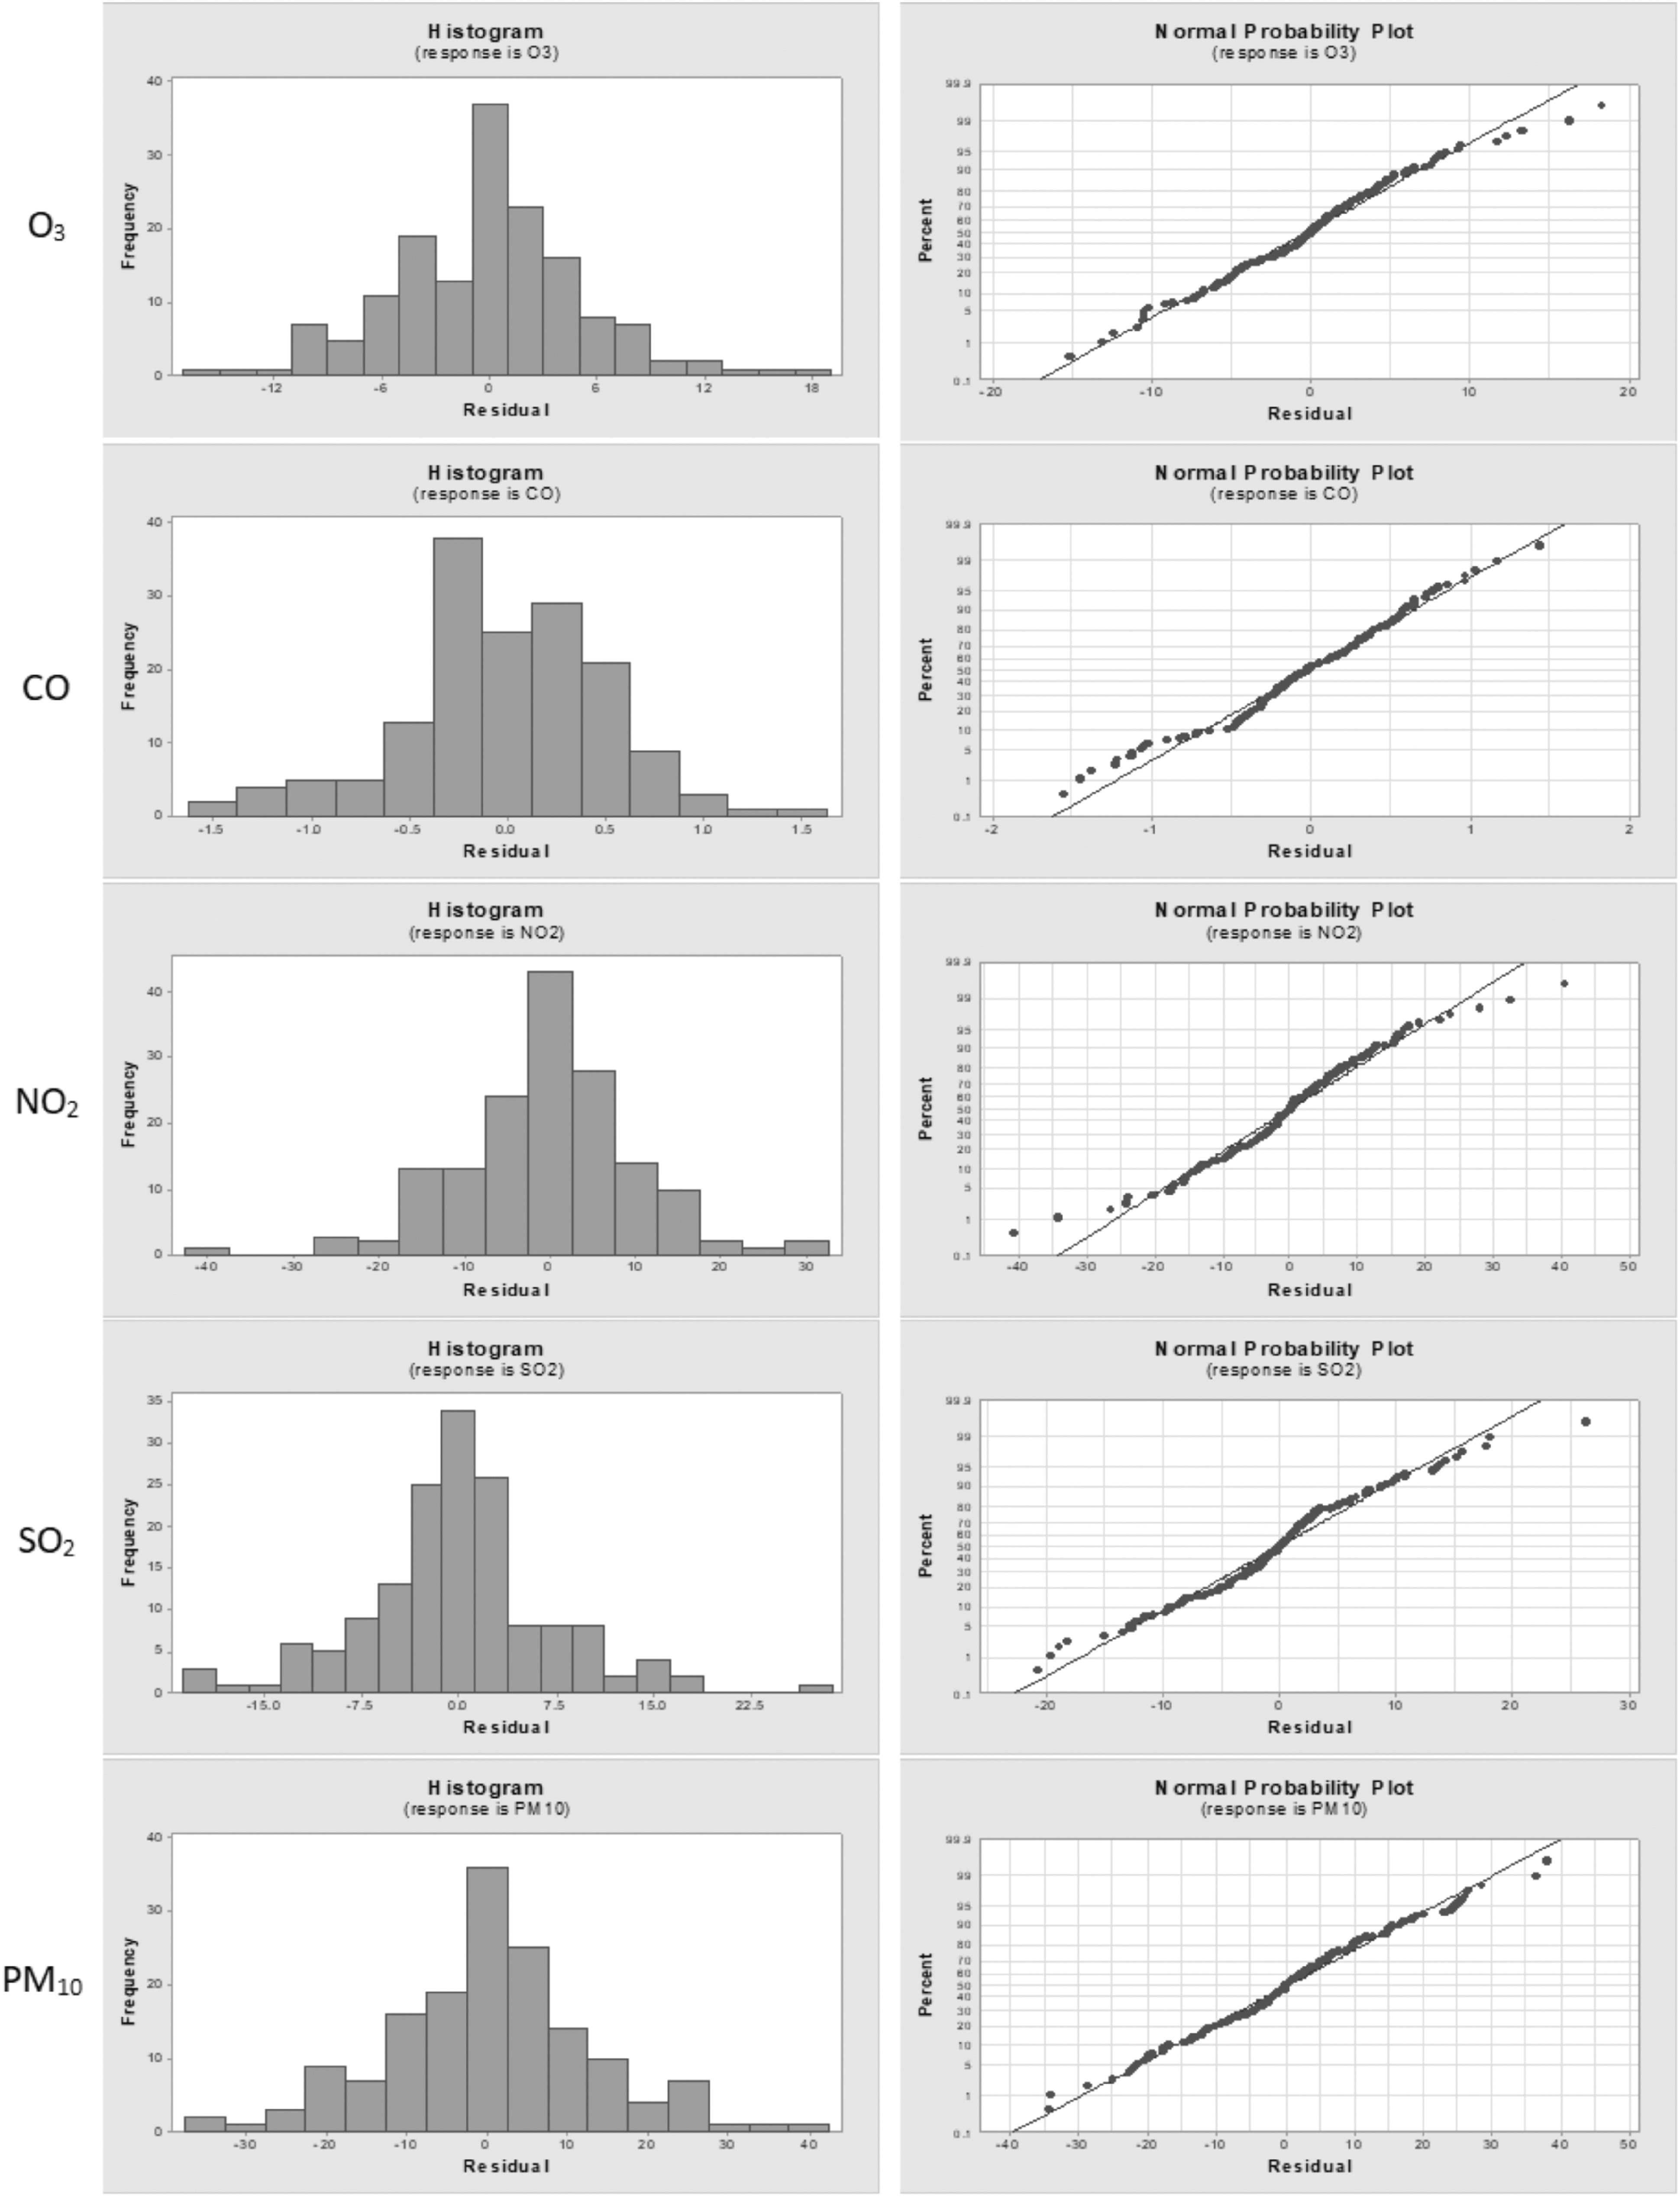
The histogram and normal probability plots of the air pollutants.
Discussion
Times series studies have been conducted to forecast air pollution levels in many world cities.16, 24 , 25 , 26
A decreasing O3 trend was observed in Tehran during 2005–2018. The highest average monthly concentrations for O3 were in 2007 (34.50 ppb) and the lowest in 2017 (19.38 ppb), and they are predicted to decrease from 2019 to 2021 (Table 3). Nitrogen oxides, volatile organic compounds, heat, and sunlight are four main components that produce GLO. 27 Higher solar radiation and increased temperatures increase O3 concentrations during the warm months. 28 This seasonal pattern for O3 was observed in other studies12,15, 29 as well. However, higher O3 concentrations were reported during the cold months in Ahvaz in 2012. 25
CO had a decreasing and seasonal pattern in this study. The highest average monthly concentrations for CO were in 2005 (4.77 ppm) and the lowest in 2017 (2.33 ppm). CO is predicted to decrease from 2019 to 2021, and it will probably reach 1.26 ppm in 2021 (Table 3). Mansouri et al. 22 also observed a decreasing and seasonal pattern for CO in Kerman, in southeastern Iran. However, Modarres et al. reported that in 2005, in Esfahan, in central Iran, CO was increasing. 23 Since June 2007, the quota system for fuel distribution has led to smarter fuel use, and reduced consumption of gasoline and diesel fuel in Iran. Also, the replacement of old vehicles with new ones and the increasing use of cleaner fuels such as compressed natural gas instead of gasoline have contributed to the decrease in CO concentration since 2007. CO concentrations are higher in the cold months of the year due to heating in houses and buildings and burning fossil fuels.
In this study, NO2 also showed a decreasing trend, but NO2 concentration is generally high in Tehran's air. The highest average monthly concentration for NO2 was in 2007 (71.35 ppb) and the lowest in 2016 (41.62 ppb). NO2 is predicted to decrease from 2019 to 2021. Fossil fuels are the main sources of NO2. 8 The decreasing trend of nitrogen oxides in Tehran can be related to recent smarter fuel consumption strategies and quota for gasoline and diesel distribution. However, Mansouri et al. reported an almost stable trend of NO2 in Kerman, Iran. 22
In this study, SO2 had a decreasing trend and a seasonal pattern. The highest average monthly concentration for SO2 was in 2008 (45.91 ppb) and the lowest in 2018 (23.36 ppb). For the years 2019 to 2021, a decreasing trend is predicted; and it is likely to reach 18.14 ppb in 2021. In Kaushik et al.'s study in Delhi, SO2 also had a seasonal pattern, and high concentrations were seen in cool months. 21 However, Mansouri et al.'s study reported a stable trend for SO2 in Kerman, Iran. 22
In recent years, the west part of Iran, from Ahvaz to Tabriz has suffered from the Middle East Dust storms. 30 , 31 Tehran has also faced the consequences of these storms in the recent decade. Fine dust is one of the important air pollutants in cities and villages of Iran and is currently considered a serious health problem. Particles suspended in air are a matter of concern in environmental health, as they can enter the respiratory system and cause breathing and cardiovascular problems. Evidence suggests that the adverse health effects of suspended particles with diameters smaller than 10 (PM10) micrometers are more than other pollutants. In this study, PM10 had a seasonal pattern and an increasing trend. The highest average monthly concentration for PM10 was in 2016 (85.84 μg/m 3 ) and the lowest in 2007 (60.93 μg/m 3 ). An increasing trend is predicted for PM10, and it will probably reach 108.67 μg/m 3 in 2021. The study conducted in Kerman, Iran also showed that fine particles had an increasing trend over the years. 22 Apparently, PM10 reaches its maximum concentration in Tehran in September and October. However, PM10 in some other cities, such as Kerman in the south east of Iran, has two peaks, one in May and one in October. 22 Liu et al. also showed that PM10 has a seasonal pattern in Taiwan, and maximum values are seen in spring. 32
The destruction of forests, building new dams and other destructive factors, as well as problems caused by the Iraq civil wars, vegetation loss, and degradation are a number of reasons for the increase in ambient PM in Iran.
Increasing vegetation around cities and villages, shrinking deserts, and cooperating with neighboring countries, especially Iraq, can help decrease ambient PM in Iran. Also, more restrictions on private vehicles, greater use of public transport, cleaner fuels, replacement of old cars, and routine vehicle inspections are necessary to decrease air pollution in Tehran.
Considering that several studies have shown a link between PM10 and cardiovascular and respiratory diseases,3,4, 33 , 34 the increasing trend of PM10 can increase hospital referrals and deaths from cardiovascular and respiratory diseases, especially in the low socioeconomic groups, in the future years, in Tehran; and this is alarming for the health system.
Conclusions
PM10 will probably increase in the next 3 years (2019–2021) in Tehran, Iran. Other air pollutants will probably not increase, but they should be under surveillance. Efforts should continue to manage ambient air pollution in Tehran, especially PM10. Displacing industries from the west to the east of Tehran, using low sulfur fuels, supporting public transportation, minimizing the activity of industries particularly in cold seasons, and upgrading the level of auto manufactures to at least four or five Euro standards are recommended to reduce air pollution in Tehran.
Footnotes
Authors' Contributions
Dr. Dehghan is from Fasa University of Medical Sciences; Dr. Khanjani, Dr. Bahrampour, are from Kerman University of Medical Sciences; Dr. Goudarzi is from the Ahvaz Jundishapur University of Medical Science; Dr. Younesian is from Tehran University of Medical Sciences; and Mr. Jafarnezhad is from Kerman University of Medical Sciences and Hormozgan University of Medical Sciences, all in Iran, where research and education are the primary functions. N.K. suggested the topic, was the main supervisor, and helped in writing and editing the article. A.D. cleaned the data, analyzed the data, and prepared the initial draft. A.B. supervised the data analysis, provided statistical consultation, and edited the final article. G.G. provided scientific advice for air pollution and edited the final article. M.Y. provided scientific and methodology consultation and edited the final article. P.K.H. provided methodology consultation and edited the final article. A.J. acquired the data, cleaned the data, and helped with the logistics and paper work.
Acknowledgments
The authors appreciate the Tehran Department of Environment and the Tehran Municipality Air Quality Control Unit for providing the data.
Author Disclosure Statement
No competing financial interests exist.
Funding Information
This study was financially supported by Kerman University of Medical Sciences, Kerman, Iran (Grant No.: 950198).