
Abstract
In 2019, The EAT-Lancet Commission developed criteria to assist policymakers and health care systems worldwide in sustaining natural resources to feed a forecasted 10 billion people through the year 2050. Although American dietary habits and underlying food production practices have a disproportionately negative impact on land, greenhouse gas (GHG), and water resources, there is limited information on how this population can meet the EAT-Lancet criteria. To address this, we measured adherence to an adapted version of the EAT-Lancet diet score criteria in United States (U.S.) populations overall and across racial/ethnic subgroups (i.e., black, Latinx, and white). In addition, we assessed the benefits of adherence in terms of saved environmental resources (i.e., land, GHG, and water). By performing these objectives, we provide vital information for the development of effective intervention strategies in the U.S. with enough refinement to address the human health and environmental implications of marginalized populations. Our results demonstrate that, on average, Americans do not meet EAT-Lancet criteria overall or across racial/ethnic subgroups. Shifting dietary intakes to meet the criteria could reduce environmental degradation between 28% and 38%. Furthermore, these methods can be adapted to other nations for the development of meaningful strategies that address the food, energy, and water challenges of our time.
Introduction
“P
Leading research indicates that the modern Western diet, which is typically followed in the United States, does not adhere to EAT-Lancet criteria.2, 7 , 8 We argue that U.S. policymakers should take steps to ensure citizens adhere to EAT-Lancet criteria for three primary reasons: (1) agricultural activities for food production have a significant impact on environmental resources, including greenhouse gas (GHG) emissions2, 9 , 10 ; (2) the U.S. is one of the largest GHG-emitting countries per capita and cumulatively in the world 11 , 12 ; and (3) evaluating environmental impacts of individual dietary data within countries is needed for population subgroups—especially disadvantaged groups. 13 Still, there is limited information on environmental performance and adherence to the EAT-Lancet criteria. 14 Our study helps to fill this gap by measuring adherence to an adapted version of the EAT-Lancet diet score criteria for the U.S. overall and across racial/ethnic subgroups.
Both structural and social factors—such as food production and race/ethnicity—influence adherence to EAT-Lancet criteria. For instance, global environmental change from food production typically manifests as loss of biodiversity, 15 changes in land use, 16 water quality, and natural resource use, 17 as well as GHG emissions. 18 Sociodemographic factors—such as race and ethnicity—are established predictors of dietary adherence in the U.S. 19 , 20 , 21 , 22 Similarly, pertinent socioecological dynamics emerge in food policy, 23 including dietary intake patterns that yield disproportionate environmental degradation based on race/ethnic grouping,19, 24 , 25 human health factors,6, 26 and perceptions of climate change risk for U.S. farmers. 20 Evaluating adherence to EAT-Lancet dietary criteria among U.S. populations may, therefore, serve as a foundational step toward developing intervention strategies that reduce environmental degradation through improved dietary behavior.
As noted, our study measures U.S. adherence to EAT-Lancet diet score criteria across racial/ethnic subgroups (i.e., black, Latinx, and white), using an adapted version of these criteria. By calculating quantitative measures of land, GHG, and water food consumption impacts (FCIs), we inform strategies and interventions for meeting these criteria. We use the term FCI as a quantified measure of environmental change that derives from human food consumption.24,25 Furthermore, we discuss how our methodological approach can be adapted to suit the population profile of countries around the world.
Materials and Methods
FCI data sources and calculations
As a validated method for estimating and assessing the environmental impacts of food production,24, 27 , 28 , 29 , 30 this study employed life cycle assessment (LCA) to frame and identify sources for data collection. Although the food system is made up of several interlinked LCA stages and substages, this study specifically focuses on the stages that correspond with cradle-to-farm-gate agricultural activities (i.e., production and processing activities that occur before foodstuff leaves the farm gate boundary 24 ) and their correlation with food consumption. Other food system LCA stages—such as food transport—were excluded on the basis of representing only a small portion of life-cycle GHG emissions and due to a lack of available racially/ethnically specific data that aligns with this study's methodological framework.25, 31
To capture the variety of foods consumed in the U.S. which totals >7000 food items for >500 food commodities, 31 food-energy-water (FEW) impact rates and food consumption data were aggregated from centralized databases and pertinent studies. Sources including OpenLCA, the Barilla Center for Food & Nutrition, the Food and Agriculture Organization of the United Nations, and the U.S. Department of Agriculture (USDA) were used to develop mean land, GHG, and water FEW impact rates.24, 32 , 33 , 34 , 35 , 36 , 37 , 38 , 39
We gathered per capita food consumption data from the What We Eat in America—Food Commodity Intake Database (WWEIA-FCID), which pulls data from the Continuing Survey of Food Intakes by Individuals and the National Health and Nutrition Examination Survey (NHANES) data. 31 More than 24,000 individuals were sampled in the compiled data, which comprises 24-hour recall data. Synthesized as a 2-day average across race/ethnic groups (i.e., black, Latinx, and white), it represents years 2005 through 2010. To be clear, the term “Black” in this study represents WWEIA-FCID data for non-Hispanic black people, “Latinx” represents an average of WWEIA-FCID data for Hispanic and Mexican Americans, and “White” represents WWEIA-FCID data for non-Hispanic white people across all age groups. Taken together, these racial/ethnic subgroups represent ∼92% of the U.S. population. 24 Since the WWEIA-FCID database did not provide data on the consumption of added sugars, we developed per capita added sugars intake rates from year 2003 to 2004 NHANES data.34, 40 These were calculated by averaging male and female consumption rates of adults aged 18+ across race/ethnic groups, as 24-hour recall data.
Here is the modular principal equation we used to calculate FCIs:
where the subscript “L” stands for land, “G” for GHG, and “W” for water; n represents a given food item; xn is the per capita consumption rate of n in units of g/day; and
We did not include work from previous studies that have already established the statistical significance of food consumption and FCIs across black, Latinx, and white subgroups.24,34 Nonetheless, these cited studies ensured that the racially/ethnically specific results of this study were meaningful and not simply due to chance.
Adapting the EAT-Lancet diet score criteria
Nutritional indices (also known as diet scores) are widely accepted as effective tools to assess the population's adherence to various nutritional and health standards. 41 , 42 , 43 For example, the Healthy Eating Index (developed by scientists at the USDA and National Institutes of Health) was created to measure population level adherence to the Dietary Guidelines for Americans (DGAs) as well as provide nutrition guidance for chronic disease prevention in the general population. 44 , 45 Although previous studies have linked environmental sustainability to nutritional standards and diet scores,41, 46 , 47 the criteria for the EAT-Lancet diet score is unique, in that it embeds environmental sustainability and human health factors at a global scale directly into its framework. 2 Furthermore, the EAT-Lancet criteria incorporates planetary boundaries of vital ecosystem services for a projected global population of 10 billion through the year 2050. Accordingly, we used the EAT-Lancet diet score and its reference diet framework to highlight the environmental benefits of adherence to dietary guidelines across racial/ethnic subgroups.
Specifically, we adapted the EAT-Lancet diet score criteria to fit the analytical and methodological profile of our data. The un-adapted EAT-Lancet diet score criteria has 14 scoring elements, each linked to particular dietary components. 2 We adapted this to 12 scoring elements that align with our FEW impact categories (Table 1).
Diet Score Framework
NA as in this table component has no information or data methodologically suitable for this study.
Dry beans, lentils, peas and soy foods were combined to align with the framework of this study. 24
The whole grain fiber threshold is met if at least 145 g/day of total grains were consumed based on a 3.5% total grain to fiber ratio.46,47
Added fats were removed as a diet score component due to insufficient data for types of oils. 2
FEW, food-energy-water; GHG, greenhouse gas; NA, not applicable.
In total, we made three adaptions. First, we combined the original scoring criteria of “Dry beans, lentils, peas” with “Soy foods” since the food item “Soy/Beans,” along with its associated FEW impact rates, encompasses similar legume vegetables. Second, we established a minimum amount of total grains needed to be consumed to meet the >5-grams criteria at 145 g/day using data from USDA and guidance from the Oldways Whole Grains Council website. 48 , 49 In the final adaption, we removed “Added fats” as a diet score component, while maintaining its corresponding FEW impact rates for FCI calculation purposes. We made this adaption because the EAT-Lancet framework notes there was too little data and information on oil types to establish more robust criteria for “Added fats.” 2 It is also worth noting that most medical professionals believe that fat intake alone is not the primary driver behind increased risk of noncommunicable diseases through weight gain and obesity. 35
Diet scoring and caloric energy intake estimations
Each of the 12 diet score criteria were scored as either 0 for “not satisfied” or 1 for “satisfied.” Using this adapted version of the EAT-Lancet diet score, the maximum amount of points that any subgroup could accrue was 12. Diet score components were assessed using food consumption rates [xn from Eq. (1)].
We used the EAT-Lancet reference diet's kcal per day and macronutrient intake rates for each dietary component as ratios to assess caloric energy intake based on an overall energy intake of 2500 kcal per day. These ratios are shown in the “kcal:g ratio” column of Table 1. The “Added fats” component incorporated unsaturated oil and lard submeasures to meet the 2500-kcal mark. 2 We used the palm oil submeasure from footnote 2 (60 kcal/day) to estimate caloric energy intake for the “Added fats” dietary component.
Consumption rate adjustments for a balanced diet
Baseline consumption rates were adjusted to meet diet score criteria and to create a scenario for complete adherence (12/12 points). We employed a balanced diet approach with the assumption that scoring criteria would be met by equally adjusting consumption of all food items within a given food group. More restrictive diets that may prohibit the consumption of certain food items—such as restrictions associated with a vegetarian diet or populations with food allergies—were not considered.
We employed several rules and guidelines to establish the balanced diet adjustments. Six of the 12 diet score components required the establishment of specific rules and guidelines: “(1) All vegetables”; “(4) Beef, lamb, pork”; “(5) Chicken, other poultry”; “(6) Eggs”; “(9) Legumes: Peanuts or tree nuts”; and “(12) Added sugars” as shown in Table 1. The other components did not require alterations. All adjustment rules and guidelines are shown in Table 2.
Rate Adjustment Rules and Guidelines for a Balanced Diet
For the “Adjustment rule/guideline” column, “new_x” is the adjusted consumption rate, “x” is the baseline rate, and “y” is the adjustment value.
Results
U.S. baseline assessment of healthy and sustainable consumption
To establish which criteria are not being met, on average, by Americans, we compared the baseline—or as is—assessment of food consumption rates with an adapted version of the EAT-Lancet diet score criteria. Figure 1 encompasses the variety of food consumed in the U.S. and compares that with the diet score criteria shown in Table 1. A score of 12/12 means that all criteria are met. However, results show that Americans do not satisfy all criteria with a score of 8/12.

Baseline U.S. consumption rates compared with diet score criteria. The dashed horizontal lines and arrows are visualizations of diet score criteria (refer to the “Point Criteria” column of Table 1), where upward-pointing arrows denote equal to or greater than the criterion consumption rate (value indicated on y-axis) and downward-pointing arrows denote less than or equal to the criterion consumption rate. Solid horizontal lines and downward-pointing arrows denote a criterion of less than the criterion consumption rate. A green bar indicates that the diet score component is satisfied or met. Each satisfied criterion yields 1 point with a maximum possibility of 12 points. A red bar indicates an unmet criterion and yields 0 points. This analysis yields a diet score of 8/12 for the average American. Color images are available online.
The unmet criteria have important human and environmental health implications. Figure 1 shows that the diet score components “(1) All vegetables,” “(4) Beef, lamb, pork,” “(9) Peanuts or tree nuts,” and “(12) Added sugars” do not meet healthy and sustainable food criteria. It is important to emphasize that anything less than full adherence has implications for human nutrition and the environmental health of the planet. Thus, negative human and environmental health implications exist whenever the diet score is <12/12.
Data show that the U.S. population consumes vegetables at a rate of ∼190 g/day out of the ≥200 g/day criterion. The beef, lamb, and pork category shows consumption at a rate more than double its diet score threshold. These food items are overconsumed at about 44 g/day (72 g/day out of the ≤28 g/day criterion). The peanuts or tree nuts component is consumed at a rate that is roughly six times less than its criterion threshold (4 g out of the ≥25 g/day criterion). Also, the added sugars component is consumed at a rate more than double its criterion threshold (68 g/day out of the ≤31 g/day criterion); thus, Americans overconsume added sugars by about 37 g/day.
Table 3 shows the mean land, GHG, and water FCIs associated with annual baseline consumption in the U.S. These values, which are also referred to as as-is values herein, are important to establish for assessing percentage changes in FCIs in cases where Americans conform to all criteria. We show what the implications are in the following section.
Per Capita Baseline Food Consumption Impacts for U.S.
The land and water FCIs are rounded up based on four significant digits, whereas the GHG FCI is rounded up based on three significant digits. These FCIs represent cradle-to-farm-gate activities and not the entire food life cycle.
FCI, food consumption impact.
U.S.-level adherence using a balanced diet
If Americans were to conform to all criteria, shifts in the consumption of several diet score components would be required. To assess the environmental benefits of complete adherence, we used a balanced diet approach as a way to measure FCI and caloric energy intake changes. For the case of U.S.-level adherence, vegetable consumption is increased by about 10 g/day; beef, lamb, and pork consumption is decreased by 44 g/day; nut intake is increased by 20 g/day; and added sugar intake is decreased by about 37 g/day following the rules and guidelines explained in the Materials and Methods section. Figure 2 details what the FCI and caloric energy intake implications would be when shifting from the consumption rates shown in Figure 1 to rates that yield a diet score of 12/12. Each change is further explained.

Per capita adherence FCIs for U.S. This figure contains details for the net reduction of FCIs in the scenario that all diet score criteria are satisfied compared with baseline conditions: that is, a diet score of 12/12. The numerals in the top portion of this figure show the net change in FCIs and overall energy intake (kcal: kilocalories) as a percentage. Adherence FCIs are also shown as quantitative rates where the land and water FCIs are rounded up based on four significant digits, while the GHG FCI is rounded up based on three significant digits. The stacked and textured bar graph content in the bottom portion of this figure details the percentage change of each diet score component. Furthermore, the bar graph content is proportional, where bars that extend above the x-axis (0%) represent a categorical addition to FCIs and those that fall below represent a categorical reduction in FCIs. Diet score components that meet criterion in the baseline—as shown in Figure 1—are omitted from this figure since they yield 0% change. FCI, food consumption impact; GHG, greenhouse gas. Color images are available online.
Figure 2 shows that vegetable FCIs would experience very little new environmental degradation when increasing consumption by about 10 g/day. This shift would slightly increase land, GHG, and water FCIs at percentages <0.5% for each. Beef, lamb, and pork intake was decreased by 44 g/day to meet its criterion. Shifting this dietary component would have the most influence on FCIs by far. Percentage reductions across land, GHG, and water FCIs would range between about 25.1% and 35.8% for this diet score component. Nut intake would need to be increased by about 20 g/day to meet criterion. Increasing intake here has a larger increase on FCIs than vegetables, but the increase does not exceed 2.2% in any FCI category. Added sugars intake would need to be reduced by about 37 g/day to meet criterion. It would decrease FCIs between 1.4% and 5.6%. Only the beef, lamb, and pork component would decrease FCIs at higher percentages.
Taken together, Figure 2 shows that meeting all criteria would yield a net reduction in land FCI by 36.1%, GHG by 31.8%, and water by 30.4%. Caloric energy intake would be maintained since results show a net reduction of only 4.6%. The beef, lamb, and pork diet score component would have the largest effect on FCIs, whereas vegetables and nuts would have negligible FCI effect in comparison.
Baseline assessment across racial/ethnic subgroups
This assessment compares food consumption rates to the adapted EAT-Lancet diet score criteria across major racial/ethnic subgroups in the U.S. (i.e., black, Latinx, and white). Figure 3 shows that on average, black intake yields a diet score of 7/12, Latinx 7/12, and white 9/12. This means that no racial/ethnic subgroup analyzed in our study meets all criteria; however, white people meet more criteria and would have to shift fewer diet score components than their black and Latinx counterparts. Furthermore, each subgroup has unique criterion dynamics that warrants further explanation.
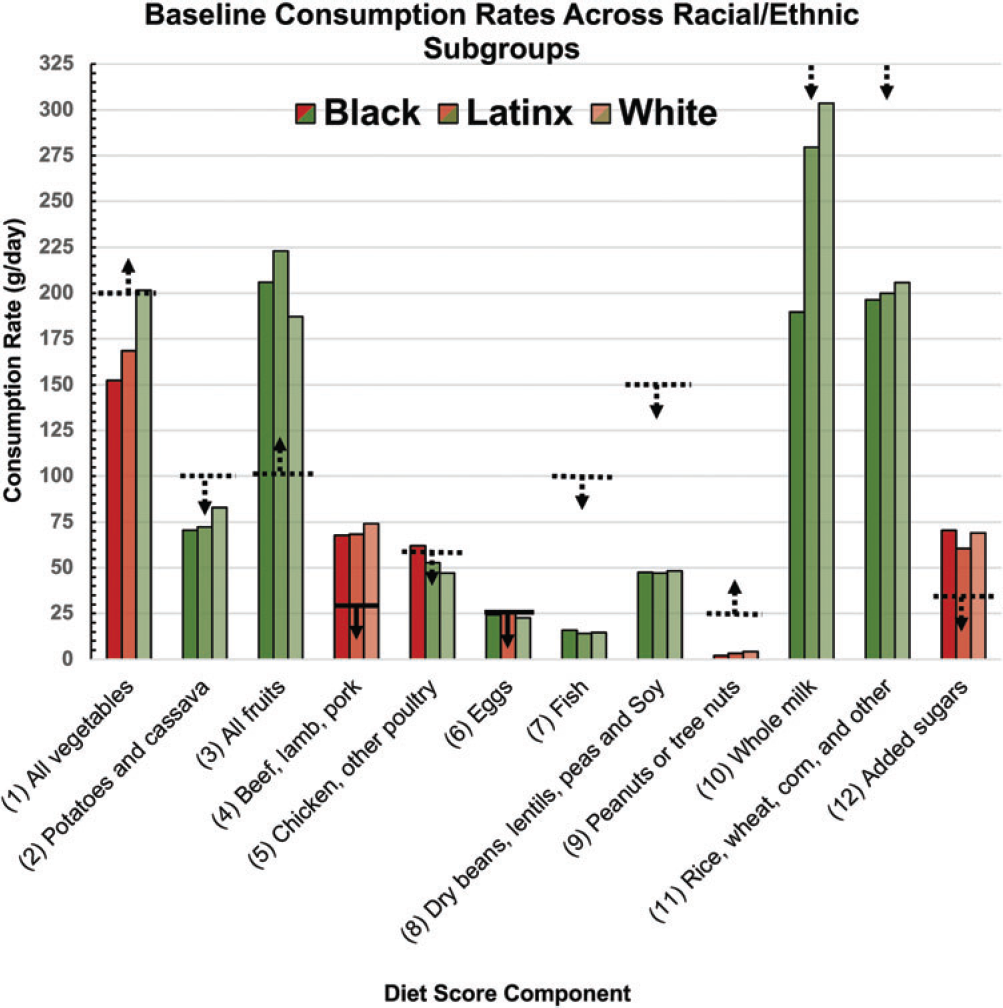
Baseline racial/ethnic consumption rates compared with diet score criteria. The dashed horizontal lines and arrows are visualizations of diet score criteria (refer to the “Point Criteria” column of Table 1), where upward-pointing arrows denote equal to or greater than the criterion consumption rate (value indicated on y-axis) and downward-pointing arrows denote less than or equal to the criterion consumption rate. Solid horizontal lines and downward-pointing arrows denote a criterion of less than the criterion consumption rate. Green bars indicate that diet score criteria are satisfied or met, where the dark green bars are for blacks, medium green are for Latinx, and light green are for whites. Red bars indicate unmet criteria, where the dark red bars are for blacks, medium red are for Latinx, and light red are for whites. Another way to distinguish the racial/ethnic subgroup data is by clusters of three, where the first bar of each cluster is always representative of the black subgroup, the second always of the Latinx subgroup, and the third always of the white subgroup. This comparison yields a diet score of 7/12 for blacks, 7/12 for Latinx, and 9/12 for whites. Color images are available online.
Figure 3 shows that black people do not meet five of the dietary criteria. This subgroup is about 48 g/day below the diet score component criterion for “(1) All vegetables”; 40 g/day above for “(4) beef, lamb, pork”; 4 g/day above for “(5) Chicken, other poultry”; 23 g/day below for “(9) Peanuts or tree nuts”; and about 39 g/day above for “(12) Added sugars.” Across subgroups, black people have the lowest vegetable and nut intake, and consume the highest levels of added sugars. They are also the only subgroup that overconsumes chicken and other poultry. Furthermore, Table 4 shows that black people have the highest as-is mean land FCI compared with their Latinx and white counterparts.
Per Capita Baseline Food Consumption Impacts Across Racial/Ethnic Subgroups
The land and water FCIs have been rounded up based on four significant digits, whereas the GHG FCI is rounded up based on three significant digits. The bold numerals denote the highest FCI across racial/ethnic subgroups in each FCI category (land, GHG, and water). This excludes any comparison with the U.S. population since it is not considered a stand-alone subgroup.
Latinx share the same diet score as black people (7/12) but differ in terms of the five components that are unmet. Figure 3 shows that Latinx people intake about 31 g/day below the “(1) All vegetables” criterion; 40 g/day above for “(4) Beef, lamb, pork”; 1 g/day above for “(6) Eggs” criterion; 22 g/day below for “(9) Peanuts or tree nuts”; and about 30 g/day above for “(12) Added sugars.” They are the only subgroup that overconsumes eggs, and have the lowest added sugars intake. Furthermore, Table 4 demonstrates that Latinx people have the lowest as-is mean land and water FCIs.
As noted, white people have three unmet criteria. Figure 3 shows they are ∼43 g/day above in their intake of “(4) Beef, lamb, pork” criterion; 21 g/day below for “(9) Peanuts or tree nuts”; and ∼38 g/day above for “(12) Added sugars.”
This subgroup meets the “(1) All vegetables” criterion but has the highest beef, lamb, and pork consumption rates on average. While white people yield the highest as-is diet score of 9/12, Table 4 shows that they also have the highest FCIs in GHG and water compared with their black and Latinx counterparts.
Adherence across racial/ethnic subgroups using a balanced diet
Fully adhering to dietary intake criteria would take a different form in each racial/ethnic subgroup. This section highlights the differences between subgroups, with a focus on FCI implications.
To obtain a score of 12/12, black people would have to adhere to five diet score criteria. Shifting rates of vegetables, chicken, and nut intake to meet the criteria would affect black FCIs but only marginally. These three diet score components do not exceed 2.6% in any land, GHG, or water FCI—as positive or negative percentages. Figure 4 shows that increasing nut intake by about 23 g/day increases the land FCI by 1.1%, GHG by 2.6%, and water by 0.1%. More significantly, meeting criterion for the added sugars component would result in FCI reductions of about 1.5% for land, 3.0% for GHG, and 6.2% for water; whereas shifting to meet the beef, lamb, and pork criterion would decrease FCIs at 32.0% for land, 31.1% for GHG, and 23.4% for water.

Per capita adherence FCIs across racial/ethnic subgroups. This figure contains details for the net reduction of FCIs in the scenario that all diet score criteria are satisfied compared with baseline conditions across racial/ethnic subgroups. The numerals in the top portion show the net change in FCIs and overall energy intake as a percentage. Adherence FCIs are also shown as quantitative rates, where the land and water FCIs are rounded up based on four significant digits, and the GHG FCI is rounded up based on three significant digits. The bold numerals denote the highest FCI across subgroups for each FCI category (land, GHG, and water). This excludes any comparison with the U.S. population values since it is not considered a stand-alone subgroup. The stacked and textured bar graph content below details the change in percentage of each diet score component across subgroups. Diet score components that meet criterion in the baseline (as shown in Fig. 3) were omitted from this figure, since they yield 0% change. Color images are available online.
Latinx people also have to shift their consumption for five diet score components to meet criteria, but their group of unmet criteria differ from the five unmet criteria of black people in that it includes a shift in egg consumption rather than chicken. Figure 4 shows that shifts in vegetables, nuts, and egg intake would have marginal effect on Latinx FCIs. By contrast, meeting criterion for the beef, lamb, and pork component would result in the largest reduction of FCIs at 33.5% for land, 29.9% for GHG, and 24.5% for water.
White people had the least number of criteria to satisfy (three). As was the case for black and Latinx people, shifting nut intake to meet criterion here would have a marginal impact on FCI. Shifting the intake of beef, lamb, and pork would result in the largest FCI reductions at 37.2% for land, 32.5% for GHG, and 25.8% for water. It is important to note that white people would have the largest net percentage reductions in land, GHG, and water FCIs after satisfying all criteria.
Taken together, these results show that adhering to an adapted version of the EAT-Lancet diet score criteria would decrease land, GHG, and water FCIs, ranging in intensity from 28.6% to 37.6%. All of these adherence FCI reductions would occur with a small reduction in caloric energy intake—ranging from 2.7% to 5.1%. In other words, these results suggest that caloric energy intake standards would be maintained, or nearly so, after shifting consumption habits to meet EAT-Lancet diet score criteria.
Discussion
Our study has revealed three significant findings. First, we confirm evidence suggesting that U.S. adherence to the EAT-Lancet diet score criteria would assist in meeting the global GHG reduction goals described in footnotes.2,11 Second, we discovered interesting dynamics for adherence across U.S. racial/ethnic subgroups, which suggest that health policy and behavioral change measures aimed at shifting American diets toward more health and sustainability would be made more effective by considering inequities in socioeconomic status. 50 Finally, we established a methodological approach that could be adapted and used by other nations worldwide to help propel a dietary shift at a global scale—as called for in footnote. 2 Although each of these findings highlight areas that would likely advance FEW discovery, our discussion focuses on the last two findings given they are the most novel.
To assist populations in shifting from unhealthy, more environmentally-damaging diets to healthy, more environmentally-sustainable ones, food pricing, subsidies, and taxes have been researched and developed as policy and behavioral change mechanisms. 26 For instance, it has been shown that decreasing the price of healthful foods—such as vegetables and fruits—by 10% increases the consumption of healthful foods by 12%. 51 , 52 Beef and pork have been shown to be even more price-elastic than fruits and vegetables, which suggests that increasing the price of beef and pork by a certain percentage would decrease the consumption of these foods by at least that percentage. Nonetheless, there is a need for further investigation into how pertinent policy interventions—such as food pricing through taxes and subsidies—impact populations of different socioeconomic positions or statuses. 53 , 54 , 55
Historical injustices have significantly contributed to inequities in socioeconomic status, dietary intake, and diet-related health outcomes in the U.S., such that black and Latinx people have substantially lower household incomes, educational attainment, and higher risk of diet-related diseases compared to their white counterparts.25, 56 , 57 , 58 , 59 Bearing this in mind, further research must be undertaken to inform the development of intervention strategies (e.g., price interventions through policy, person interventions through dietary counseling, or a hybrid thereof) to promote equitable access to healthy food resources. 60 When we extrapolate the U.S.-based findings of this study to a global scale, it becomes vital for policymakers to incorporate the income classification of a given country, considering high-income countries—such as the U.S.—can be influenced by tax and subsidy food interventions. 61 Currently, there is not enough evidence to claim that taxes and subsidies would be effective long-term in lower-income or developing countries.61, 62 , 63 , 64
One must consider several factors before adapting the methodological framework of our study to other countries. Black, Latinx, and white people are major racial/ethnic demographic subgroups in the U.S. However, a similar study for another country may group its populations differently. For instance, a Chinese adaption may designate demographics across age groupings (as shown in footnotes 65 , 66 ), whereas an Indian adaption might choose to group populations by caste, as exemplified in footnote. 67 Nonetheless, to develop effective strategies that meet the global challenges of our time, it is key that researchers and policymakers explore how varying social constructs (e.g., power and privilege) and determinants of health (e.g., access to health resources) influence individual dietary practices. 68 Moreover, robust data would have to be developed and made readily available to researchers and policymakers in a format conducive to sociodemographic or socioeconomic analysis. We recommend that public health organizations, such as the USDA and World Health Organization (WHO), take charge of these initiatives in support of their strategic goals of identifying the risk factors for food insecurity. 69
Current global trends in natural resource use and dietary intake cannot continue without risking the destabilization of vital ecosystem services. There has not been consensus on the decade, let alone the year, within which widespread destabilization will occur, if trends continue, since there are many heterogeneous factors involved in food insecurity.10, 70 , 71 However, it is generally accepted that population growth and corresponding food demand trends will be intractable if they persist unchanged through the year 2050, 2 and even more so if they persist through the year 2100. 23 After all, ∼38% of global land surface is used for agriculture. 72 One-third of this is dedicated to croplands, and the remaining two-thirds is primarily used for cultivating livestock on meadows and pastures. With respect to water resource use, 70% of the world's freshwater withdrawals are linked to agriculture, 73 and ∼15% of anthropogenic GHG emitted globally comes from livestock cultivation. 74 Increases in natural resource use, due to population growth and intensifying food demand, puts us at risk of breaching the Earth's planetary boundaries. 1 This evidence, in addition to present study findings, compels us to call for increased research and development adhering to EAT-Lancet criteria, particularly across racial/ethnic and socioeconomic groups worldwide.
Study limitations
Previous studies have asserted that WWEIA and NHANES dietary recall data have physiological inconsistencies. 75 , 76 Some researchers have argued that 24-hour recall data yield inaccurate results due to under-reporting in survey responses, 22 whereas others claim 2-day average dietary recall data provide a better snapshot of actual food consumption compared with 24-hour recall data. 77 Taken together, these general critiques suggest that the food consumption and caloric intake values of this study could be less than what is actually consumed and embodied by Americans, also making the environmental degradation measures—or FCIs—lesser than their actual values. These potential limitations motivated us to assess FCIs and caloric energy intake primarily as percentage deviations from the baseline. Although the quantitative measures of this study are useful, further standardization and research of dietary recall data and cradle-to-farm-gate LCA studies would be required to improve accuracy.24, 78 It is also important to note that data constraints made analyzing other U.S. racial/ethnic subgroups—such as Native American, Asian, and Pacific Islanders—untenable, although they are generically represented in the U.S.-level results.
Conclusion
We measured adherence to an adapted version of the EAT-Lancet diet score criteria in U.S. populations overall, measured across racial/ethnic subgroups (i.e., black, Latinx, and white), and assessed the benefits of adherence in terms of saved environmental resources (i.e., land, GHG, and water). Ultimately, we found that Americans do not meet EAT-Lancet criteria overall or across racial/ethnic subgroups. The U.S. population could meet the criteria by shifting their dietary intake of vegetables, red meat, nuts, and added sugars. Compared with the general U.S. population, black, Latinx, and white people must shift different food groupings to meet the criteria. Black people could meet the criteria by shifting dietary intake of vegetables, red meat, chicken, nuts, and added sugars; Latinx people would need to shift their dietary intake of vegetables, red meat, eggs, nuts, and added sugars; and white people would need to shift their consumption of red meat, nuts, and added sugars. Taken together, these results show that meeting all criteria, using a balanced diet approach, would significantly decrease environmental degradation in land, GHG, and water—at reductions of 28%–38%. This 10% range of 28%–38% in environmental degradation encompasses measures for adherence in the U.S. population overall, across subgroups, and across FCIs.
Public health impact statement
We want to highlight three public health impacts for this study and suggest future directions for this line of research. First, our results and findings compel us to advocate that the USDA add sustainability as a focus of the DGAs. This federal policy change could significantly raise awareness of the environmental benefits of healthy and sustainable diets and eventually lead to several new multilevel dietary interventions targeting vulnerable populations (e.g., low-income, women, and children) and programs centered on food sustainability. The DGAs provide policy guidelines for federal programs, including the Supplemental Nutrition Assistance Program, Women's, Infants & Children Program, and the School Lunch Program. Furthermore, adding sustainability to the DGAs could influence public opinion overall.
Second, our results demonstrate racial/ethnic disparities in adherence to EAT-Lancet criteria, in that black and Latinx subgroups exhibit lower as-is adherence compared with their white counterparts. This information provides a foundational step toward the development of effective dietary interventions targeting these marginalized subgroups. Furthermore, this finding may promote health equity, as it can encourage policymakers and public health organizations (e.g., USDA and WHO) to address the unique barriers minority populations face in accessing the healthy foods needed to achieve a sustainable diet.
Finally, further investigation is warranted on the adherence to disease-specific dietary patterns (e.g., Dietary Approaches to Stop Hypertension) and associated environmental impacts at other spatial scales—such as urban, rural, state, and local—across racial/ethnic subgroups to realize the most effective policy measures.
Footnotes
Acknowledgment
Authors' Contributions
J.F.B. and T.L.T. conceived of the overall study framework; S.S. assisted in the development of the diet component score and public health portion of the study framework; J.F.B. implemented the experiment; J.F.B. developed the initial article content; all authors drafted the article and contributed to the writing.
Author Disclosure Statement
No competing financial interests exist.
Funding Information
This study was funded, in part, by the Institute for Environmental Science and Policy of UIC and the Bayer Diversity Science, Technology, Engineering, and Mathematics Fellowship. S. Springfield was supported by the Stanford University Prevention Research Center NHLBI Cardiovascular Disease Prevention Training Program (T32 HL007034).