
Abstract
Black Americans in Louisiana are disproportionately dying from COVID-19, and environmental disparities may be contributing to this injustice. While Black communities in Louisiana's industrialized regions (e.g., Cancer Alley, Calcasieu Parish) have been overburdened with pollution for decades, this disparity has not been evaluated by using recent data. Here, we explore statewide relationships among air pollution burden, race, COVID-19 death rates, and other health/socioeconomic factors. Measures of pollution burden included satellite-derived particulate matter (PM2.5) concentrations and health risks from toxic air pollution (i.e., respiratory hazard [RH] and immunological hazard [IH], estimated by the Environmental Protection Agency). In addition, we evaluate changes in emissions and ambient concentrations of fine PM2.5 in Louisiana over the past few decades. Our overall goal was to better understand Louisiana's burden of air pollution in the context of COVID-19. By all measures, a higher burden of air pollution was associated with larger percentages of Black residents and increased unemployment across Louisiana census tracts. Across parishes, higher COVID-19 death rates were associated with increased RH and IH and larger percentages of Black residents. These associations were not driven by diabetes, obesity, smoking, age, or poverty. Industrial sources comprised more of Louisiana's PM2.5 in 2017 versus 1990, as vehicle contributions declined 75% whereas industrial emissions remained about the same overall (despite variation in the interim). Ambient concentrations of PM2.5 decreased statewide from 2000 to 2015, but subsequently increased in south Louisiana, concurrent with an upward trend in industrial emissions. Our findings highlight the critical need to address Louisiana's pollution disparities and to recognize air pollution exposure as a risk factor for COVID-19.
Background
Louisiana has been among the U.S. states hardest hit by the COVID-19 pandemic, with 88,590 cases and 3399 related deaths reported through July 17, 2020. 1 However, these impacts have not been evenly distributed 2 ; Black Americans account for 33% of Louisiana's population, but an alarming 51% of COVID-19 deaths in the state. 3 Similarly, disproportionate numbers of COVID-19 hospitalizations/deaths among Black Americans have been reported in multiple cities and states, and across the entire United States. 4 These disparities likely result from a complex mix of biological, social, and environmental factors, 5 and air pollution is predicted to be one such factor. 6 Identifying potential links among race, pollution, socioeconomics, health, and COVID-19 deaths in Louisiana may help elucidate, and ultimately address, the intractable public health disparities in this state.
A growing body of research provides compelling evidence that exposure to common air pollutants increases susceptibility to respiratory diseases, including from viral infections. 7 For example, exposure to particulate matter (PM) has been linked to higher rates of chronic cough, bronchitis, and chest illness among U.S. schoolchildren, 8 as well as increased hospital admissions for pneumonia in both children and adults. 9 Several studies suggest that even short-term (<7 days) increases in PM can result in higher rates of respiratory infections among children and adults. 10 Both short-term and long-term measurements of fine PM2.5 exposure were linked to higher death rates from SARS, a coronavirus, during the 2003 outbreak in China. 11 Experimental studies are beginning to elucidate the mechanisms underlying these associations, with evidence that PM suppresses the early immune response, for example by reducing macrophage activity. 12
Given the well-established link between air pollution and respiratory disease, there is growing concern that air pollution may increase susceptibility to COVID-19. This disease, caused by a novel coronavirus (SARS-CoV-2) that attacks the lungs, is characterized by respiratory distress and pneumonia. 13 Indeed, air pollution exposure is associated with many of the co-morbidities that increase risk of severe illness or death from COVID-19, including diabetes, hypertension, lung cancer, asthma, and chronic obstructive pulmonary disease. 14 A recent, nationwide analysis from researchers at Harvard University found that a small increase in PM2.5 exposure (measured over the short term or long term) was associated with a large increase in per capita COVID-19 death rates. 15 The analysis, currently under peer review, included more than 3000 counties and accounted for 20 confounding factors (e.g., diabetes, obesity, and days since first reported case [18]). At least eight other studies (representing the U.S., China, and several European countries) have reported geographic or temporal patterns that are consistent with an association between air pollution and COVID-19 death rates, including a robust analysis of 355 municipalities in The Netherlands that reported a nearly 100% increase in COVID-19 cases for every 20% increase in PM2.5 concentrations. 16 Although most of these studies have yet to undergo peer review, they collectively provide compelling evidence for a link between air pollution exposure and increased COVID-19 susceptibility.
Concerns about a possible link between air pollution and COVID-19 have brought national attention to Louisiana's “Cancer Alley,” a heavily industrialized, heavily polluted area with high percentages of Black Americans and high poverty rates. 17 Also referred to as the “Industrial Corridor” or “Death Alley,” this ∼130 river-mile, winding stretch of land along the Mississippi River encompasses more than 200 industrial sources of air pollution from Baton Rouge to New Orleans, including petrochemical facilities, metal manufacturers, and fertilizer plants. 18 In response to the evidence linking air pollution and COVID-19, the Louisiana Chemical Association claimed that “growing industry is actually causing emissions to go down, not up” and that vehicle emissions were a major PM source in Louisiana. 19 This narrative contradicts the firsthand experiences of Cancer Alley residents, many of whom have a higher risk of cancer from air pollution than ≥95% of Americans. 20 Environmental justice efforts have been ongoing in Louisiana for decades, as petrochemical development has continually targeted African American communities, 21 many of which were founded by enslaved people after emancipation. 22 For these communities, “victories” are hard-fought and rarely (if ever) achieve true justice, as illustrated by grassroots campaigns for paid relocation—a goal that would dissolve a community to protect the health of its citizens. 23 Louisiana's environmental justice efforts have intensified in response to a new, ongoing wave of industrialization that began in ∼2014, largely driven by U.S. natural gas production. 24 Although disjunct from Cancer Alley, Calcasieu Parish (southwest Louisiana) is, in a sense, the epicenter of the Louisiana's environmental justice efforts, with the highest industrial emissions in the state by a wide margin. 25
In both Cancer Alley and southwest Louisiana, there are major gaps in the air monitoring network maintained by the Louisiana Department of Environmental Quality (LDEQ) to determine compliance with federal air quality standards. For example, LDEQ has no PM2.5 monitors in five of the 11 Cancer Alley parishes (Ascension, Plaquemines, St. Charles, St. James, and St. John the Baptist), four of which also lack a monitor for nitrogen oxides (NOx), another type of pollutant of major concern for respiratory health. 26 Although these “gold-standard” monitors are needed to ensure that air quality meets federal standards, pollution disparities can be identified by using data from emissions inventories 27 or satellite measurements. 28
From an environmental justice perspective, the existence of a pollution disparity is sufficient to warrant corrective action, regardless of the cause(s) of that disparity. Specifically, according to EPA, environmental justice requires that “no group of people, including a racial, ethnic or a socioeconomic group, should bear a disproportionate share of the negative environmental consequences from industrial, municipal and commercial operations or the execution of federal, state, local and tribal programs and policies.” 29 Thus, basic, exploratory research (including the study reported here) is needed to identify environmental disparities, independent of understanding their underlying driver(s). However, no study (to our knowledge) has evaluated the existence of pollution disparities in Cancer Alley since 2013, when toxic facilities were reported to be disproportionately located in Black and low-income communities (7). To our knowledge, the only other study to examine pollution disparities in Cancer Alley used data from the 2005 National Air Toxics Assessment and found that Black American and low-income communities are overburdened with air pollution. 30
Here, we explore the relationships among pollution, race, socioeconomic status, and per capita COVID-19 death rates in Louisiana (through July 17, 2020) and examine long-term, statewide trends in PM2.5 pollution. We present two parallel disparity analyses, one at the census tract level (excluding COVID-19 data) and one at the parish level (including COVID-19 data, which are unavailable at a finer geographic scale). For both analyses, we use two independent measures of pollution burden: satellite-derived PM2.5 estimates 31 and EPA estimates of health risks (i.e., respiratory hazard [RH] and immunological hazards [IHs]) from the combined effects of all modeled air pollutants. 32 We chose these hazard indices given their relevance to COVID-19 susceptibility. 33 We predicted that pollution burden would be positively correlated with the percentage of Black residents in the population and with measures of economic hardship. Further, we predicted that parish-level per capita COVID-19 death rates would be positively correlated with pollution burden, percentages of Black residents, and economic hardship. Our goals were to identify any existing pollution/COVID-19 disparities and determine whether Louisiana's PM2.5 pollution levels (from industrial and nonindustrial sources) have changed over the past several decades.
Methods
Data sources and calculations
We obtained the most recent data available from the following sources: parish-level COVID-19 data through July 17, 2020 from the Louisiana Department of Health 34 ; estimated PM2.5 emissions for all available years (1990, 1996–2017) from the 2017 National Emissions Inventory 35 ; population data from the U.S. Census Bureau's 2014–2018 American Community Surveys (5-year estimates); 2014–2016 diabetes and obesity prevalences from the U.S. Centers for Disease Control's Diabetes Surveillance System 36 ; and smoking data from the U.S. CDC's Behavioral Risk Factor Surveillance System 2017 survey. In addition, we obtained RH Index and IH Index by census tract from the 2014 National Air Toxics Assessment. 37 The EPA calculates these hazards as the ratio of exposure concentration to reference concentration (i.e., no adverse health effects expected), with pollutant-specific hazard values summed for each organ system. 38 We used tract-level hazard data to calculate the population-weighted mean for RH and IH at the parish level. We obtained annual mean PM2.5 estimated concentrations (1° × 1° resolution) for the years 2000–2016 from vanDonkelaar et al. 39 We generated long-term (2000–2016) PM2.5 averages at the census tract level by using the RasterStats plug-in in QGIS. Per capita COVID-19 death rates were calculated as: parish death count/parish 2019 population estimate. 40 We report death rates per 10,000 population.
Disparity analyses
For disparity analyses, we included factors that, based on previous research, 41 might be related to COVID-19 death rates or pollution burden. These factors included: percent white (one race, including Hispanic), percent Black (one or more races), unemployment rate, poverty rate, percent of the population aged 65 and older, percent of seniors (aged 65+) living in poverty, percent of current smokers (adults), percent of diabetes (adults), percent of obese (adults), population density, and the number of days since the first reported COVID-19 case in the parish. As described earlier, pollution estimates included PM2.5, RH, and IH. In addition, we included RH and IH values from stationary point sources only (spRH and spIH), which excludes contributions from wildfires, vehicles, households, and other small, transient, or mobile sources.
For each dataset, the distribution of the data was evaluated by using the Shapiro-Wilks test for normality and visually inspected by using normal quantile-quantile plots in R. When there was evidence of non-normality (i.e., Shapiro-Wilks p < 0.05), the data were transformed by using a custom transformation identified using Tukey's Ladder of Powers function in the rcompanion package of R. Data transformations and corresponding Shapiro-Wilks p-values are provided in Appendix Table A1. Census tract-level pollution data were severely non-normal, and the distribution was not improved by transformation. Thus, all census tract-level data were analyzed by using a nonparametric test, as described later.
To identify parish-level disparities related to COVID-19, we evaluated the relationship between the per capita COVID-19 death rate and each of the factors mentioned earlier by using Pearson's correlation after transforming non-normal data (Appendix Table A1). We conducted a parallel analysis to understand pollution disparities at the census tract level by using Spearman's (nonparametric) correlation. Health data (i.e., COVID-19 deaths, diabetes, obesity, and smoking) were not available at the census tract level and were thus omitted from the census tract-level analysis. All results were significant at the 0.05 level. IRB approval was not required because this study relied entirely on publicly available data.
Analyses of PM2.5 over time in Louisiana
We examined both PM2.5 emissions and PM2.5 ambient (i.e., outdoor air) concentrations in Louisiana by using all available years of data in our datasets (i.e., 1990 and 1996–2017 emissions data [44] and 2000–2018 ambient concentrations [40]). To better understand the relative contribution of Louisiana's industries to PM2.5 emissions, we combined emissions data from industrial subcategories and plotted these values relative to nonindustrial categories by using Microsoft Excel. Industrial subcategories included chemical manufacturing, metals processing, petroleum processes, other industrial manufacturing (e.g., paper production), fuel combustion from industrial facilities, and storage and transport of industrial materials. We did not report separate industrial subcategories, because industry sectors are not fully broken down for each category in this dataset (e.g., “industrial fuel combustion” includes emissions from multiple industries). Nonindustrial sources included: vehicles (combined highway and off-highway), fuel combustion from electric utilities, fuel combustion from other sources, waste disposal and processing, solvent use, wildfires, prescribed burns, and miscellaneous sources (e.g., asphalt paving, construction, and human cremation). It should be noted that the nonindustrial category includes some contributions from industrial-related activity (e.g., waste disposal, construction, or vehicles). Because wildfires and prescribed burns were only reported separately (from miscellaneous) after the 1990s, we included these categories in miscellaneous sources. We included solvent use in the miscellaneous category, because its emissions were too small to be visualized in a graph.
Results
Relationships among air pollution burden, race, and poverty in Louisiana at the census tract level
Louisiana census tracts with larger percentages of Black residents had higher pollution burdens (PM2.5, RH, spRH, and IH; Fig. 1 and Table 1). Higher unemployment rates also were associated with increased pollution burden (PM2.5, RH, and IH), whereas poverty was negatively correlated with some measures of pollution burden (RH and IH; Table 1). Conversely, most or all measures of pollution burden were lower in census tracts with larger percentages of whites or larger percentages of senior citizens, respectively (Table 1).
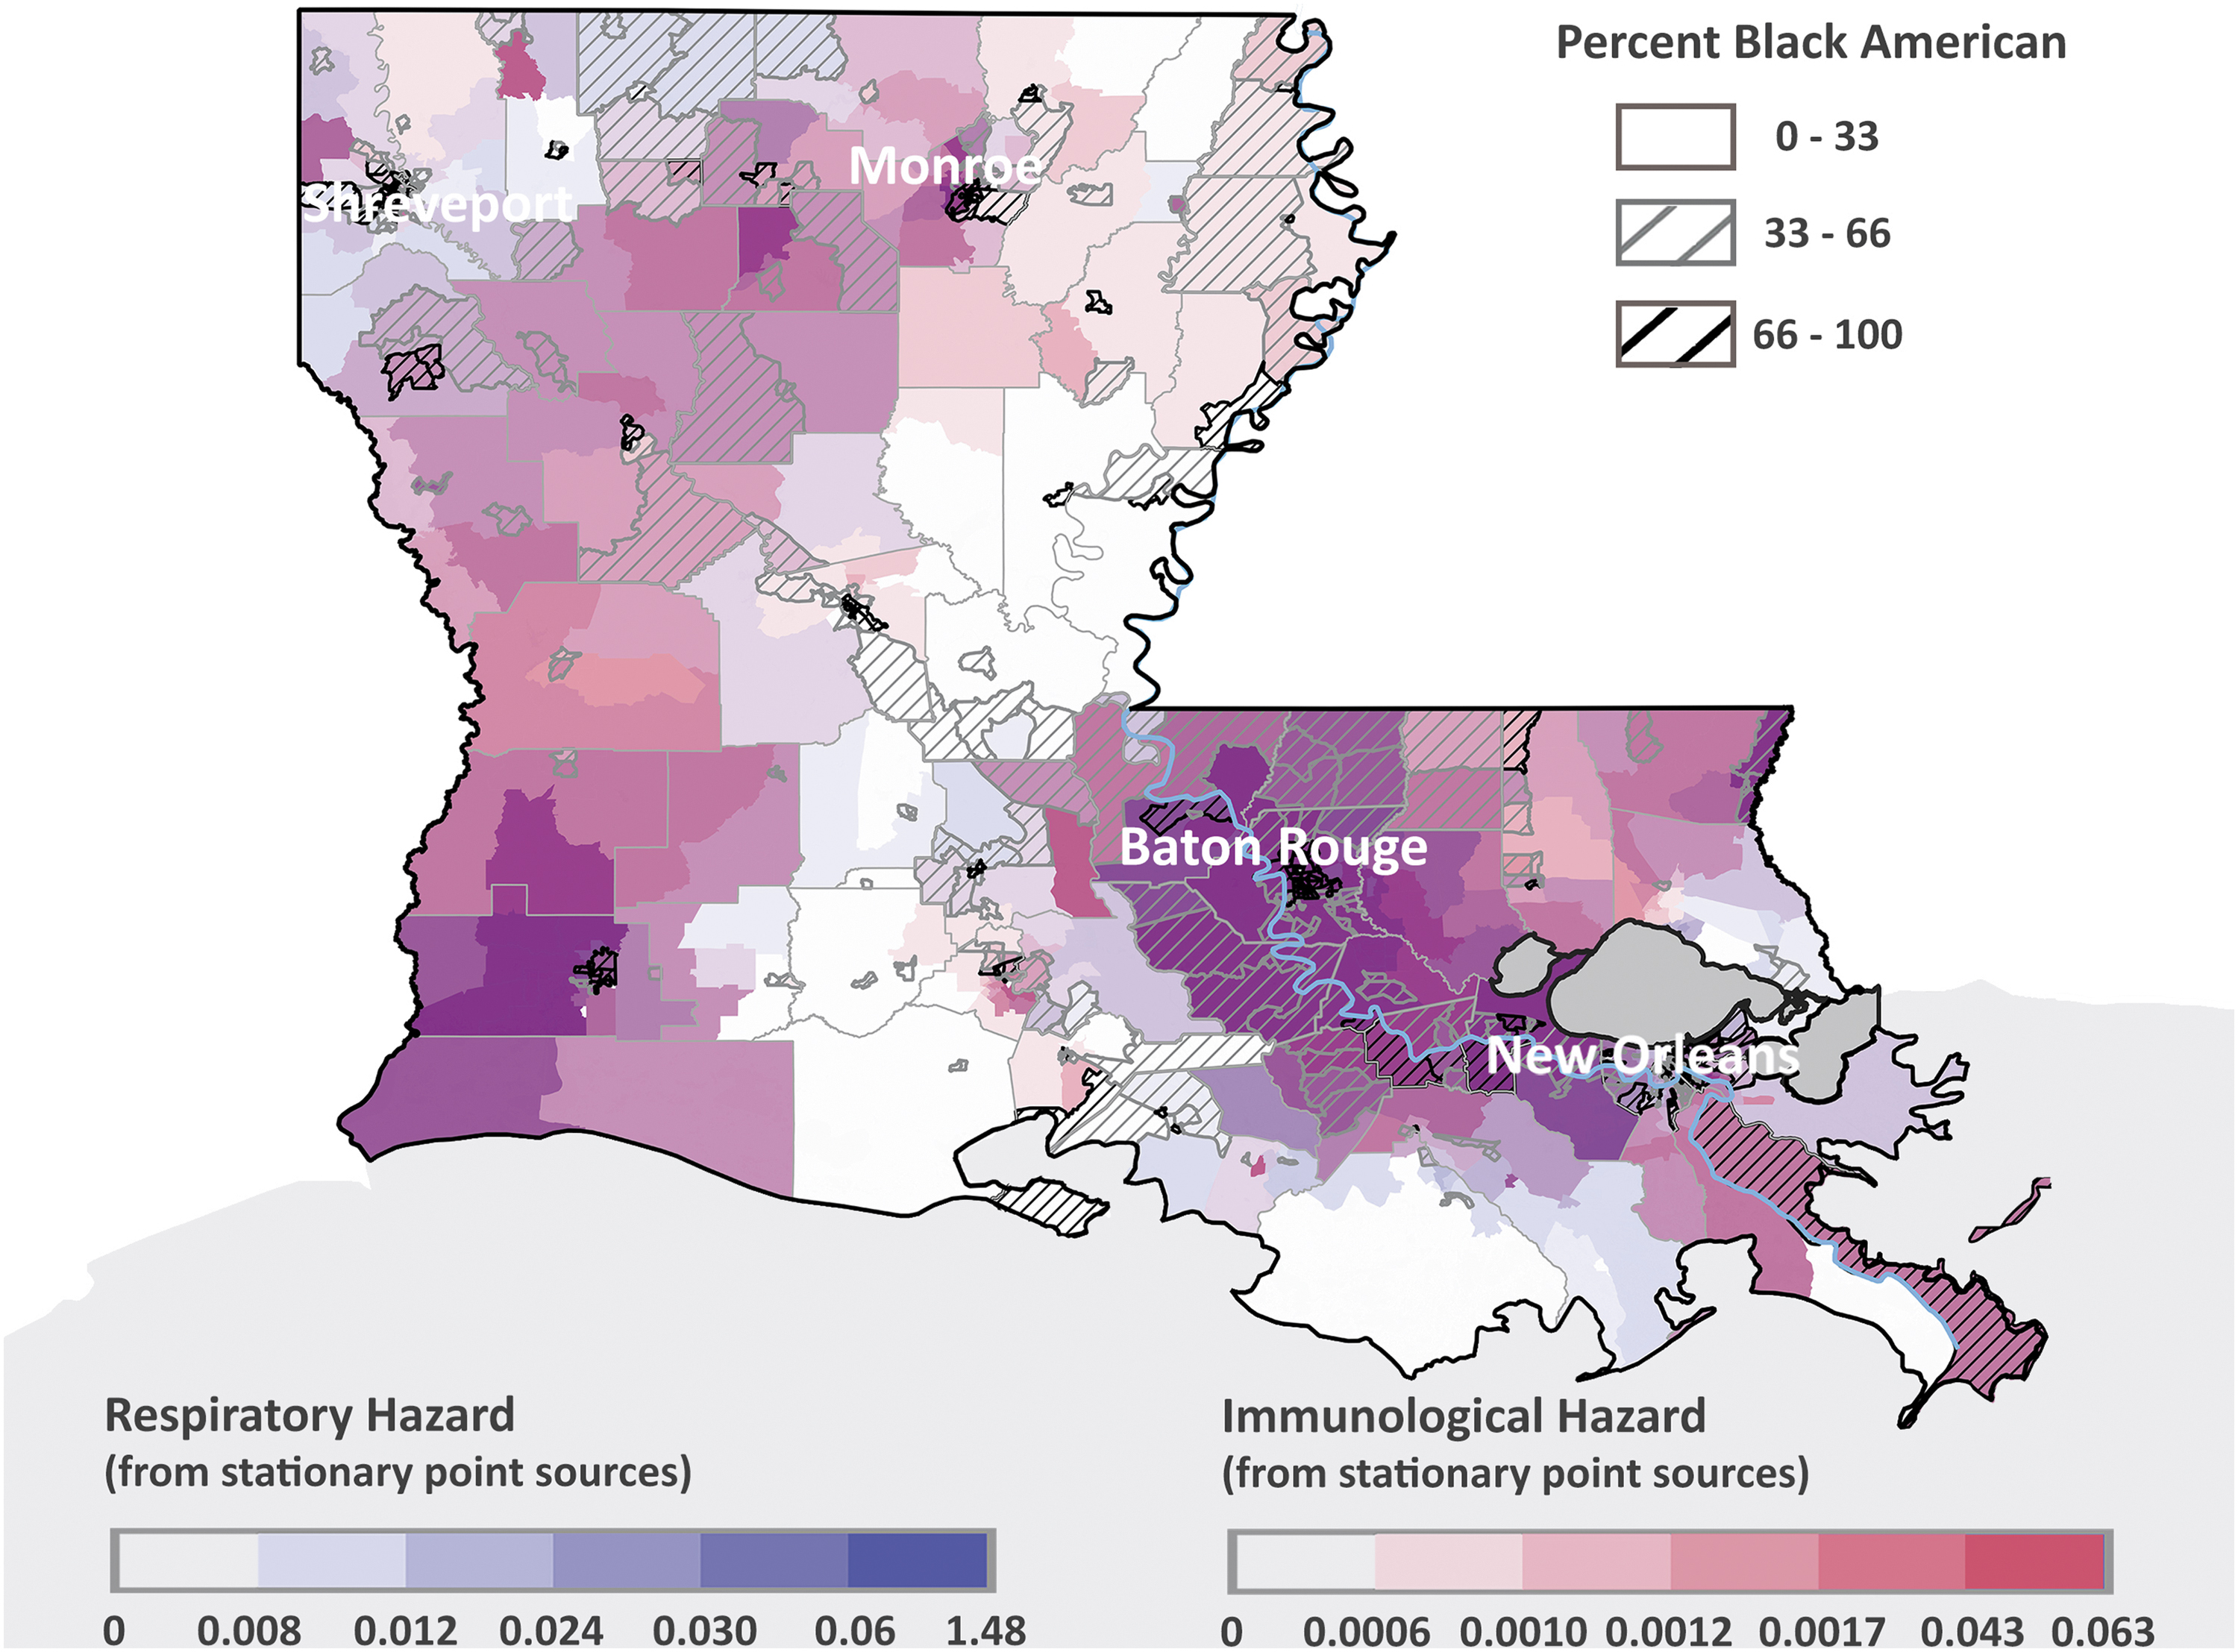
RH, IH, and percentage of Black American residents by census tract. Hazards are from the most recent (2014) National Air Toxics Assessment and reflect stationary point sources of pollution only (i.e., excluding vehicles and other mobile or nonpoint sources). Hazards are broken down by quantile. IH, immunological hazard; RH, respiratory hazard.
Spearman's Correlations Among Pollution, Race, and Poverty in Louisiana at the Census Tract Level
Statistically significant (p < 0.05), positive associations are emphasized with red text; rho = Spearman's coefficient; p = significance value. (Higher absolute rho values indicate a stronger linear relationship, whereas lower p-values indicate a more statistically significant relationship.)
Mean of annual ground-level concentrations from 2000 to 2016; n = 1079 census tracts.
From the 2014 National Air Toxics Assessment; n = 1126 census tracts.
NA, not applicable because the relationship is nonsignificant, and there is no tendency toward significance (i.e., p > 0.10).
COVID-19 death rates relative to pollution estimates, race, and poverty in Louisiana at the Parish level
With two exceptions (Tensas and Cameron parishes), every parish in Louisiana had reported at least one COVID-19 related death by July 17, 2020. Six of the 10 parishes with the highest COVID-19 death rates in Louisiana through July 17, 2020 were in Cancer Alley: St. John the Baptist, St. James, Orleans, Iberville, West Baton Rouge, and Jefferson (Table 2). Among these parishes, COVID-19 death rates were 2.1- to 3.7-fold above the state median; by contrast, only 4 of the 53 parishes outside Cancer Alley were in this top 10 group, 2 of which were adjacent to Cancer Alley Parishes (Table 2). Across all parishes, increased per capita COVID-19 death rates were associated with higher spRH, IH, and spIH (Table 3 and Fig. 2A, B). In addition, increased COVID-19 death rates tended (p = 0.088) to be associated with higher long-term (2000–2016) PM2.5 concentrations (Table 3). Higher death rates also were associated with higher percentages of Black residents (Fig. 2C), greater population density, and more days since the first reported COVID-19 case among parishes (Table 3). No other factors were significantly associated with per capita COVID-19 deaths among parishes, including the prevalence of diabetes and poverty (Table 3 and Appendix A2).
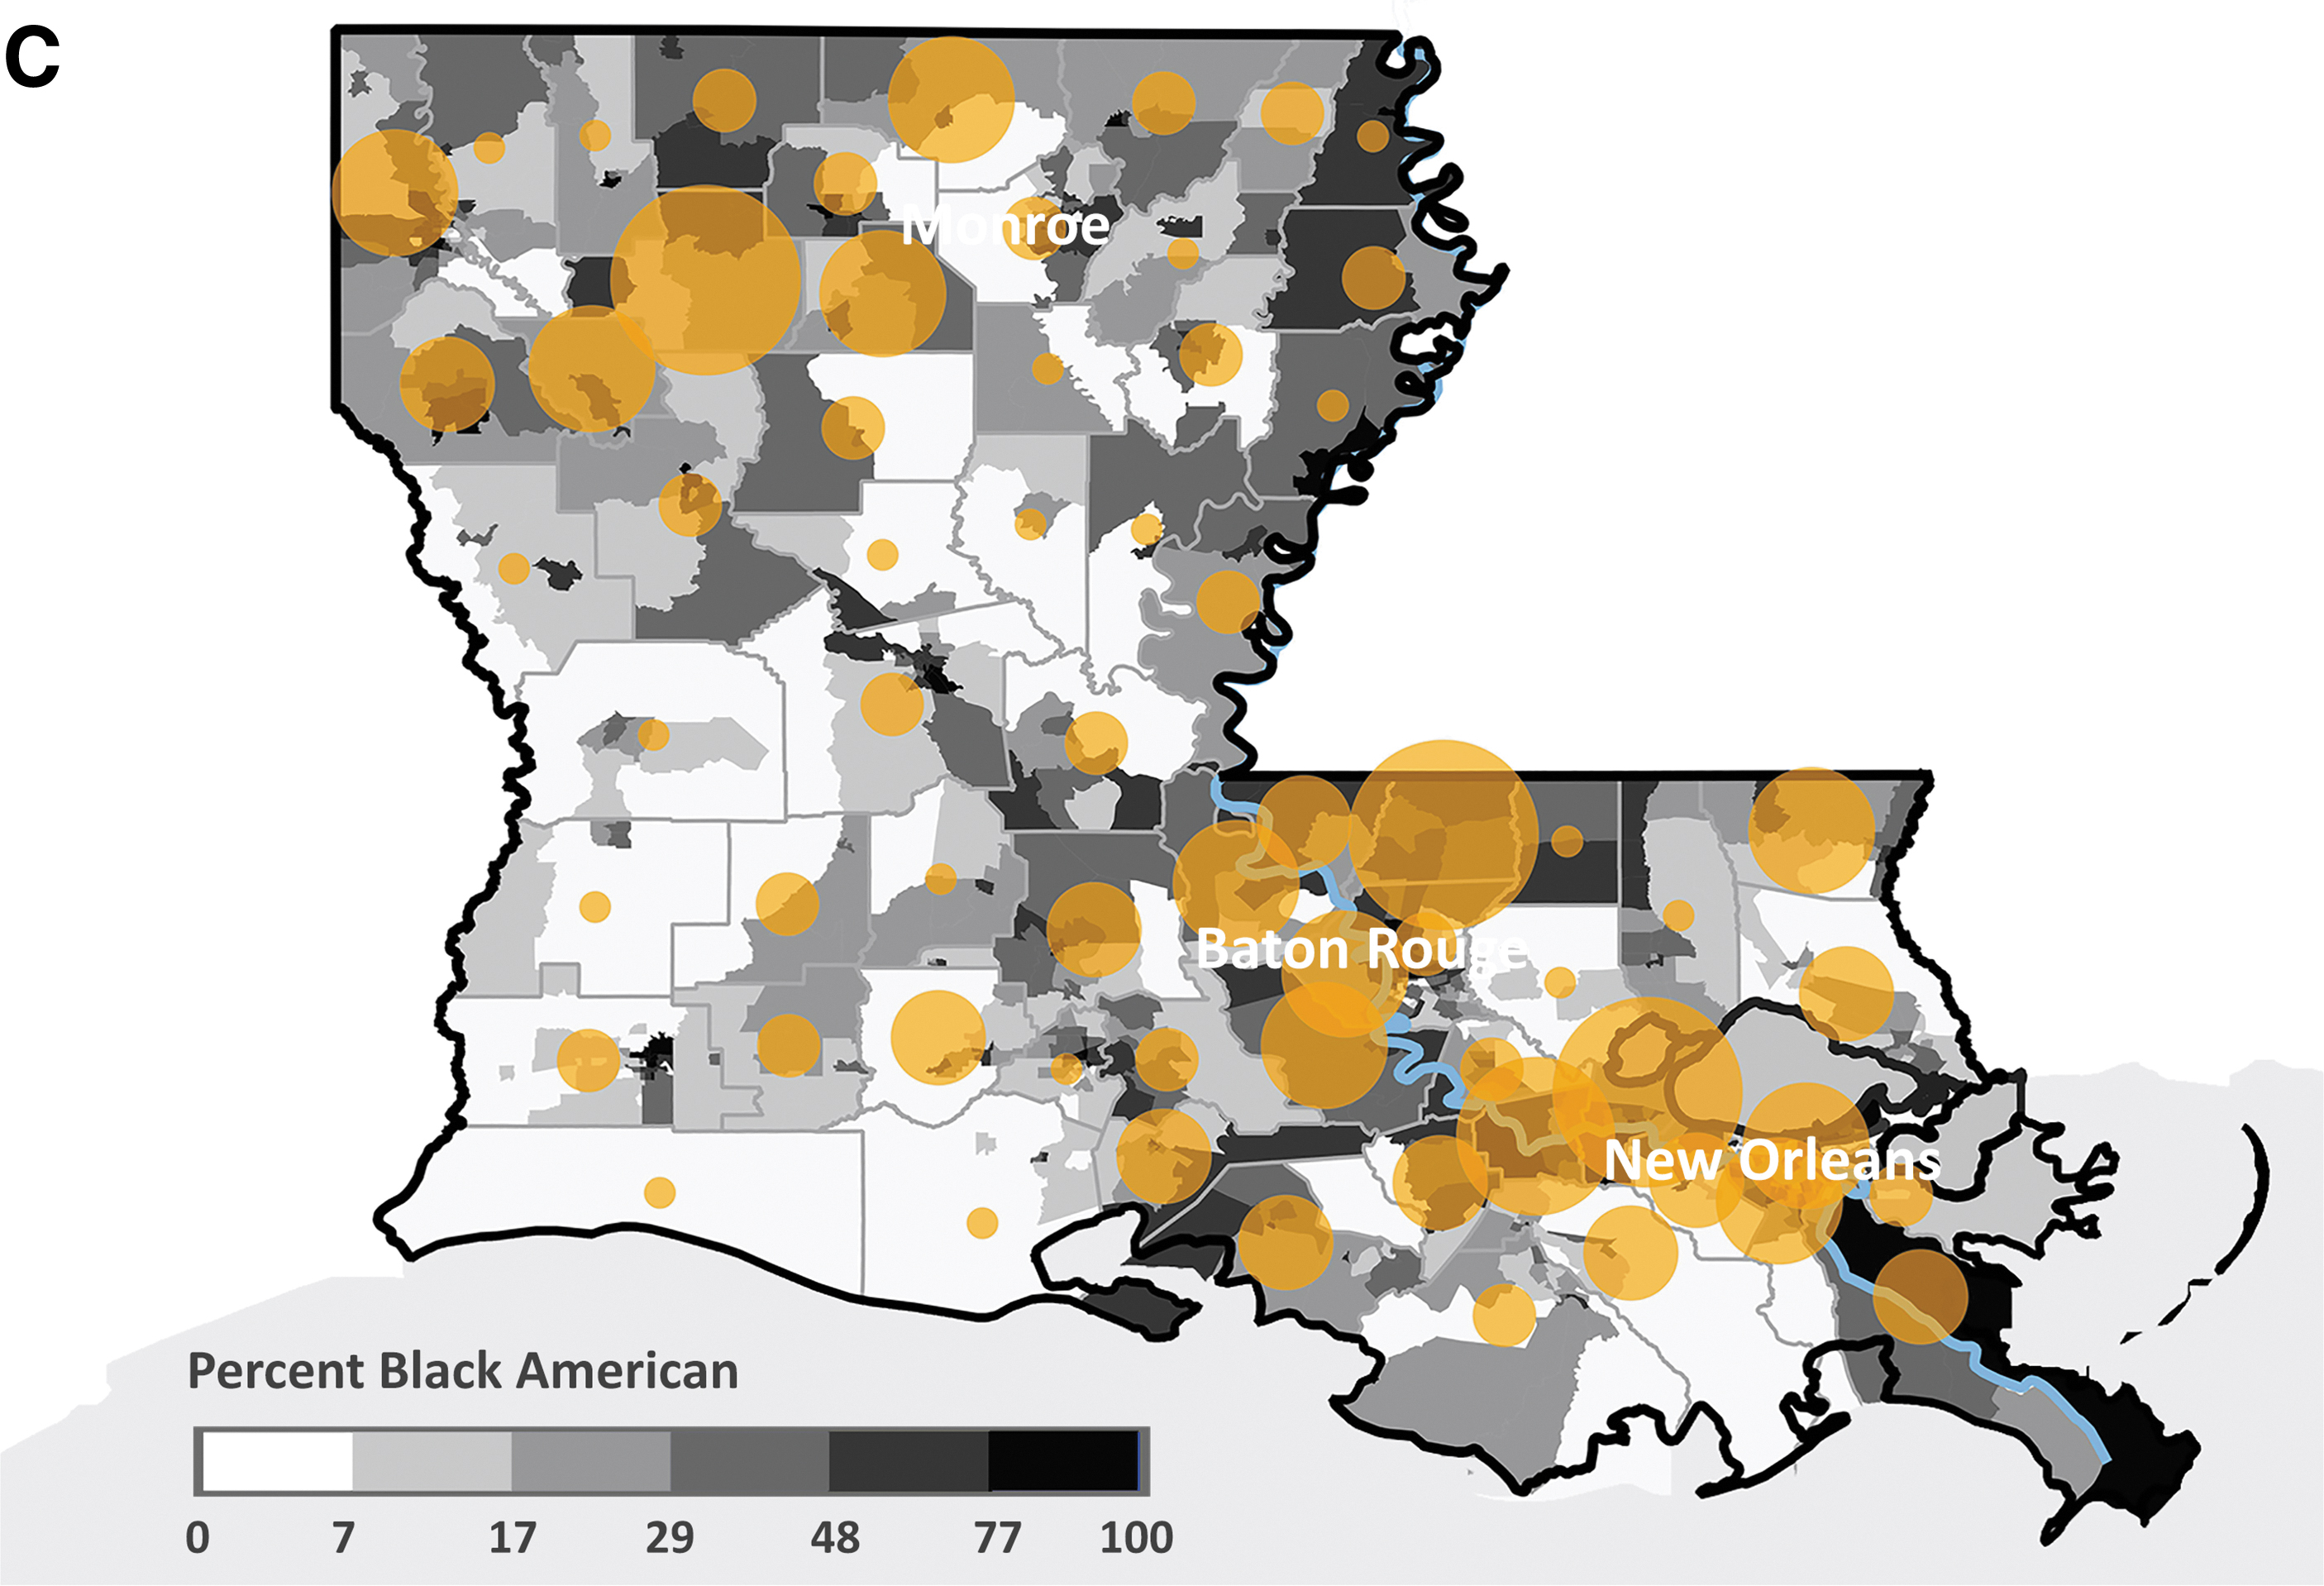
Geographic distribution of per capita COVID-19 death rates (reported through July 17, 2020), relative to RH
Parishes with the 10 Highest Per Capita COVID-19 Death Rates in Louisiana, as of July 17, 2020
Out of 64 parishes in Louisiana (n = 11 Cancer Alley parishes).
Pearson Correlations with Parish-Level per Capita COVID-19 Death Rates, as of July 17, 2020
n = 64 parishes; statistically significant (p < 0.05) positive associations are emphasized with red text; r = Pearson's coefficient; p = significance value. (Higher r values indicate a stronger linear relationship, whereas lower p values indicate a more statistically significant relationship.)
Analyzed using Spearman's correlation, as data were non-normally distributed and transformation did not improve normality.
IH, immunological hazard; NA, not applicable because the relationship is nonsignificant, and there is no tendency toward significance (i.e., p > 0.10); PM, particulate matter; RH, respiratory hazard.
Long-term changes in emissions and ground-level concentrations of PM2.5 in Louisiana
Annual PM2.5 emissions (all sources combined) in Louisiana decreased 17% overall from 1990 to 2017, based on National Inventory Trends Data (Fig. 3A). Total industrial PM2.5 emissions were similar between 1990 and 2017, but with large variations in the interim (Fig. 3B). Some of this fluctuation may be due to reported changes in EPA's estimation methodology. 42 Vehicle PM2.5 emissions decreased progressively from 1990 to 2017, dropping 75% overall (Fig. 3B). Fuel combustion from electric utilities decreased overall by 67%, whereas fuel combustion from other sources (i.e., residential, commercial, and institutional) gradually declined by 68% across this period (Fig. 3B). Industrial sources accounted for 20% of Louisiana's total PM2.5 emissions in 1990, but they accounted for 25% in 2017 (Fig. 3A). From 2014 to 2017, overall emissions declined by 20%, vehicle emissions declined by 29%, and emissions from nonindustrial fuel combustion declined by 18%, whereas industrial PM2.5 emissions increased by 33% (Fig. 3B).

Emissions of PM2.5 over time by source category with
Surface-level PM2.5 concentrations declined statewide from 2000 to 2015, based on modeled satellite data (Fig. 4A). These concentrations subsequently increased from 2016 to 2018 across southern Louisiana (Fig. 4A). From 2000 to ∼2015, Louisiana's major cities were PM2.5 pollution hotspots (from south to north): New Orleans, Lake Charles, Lafayette, Baton Rouge, Alexandria, Shreveport, and Monroe (Fig. 4 A, B). In 2017 and 2018, the highest levels of PM2.5 pollution occurred over a broad swath of south Louisiana and were no longer concentrated in cities (Fig. 4A).
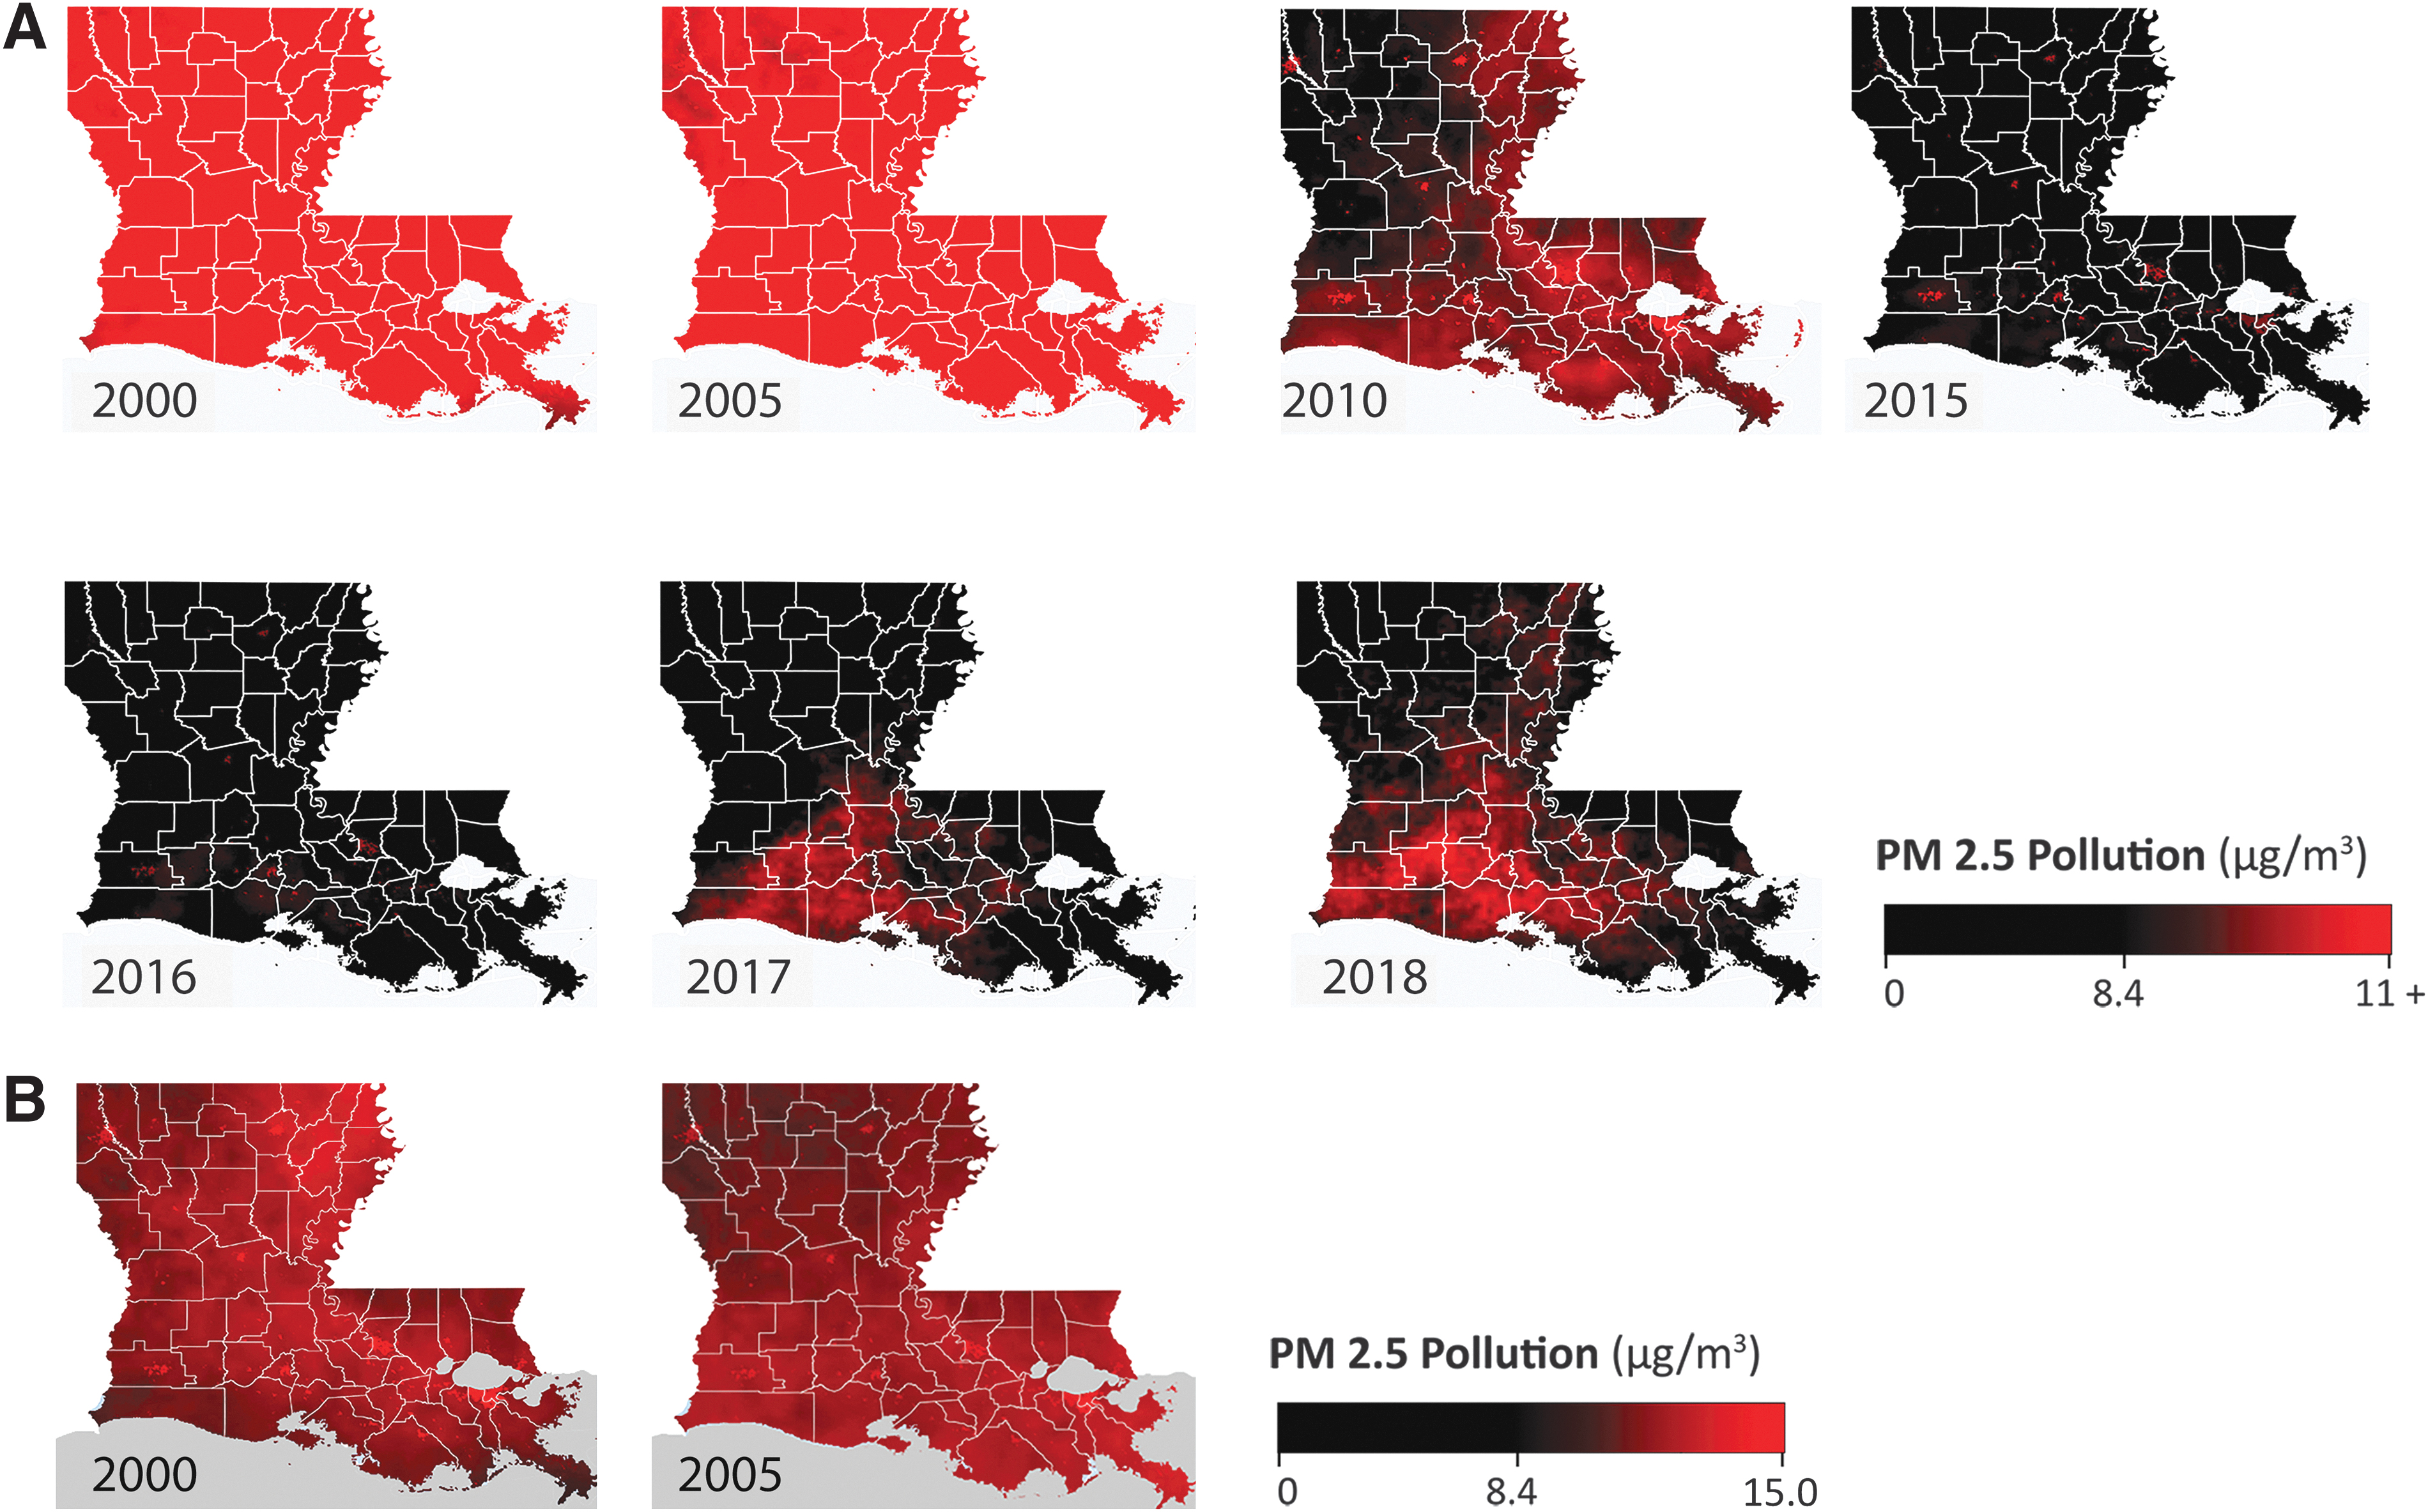
Levels of PM2.5 in Louisiana over time, relative to the overall U.S. long-term average (8.4 μg/m
3
; from Wu et al., 2020), with the upper limit of the scale set to illustrate changes over time
Discussion
Our analysis yielded three major findings. First, Black communities and economically disadvantaged communities in Louisiana continue to be overburdened with pollution and the associated health risks. Second, increased per-capita COVID-19 death rates among Louisiana parishes are associated with higher estimates of pollution burden and larger percentages of Black residents. In other words, Louisiana's communities of color have long been overburdened with air pollution and are now overburdened with COVID-19. These COVID-19 associations were not driven by the prevalence of diabetes, obesity, or smoking. Finally, Louisiana's patterns of PM2.5 pollution have changed dramatically over time, with vehicle emissions declining substantially, industrial sources becoming a relatively larger fraction of PM2.5, and the state recently losing ground on long-term air quality improvements.
Our findings are consistent with previous research demonstrating racial and economic disparities in pollution burden in Cancer Alley, using other datasets. Specifically, James et al. (2012) demonstrated that air pollution in this region disproportionately affects socially disadvantaged and racial minority communities, using Cancer Risk estimates from the EPA's 2005 National Air Toxics Assessment (NATA). Perera and Lam (2013) reported that Cancer Alley communities located close to toxin-emitting facilities were disproportionately minority and disproportionately impoverished, using EPA Toxic Release Inventory data. In this study, we relied on long-term PM2.5 concentrations estimated from satellite data, 43 as well as on RH Index and IH Index from the EPA's most recent (2014) NATA. Thus, there are now at least three independent datasets that provide evidence of racial and socioeconomic disparities in pollution burden in Louisiana. Although the correlation coefficients reported here are generally low, these values indicate the strength of the linear relationship between two variables. It is important to consider that these relationships may be more complex than a simple linear association. For example, the relationship between pollution and race may be different for heavily polluted areas compared with moderately polluted areas. Fully characterizing the nature of these relationships was beyond the scope of this exploratory analysis, but it is a priority for future research and may provide insight into the drivers of pollution and COVID-19 disparities in Louisiana. Further, these relationships should be explored by using finer-scale COVID-19 data (e.g., from census tracts), once that information becomes available from the Louisiana Department of Health.
Understanding temporal changes in pollutant concentrations and the relative contributions of different emission sources may help address pollution disparities. We found that, overall, concentrations of PM2.5 have declined substantially in Louisiana overall the past two decades (Fig. 4A). This decline has manifested in two ways: the disappearance of PM2.5 hotspots from cities and lower PM2.5 levels across the entire state (Fig. 4 A, B). Contributing factors likely include the decommissioning of coal-fired power plants in the broader region 44 and the observed 75% reduction in vehicle emissions since 1990 (Fig. 3). By contrast, industrial emissions remained relatively unchanged in 2017 compared with 1990, despite substantial variation in the interim (Fig. 3). Thus, we found no evidence that industrial sources are responsible for the steady decline in PM2.5 concentrations observed in Louisiana from 2000 to 2015.
Lowered PM2.5 concentrations have not been maintained in all regions of Louisiana; the southern part of the state (including Cancer Alley) has, in the last couple of years, lost ground on long-term improvements in PM2.5 (Fig. 4). Although identifying the reasons for this trend is beyond the scope of our study, we note that industrial PM2.5 emissions (from all sources combined) increased by a third from 2014 to 2017, the most recent year for which data are available (Fig. 3). Regardless, our findings directly contradict the Louisiana petrochemical industry's current focus on vehicle emissions as a major source of PM2.5 pollution in Louisiana 45 and refute the narrative that “growing industry is actually causing emissions to go down, not up.” 46 Importantly, our study indicates that pollution disparities in Louisiana are not simply the result of vehicle emissions or urbanization, because disparities persisted when pollution data (RH) were limited to stationary point sources (e.g., excluding vehicles and residences; Tables 1 and 3). Importantly, health risks from stationary point sources (i.e., spRH and spIH) also were associated with higher per capita COVID-19 death rates (Table 3). Collectively, these findings are consistent with well-publicized concerns that toxin-emitting industrial facilities represent a serious health threat and are disproportionately impacting impoverished Black communities in Cancer Alley. 47
Although Cancer Alley communities and their allies have been fighting for environmental justice for decades, the COVID-19 pandemic highlights the urgency of this issue. Louisiana's pollution disparities are evidenced by multiple independent data sources, including those reported here, and it is imperative that environmental decision makers and public health professionals in Louisiana acknowledge and address these inequities. Central to this goal is the need for more extensive air quality monitoring in Louisiana. The current network of monitors operated by the LDEQ is grossly inadequate. For example, LDEQ monitors PM2.5 levels at only 20 sites across the state (an area of more than 52,000 square miles). 48 The lack of air quality data in Louisiana is particularly conspicuous in Cancer Alley, with only one PM2.5 monitor for determining National Ambient Air Quality Standards (NAAQS) compliance along the ∼130 river-mile stretch of the Mississippi River in between Baton Rouge and Jefferson Parish. 49 Public access to reliable, continuous local air quality data is essential to promoting public health and environmental justice in vulnerable communities. Our study emphasizes the value of this information, as well as the need to consider long-term exposure to certain pollutants (i.e., those posing RHs or IHs) as a risk factor for respiratory disease, including COVID-19. Framing pollution in this context will help advance public health efforts for communities worldwide, including those in Cancer Alley, that are overburdened with pollution.
Footnotes
Acknowledgments
The authors thank the Concerned Citizens of St. John for their role in initiating this study. Constructive feedback from Lisa Jordan, Director of the Tulane Environmental Law Clinic, and several anonymous reviewers helped strengthen this article. These foundations had no role in the design, analysis, or interpretation of this research.
Author Disclosure Statement
No competing financial interests exist.
Funding Information
Funding was provided by the McKnight Foundation. (Grant No. 17-487) and the Deer Creek Foundation (Grant No. 1913B).
Appendix
Transformations and Resulting Shapiro-Wilk p-Values for Parish-Level Data
| Variable | Transformation | Normality p-Value (Shapiro-Wilks) a | |
|---|---|---|---|
| Before transformation | After transformation | ||
| COVID-19 deaths per 10,000 people (deaths) | Deaths^0.525 | 0.0005 | 0.93 |
| Percent Black | None b | 0.26 | NA |
| Percent White | None b | 0.37 | NA |
| RH | Remove the bottom three outliers (RH <0.44), then −1 × RH^(−2.775) | 8.7 × 10⁻⁷ | 0.13 |
| RH from stationary point sources only (pRH) | −1 × pRH^(−0.075) | 1.1 × 10⁻¹³ | 0.12 |
| Mean PM2.5 | None b | 0.23 | NA |
| IH | −1 × IH^(−1.425) | 1.7 × 10⁻⁶ | 0.15 |
| IH from stationary point sources only (pIH) | pIH^(0.05) | 3.2 × 10⁻⁹ | 0.39 |
| Percent 65 plus | None b | 0.46 | NA |
| % Diabetes (D) | −1 × D^(−0.75) | 0.03 | 0.62 |
| % Obese | None b | 0.62 | NA |
| % Smokers (S) | −1 × S^(−1.75) | 5.5 × 10⁻⁵ | 0.025 |
| Population density | −1 × PD^(−0.2) | 1.4 × 10⁻¹⁴ | 0.76 |
| Days since first case | DSFC^4.95 | 0.001 | 0.02 |
| % Unemployed | None b | 0.15 | NA |
| % Poverty | POV^0.025 | 0.001 | 0.39 |
| % Seniors in poverty (sPOV) | −1 × sPOV^(−0.025) | 0.003 | 0.99 |
p < 0.05 indicates that data are non-normally distributed.
Data not transformed because distribution is approximately normal.
^is a mathematical symbol that means “to the power of” (i.e. it denotes an exponent).
DSFC, days since first case; IH, immunological hazard; PD, population density; PM, particulate matter; POV, poverty; RH, respiratory hazard; sPOV, seniors in poverty.