
Abstract
Previous studies have cited the sociocultural and environmental benefits of urban farming that acts as an effective strategy to address food disparities and sustainability. However, environmental justice advocates have raised concerns regarding the harmful effects that heavy metals from neighboring environmental hazard facilities may have on urban farms. This study utilized geographic information system mapping to track environmental hazards and urban farm locations, spatial analyses to assess proximity of urban farms to sites that emit heavy metals and other pollutants, and statistical analysis to determine the likelihood of urban farms and hazardous sites to collocate with communities of color and low socioeconomic status populations. Analyses indicated that contamination of urban farms in Baltimore City is a possibility due to proximity considerations: more environmental hazards were found in census tracts featuring an urban farm than those that did not, low-income communities of color featured environmental hazards sited in proximity to an urban farm, and a higher concentration of environmental hazards with heavy metal or unknown contamination was found in historically industrial areas. This study indicates that urban planning should consider proximity to current environmental hazards, sociodemographics of the community, and the history of sites before implementing urban farming.
INTRODUCTION
Urban agricultural practices have been defined as the “growing, processing, and distribution of food and non-food plant and tree crops in farmlands that are mainly located on the fringe of an urban area.” 1 Institutional efforts to accommodate and promote urban agriculture within U.S. cities are gaining momentum. 2 Land inventories are being employed by municipal governments to support urban agriculture projects, 3 and several cities have revised policies and zoning ordinances to accommodate the changing land use. 4 Nonprofits and municipal governments in cities are creating food policy councils, many of which include elements to strengthen urban agriculture. 5 One study reports that urban agriculture continues to grow as a planning priority, with several cities and counties including local food elements and urban agriculture in their comprehensive plans. 6
Renewed interest from institutions and municipalities in urban agriculture should be considered alongside the history of urban agriculture among low-income communities and communities of color, who have long understood the benefits of agriculture at such a scale. 7 Historically, inequitable planning and zoning policies have put certain populations at a disadvantage, including people of color, immigrants, and the poor. 8 These zoning policies exclude these populations from access to necessary resources and infrastructure, including supermarkets that provide nutritious food at an affordable price.
To combat these inequities in the food system and continue agrarian traditions, these communities have long employed urban growing practices. 9 Many scholars have noted that contemporary urban agricultural practices have been exclusionary to these populations and have ignored the history of agricultural practices among these communities. 10
Despite its growing momentums and in light of various histories, urban farming is not without possible negative effects on urban communities. Recent trends in industrial urban agriculture have resulted in gentrification of urban centers, as the introduction of commercial farming supports businesses that attract a wealthier Whiter population. The implementation of large urban farms has been determined to correlate with increased rent prices and an increase in discomfort for low-income residents and residents of color in these areas. 11
In contrast, there are many benefits of urban agriculture, including sociocultural 12 environmental sustainability, 13 food security, 14 and economic development. 15 Growing evidence suggests that incorporating agriculture into the urban environment will greatly improve the sustainability of cities. 16 Urban agriculture has the potential to increase biodiversity and green space. 17 Urban farms can facilitate drainage of water and reduce the urban heat island effect. 18 Urban farms also provide public health benefits by providing greater access to fresh organic produce, 19 a space for recreation, 20 and mental health benefits. 21
Despite growing interest in urban farms, concern about the presence of real or perceived contamination persists. 22 Urban environments are variably contaminated with metals and persistent organic pollutants due to human activities, including transportation, fossil fuel combustion, and incinerator emissions. 23 Urban farm soils can be contaminated with lead (Pb), cadmium (Cd), arsenic (As), and mercury (Hg). 24
Urban soils have the potential to be sinks for heavy metal contaminants due to industrial and historic traffic emissions, waste incineration, and use of Pb-based paint for residential and industrial purposes. 25 In Charleston, South Carolina, researchers found a high concentration of trace metals in areas near heavily trafficked roads, an incinerator, Superfund sites, and metal recyclers. 26 A 2006 study found that concentrations of heavy metals in urban soil were between two and four times higher than those in rural soils. 27
The city of Baltimore is an urban area with a history of environmental injustice and contamination due to legacy pollution from industrial hazards and prior uses of Pb. Most of the housing stock was built before 1950 when Pb-based paint was used ubiquitously. 28 Between 1950 and 2016, the city's population fell from 949,708 to 614,664. 29 The depopulation of Baltimore has resulted in ∼16,000 vacant buildings and 14,000 vacant lots throughout the city. 30
The threat of Pb exposure persists even when houses are vacant, as demolition of vacant buildings has become standard practice in urban areas including Baltimore. 31 As buildings containing Pb hazards are demolished, Pb dust is released into the surroundings and poses a threat to community health. 32 Research has shown that houses that once contained Pb paint can serve as environmental health hazards if the Pb paint was simply covered with regular paint, as the Pb paint can deteriorate as the house continues to age, elevating the threat of Pb-related hazards. 33
A study in Baltimore, MD, found that Pb contamination in urban soil also stemmed from emissions from vehicles that used leaded gasoline. 34 Although the use of leaded gasoline has decreased in the past two decades, studies have shown that Pb emissions from motorized vehicles have been problematic across the world. 35 Heavily trafficked roads in urban areas can be sources of several soil contaminants, including toxic metals from vehicle exhausts, tire particles, corrosion of vehicle body work and road markings, and brake and clutch dust. 36 Research has shown that the city center is most exposed to traffic pollution due to pollution from I-83 highway and nearby neighborhoods with condensed traffic activity. 37
The research on Pb paint and vehicular emissions within Baltimore demonstrates that heavy metal soil contamination is a public health concern, and raises questions with respect to urban agriculture. Although heavy metal exposure often is a result of accidental ingestion of contaminated soil, heavy metal contamination of soil and urban-grown produce may pose exposure and health risks for populations who reside near these locations or consume the produce. 38 Thus, it is important to examine the proximity of emitters such as toxic release inventory (TRI) facilities, Superfund sites, land restoration program sites (LRPs), and brownfields to neighborhoods that feature urban farms. Because of urban farming's implications on food access and sovereignty, potential contamination of urban farms should be considered an environmental justice issue.
The aim of this study was to assess the proximity of known heavy metal contamination sites to urban farms within Baltimore City as a means to approximate exposure. LRPs, Superfund sites, brownfields, and TRI facilities that featured Hg, Pb, As, Cd, and chromium (Cr) contamination were regarded as “known heavy metals” sites. This study assessed the proximity of urban farms to known heavy metal contamination sites by mapping relevant LRPs, Superfund sites, brownfields, TRI facilities, and urban farming operations within Baltimore City. In addition, this study used spatial and statistical analyses to determine whether urban farms and contaminated sites were more likely to occur in low socioeconomic status communities and communities of color.
METHODS
Regulated sites with known heavy metals
To assess the distribution of brownfields known to have the presence of heavy metals in Baltimore City, we downloaded data from the Maryland Department of the Environment (MDE) Brownfield Master Inventory (BMI) Report. The data used were from January 2, 2018. There were a total of 351 active brownfields in Baltimore City identified in the BMI report. This research did not require IRB approval because it did not involve human subjects reserach.
We identified 35 brownfields in Baltimore City that identified contamination of Pb, Hg, As, Cd, or Cr. We also mapped all 1711 LRPs, including closed and archived sites in Baltimore City. We screened for sites that had Pb, Hg, As, Cd, or Cr contamination (n = 43). Because MDE considers land restoration sites brownfields, we joined the count of brownfields and land restoration sites and mapped them as a total count of LRP sites. Superfund sites were located through the Environmental Protection Agency's (EPA) list of National Priorities List and Superfund Alternative Approach Sites. 39 There were two located within Baltimore. Finally, we downloaded 2016 data from EPA's TRI database, and filtered for facilities with category 1 metals in Baltimore City. Category 1 elemental metals include Pb, Hg, As, Cr, and Cd.
We excluded other metals in our analysis because more research has been done on the five aforementioned metals in urban soil environments. We identified 14 TRI facilities in Baltimore City that were known to release Pb, Hg, As, Cr, or Cd to the air, water, and/or soil. Although screening for heavy metals provides information about what contaminants are present at certain sites, we have not conducted any exposure and/or risk assessments. Thus, this analysis discusses proximity to environmental hazards and heavy methods as a proxy of exposure. This research did not require IRB approval because it did not involve human subjects reserach.
Urban farms
This study identified 24 urban farms that met the definition of, “farms that grow food in and around urban areas.” The data were compiled by the Center for a Livable Future from the Farm Alliance of Baltimore, farm websites, and personal contact. These enterprises differ from community gardens, as the food is grown for sale and not personal consumption. These farms have a focus on increasing food access in their immediate neighborhood through affordable farm stands, making this data set ideal for our analyses. 40 These farms range in size and by type of products produced, and by farming practices (CLF Food System Map). 41 Only farms that met this definition were analyzed for proximity to all regulatory sites.
Sociodemographic measures
Sociodemographic (SOD) variables were calculated using the 2016 American Community Survey (ACS) 5-year estimates. Measures included in our study were (1) median household income, (2) percentage receiving Supplemental Nutrition Assistance Program (SNAP), (3) estimate of owner-occupied housing units, (4) percentage African American, (5) percentage with less than a high school (HS) education over the age of 25, and (6) unemployment rate. These variables were selected for inclusion in this study as they have been used as general indicators of community susceptibility to exposure of environmental hazards in previous environmental justice research. 42
Analyses
Using the available contaminant data from the regulatory sites, a buffer analysis was performed to identify the frequency of sites that emit heavy metal pollution within a radius of urban farm sites. The radii chosen were 1, 2, and 5 km to show census tracts with high and low probable impact from pollutants. The radii sizes utilized were consistent with those traditionally used in environmental justice buffer analyses. 43 Sites with nonmetal or undetermined pollutants were recorded separately so a general understanding of pollutants in relation to urban farms could be made.
In addition, separate buffer analyses were conducted on TRI facilities, LRPs, and brownfields to find the differences in mean demographics between urban farm site tracts that contained these sites, or were within a 1, 2, or 5 km radius of them. This analysis excluded Superfund sites because there were too few Superfund sites to justify a separate buffer table. SOD data from census tracts that were included within buffers were averaged to approximate SOD characteristics within each buffer size.
A site/nonsite analysis of census tracts in relation to the presence of TRI facilities, LRPs, brownfields, Superfund sites, and urban farms was performed to identify trends in mean SOD variables and relationships with the frequency of sites. Density of hazard exposure was calculated based on the number of hazardous sites in each census tract, divided by the total area in square kilometers. This was done twice to obtain two different hazard exposure variables: one for all contaminating sites, and the other for specifically heavy metal polluting sites.
A hot spot analysis was performed in ArcGIS to determine which census tracts were statistically significant hot spots or cold spots of (1) urban farms, (2) hazard exposure, and (3) hazard exposure related to heavy metals. A logistic regression was performed on each of these dependent variables, showing the relationships between the SOD variables of interest and the odds of being in a hot spot census tract.
Figure 1 displays all data sources, data integration techniques, analytical steps, and outputs used in this research.
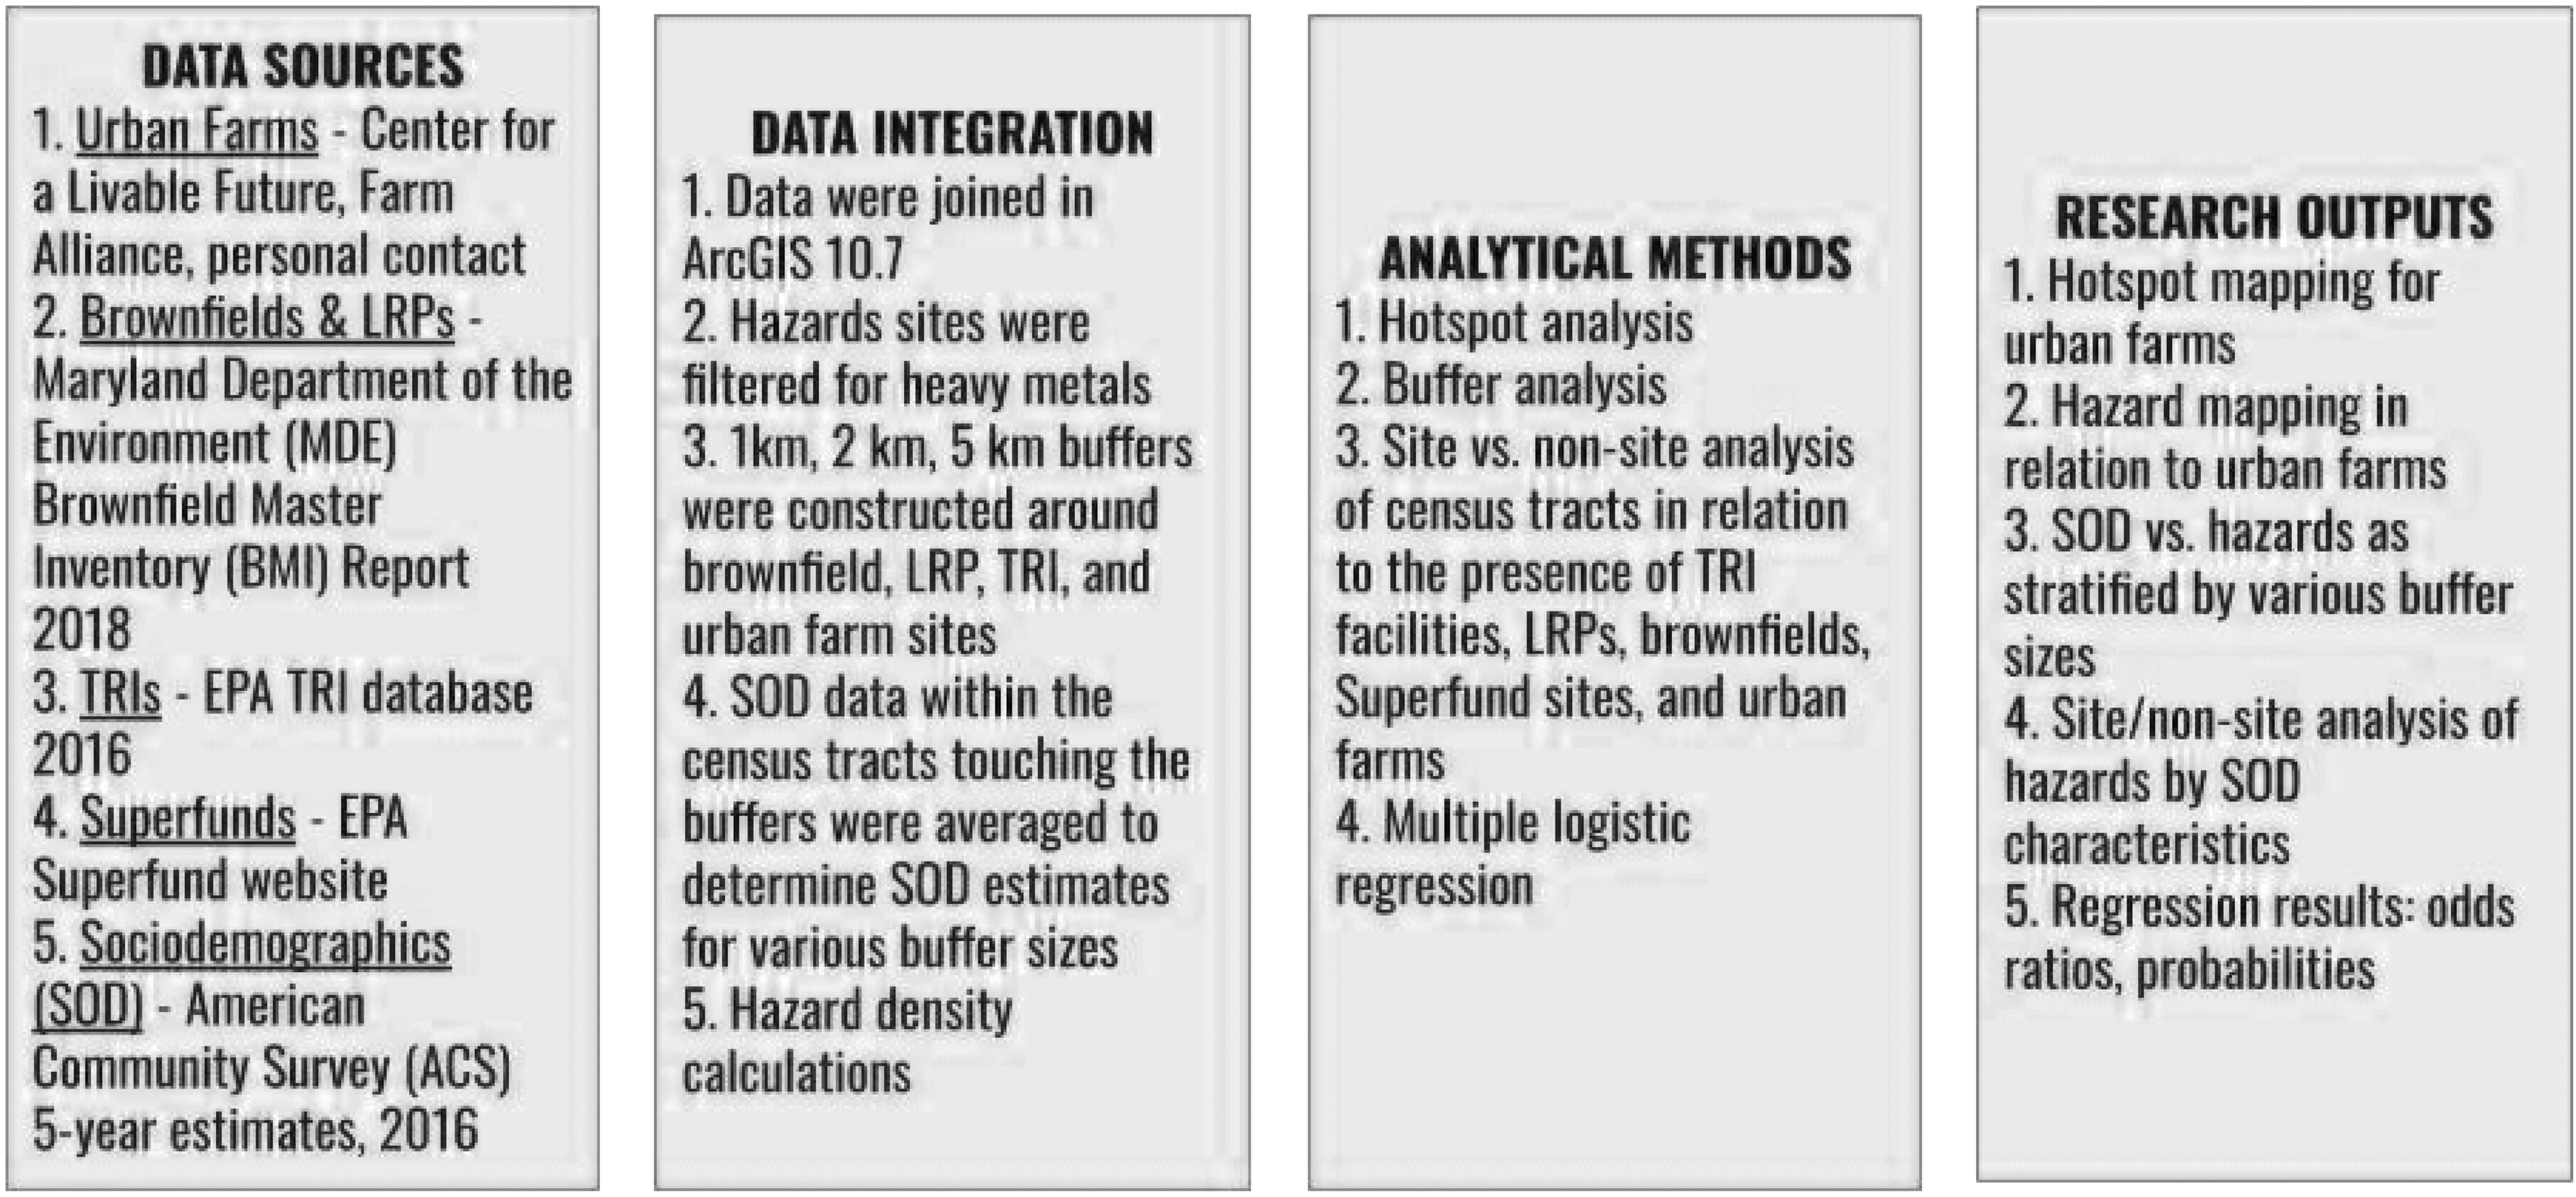
Data sources, integration, analyses, and outputs.
RESULTS
Table 1 displays the statistical analysis of urban farms hot spots and cold spots, while Figure 2 displays hot spots and cold spots in relation to Healthy Food Priority Areas. Across all environmental hazards examined, urban farm hot spots site more hazards than cold spots. Furthermore, the median household income from urban farm hot spots to cold spots almost doubles (from $38,757 to $75,692, respectively).
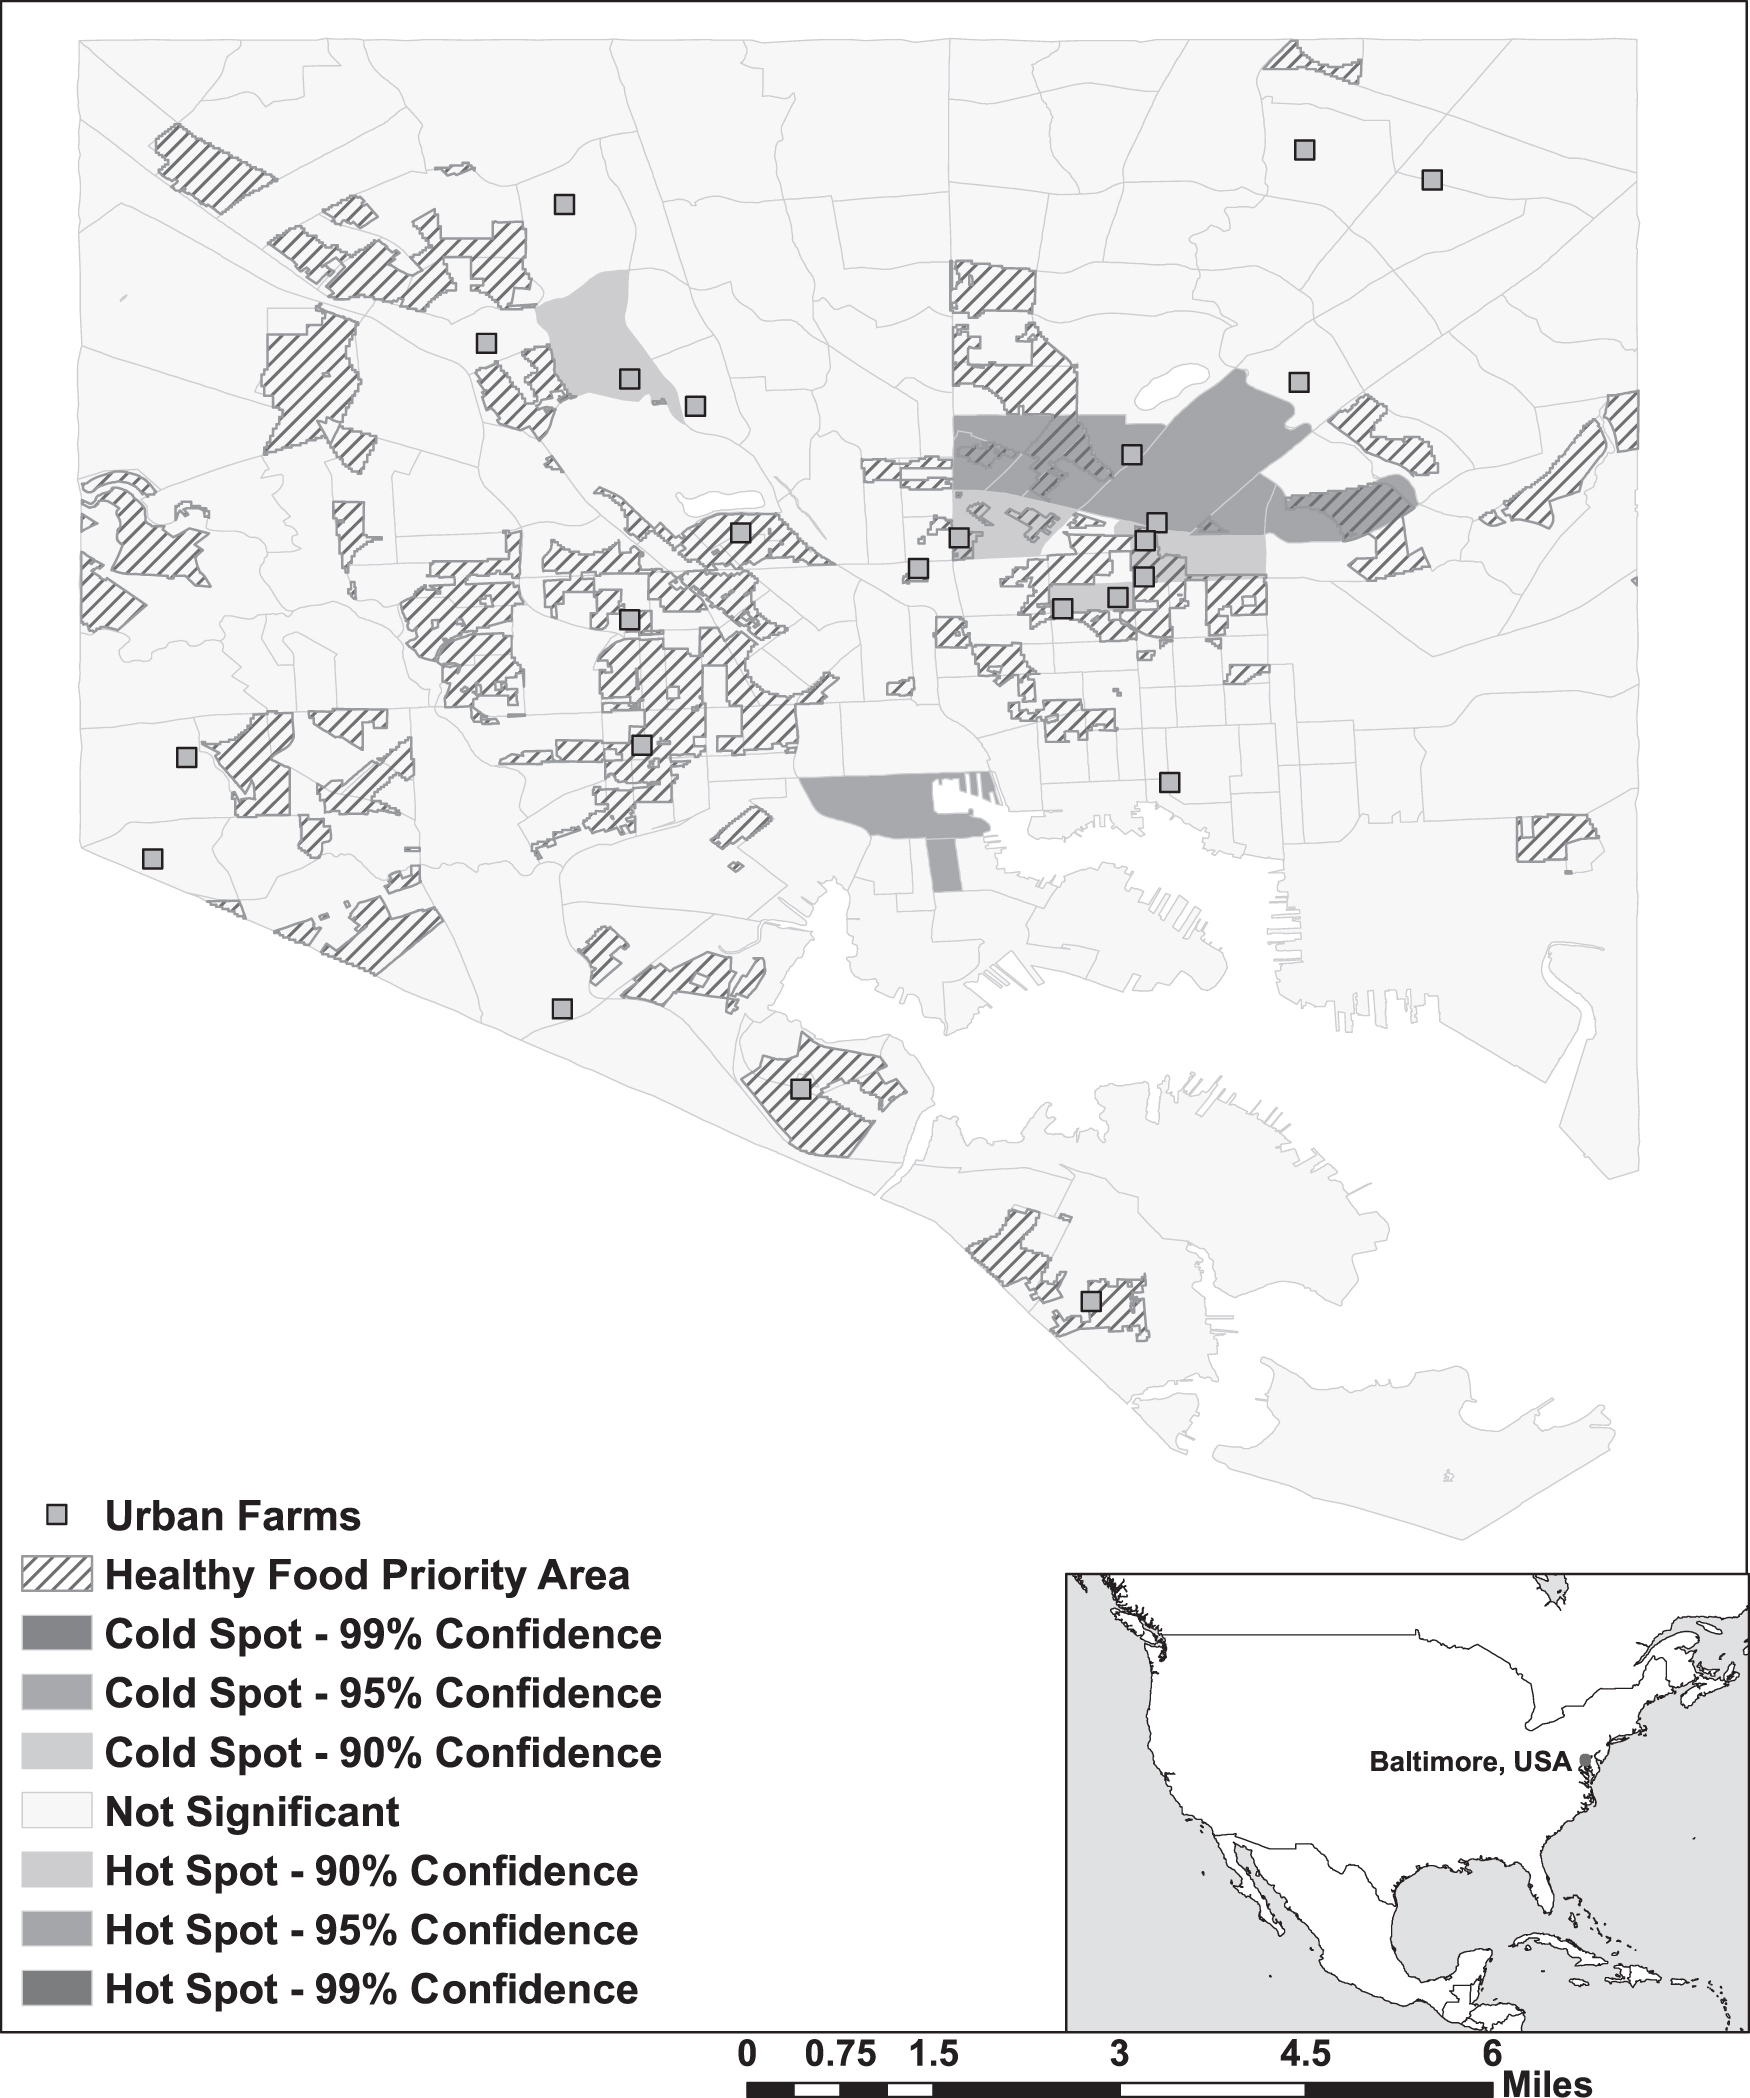
Hot spot analysis of urban farms in Baltimore in comparison with healthy food priority areas.
Hot Spot Analysis of Urban Farms in Relation to Sociodemographic Composition
BFs, brownfields; HS, high school; LRP, land restoration site; SNAP, Supplemental Nutrition Assistance Program; TRI, toxic release inventory.
There was a 74.9% increase of African American, 14.2% increase of unemployment, 29.1% increase in SNAP, and 14.3% increase of less than HS from urban farm cold spots to hot spots. Figure 3 displays a map of all known contamination sites. LRPs were the most abundant source of contamination in the city of Baltimore, and they were densely located in southern parts of the city. Brownfields and TRI facilities also contributed to contamination of the surrounding environment. Both types of facilities were located primarily in neighborhoods that also featured LRPs, but brownfields were also dispersed further north.

Presence of all TRI, LRP, brownfield, and Superfund sites in relation to urban farms in Baltimore City. LRP, land restoration site; TRI, toxic release inventory.
Figure 4 shows known heavy metal sites in Baltimore City. Heavy metal sites were screened for as sites that had explanatory factsheets that mentioned Pb, Hg, As, Cd, or Cr to be a known pollutant. LRP sites were concentrated around the harbor, whereas TRI facilities were more widely dispersed throughout the city. There were only a few tracts that contained both an urban farm and a known heavy metal contamination site.
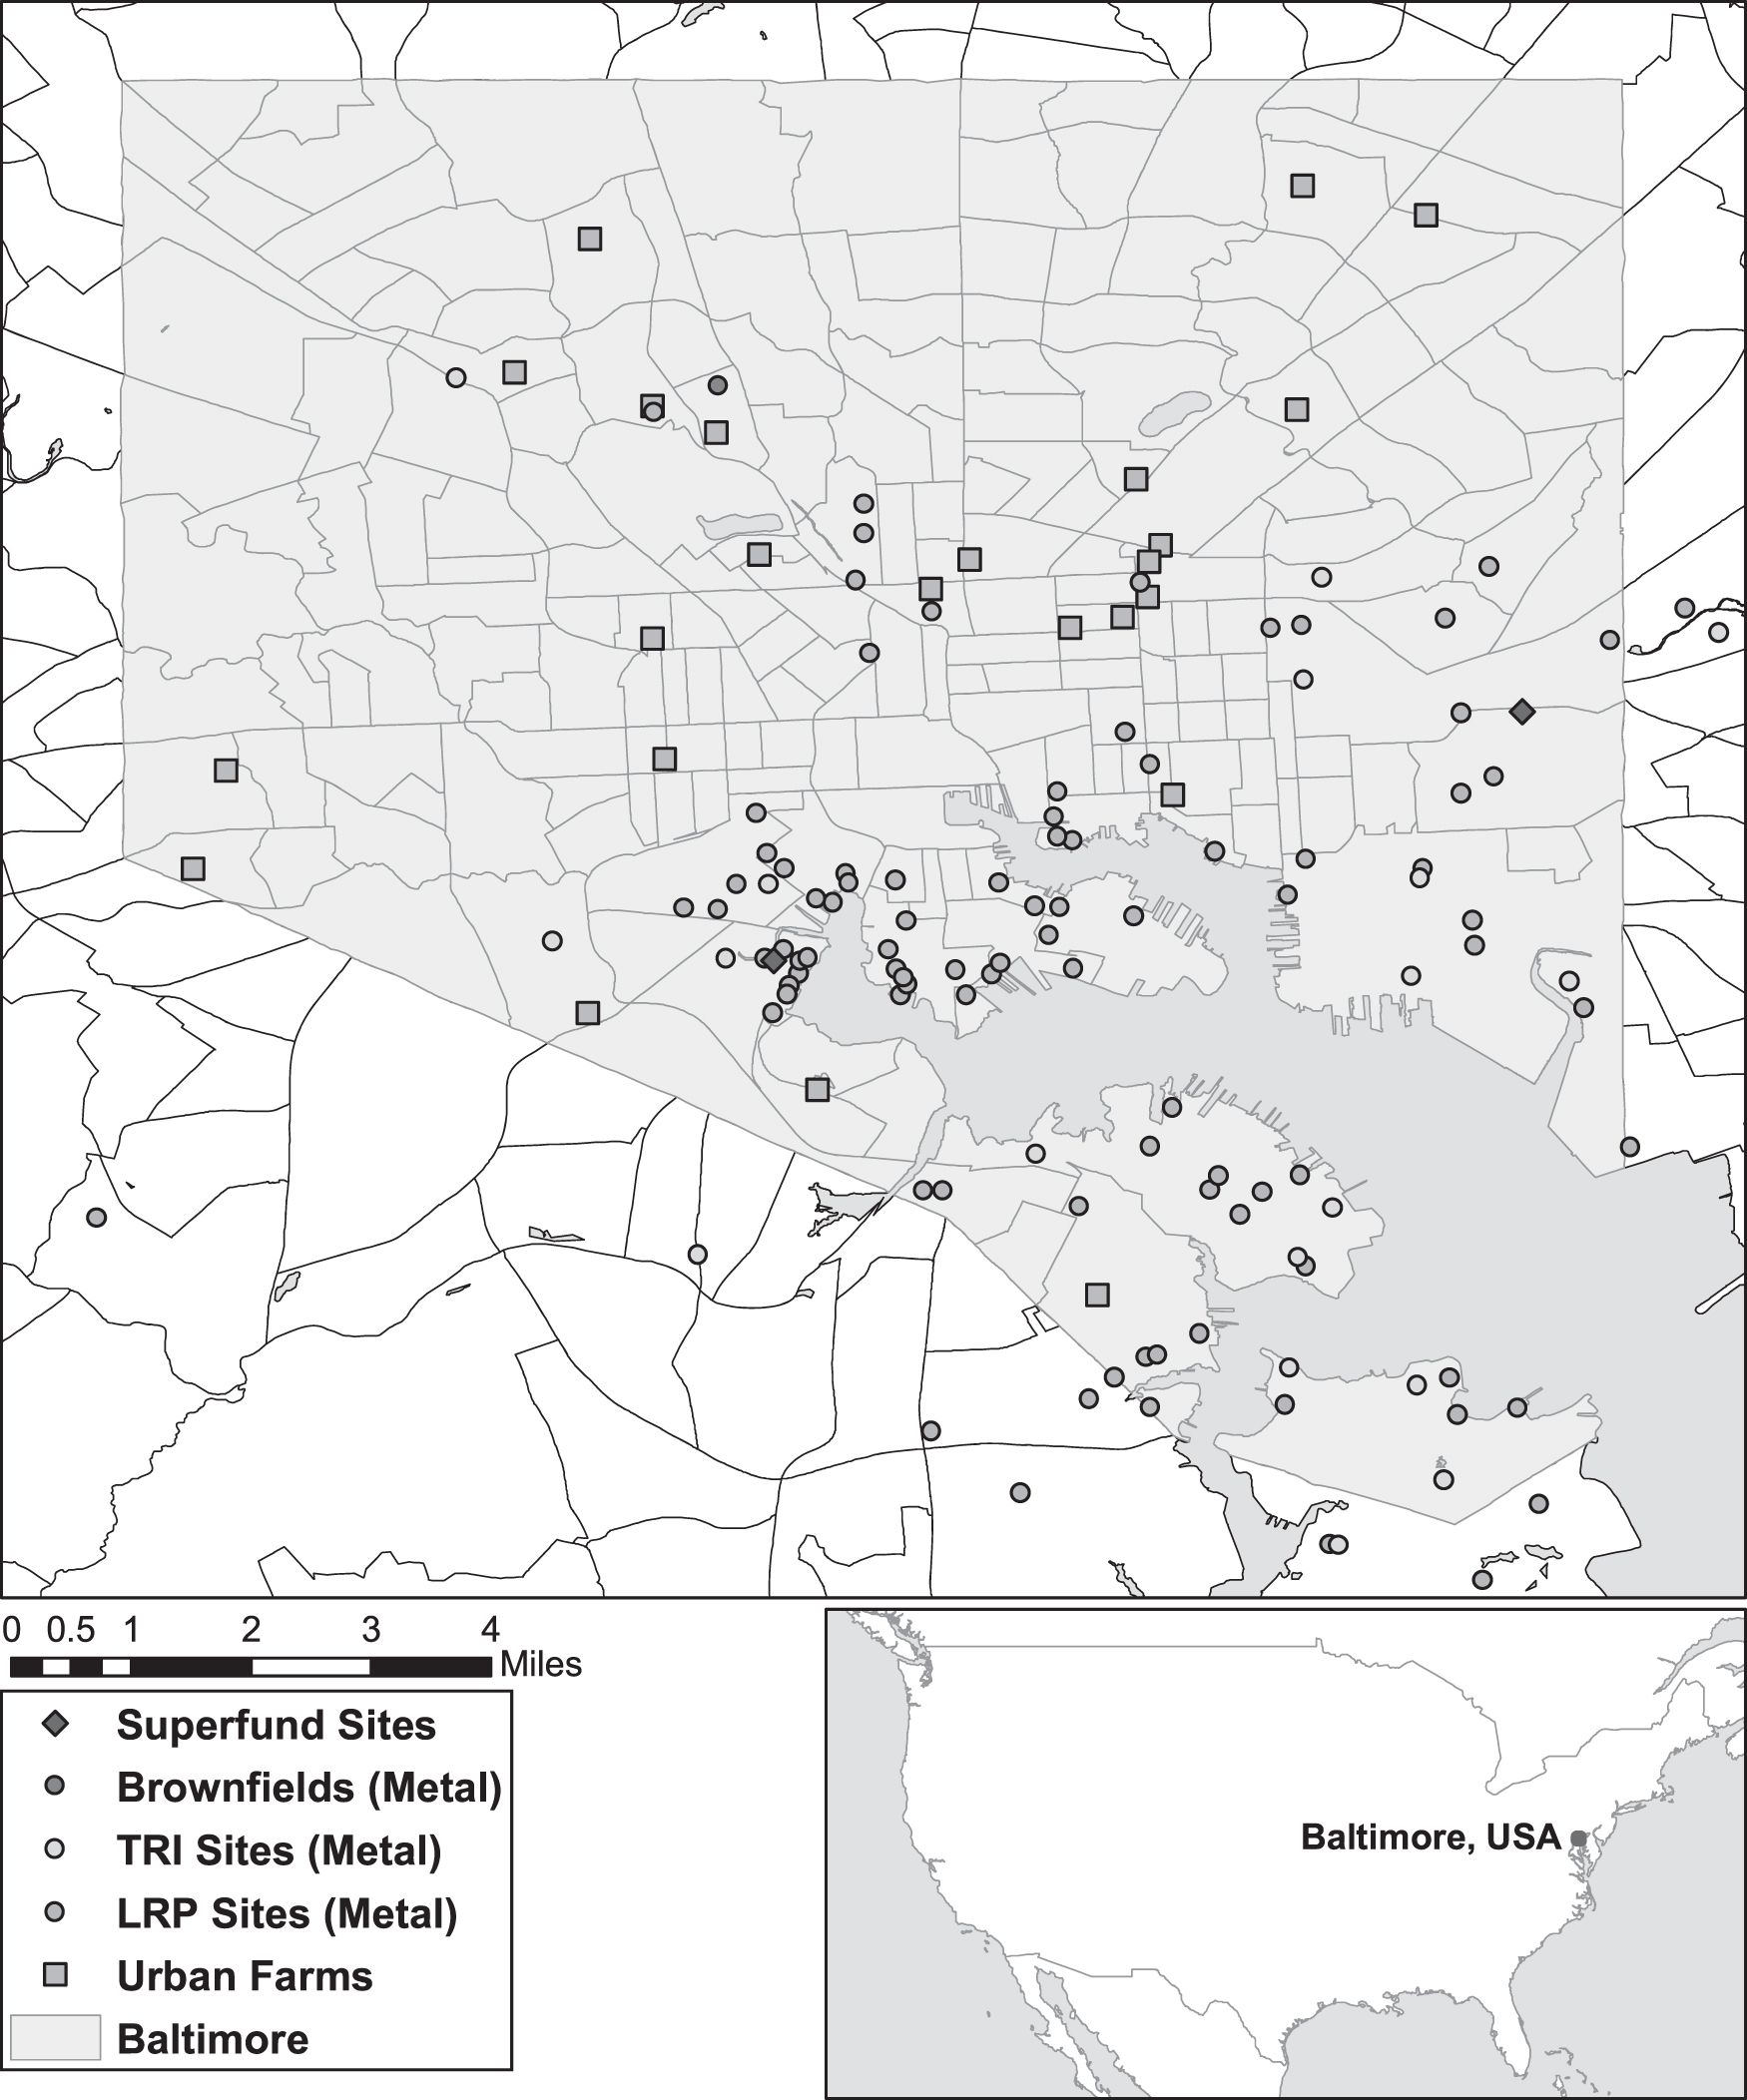
Presence of heavy metal contamination in relation to urban farms in Baltimore City.
Table 2 gives that within a 1-, 2-, and 5-km buffer of an urban farm, there were more sites featuring unknown environmental contamination than sites with the presence of heavy metals. Each radius is exclusive, so a site cannot be in multiple categories. Unknown environmental contamination includes both nonmetal and unknown pollutants. Most contaminated sites were LRPs. There was an observed increase of LRP sites from 1 to 5 km (32–145) and a similar pattern was found for TRI facilities (4–73), brownfields (16–26), and Superfund sites (0–2). There were more LRP sites that had undefined environmental contamination than sites containing Pb, Hg, As, Cd, or Cr. Two Superfund sites were identified with unknown environmental contamination. As the radius from an urban farm increased, the number of environmental hazards increased as well.
Count of Presence of Heavy Metal Sites and Unknown Contamination Sites Within 1 km, 2 km, and 5 km of Urban Farms
N/A, not applicable.
Table 3 displays SOD factors of urban farm sites that were also TRI facilities, LRP, or brownfield sites or were within 1, 2, or 5 km of these hazards. Tracts that featured an urban farm with a TRI facility 1 km away had the highest percentage of unemployed (21.6%), highest with less than HS education (23.4%), and the highest percentage receiving SNAP (40.8%) out of all three environmental hazards, as well as the highest percentage of African American residents (87.8%) for TRI facilities. Median income increased significantly between tracts featuring an urban farm and a TRI facility 1–2 km away ($13,305 increase).
Sociodemographic Composition of Tracts Featuring Urban Farms and Within Buffers with Regard to Presence of Toxic Release Inventory Facilities, Land Restoration Sites, and Brownfields
Census tracts featuring urban farms that are within a 2-km radius of an LRP had the highest percentage of African American residents (88.5%), unemployment rates (18.5%), and less than a HS diploma (22.9%). Lowest median household income can be found in tracts featuring urban farms and LRPs ($44,630). Furthermore, census tracts within a 1 km radius of an LRP had the highest percentage of people receiving SNAP (34.8%).
Census tracts within a 2- radius of brownfields had the highest percentage of African American residents (88.5%), of unemployment (16.2%), and of less than a HS diploma (18.3%). Lowest median household income was found to be in tracts within a 1-km radius of brownfields ($44,063). Census tracts within a 1-km radius of a brownfield had the highest percentage SNAP as well (34.2%).
Table 4 gives that site tracts for TRI facilities had the lowest median household income, >$10,000 lower than the median household income in site tracts for Superfund sites, which was the second lowest. LRP and brownfield nonsite tracts had the highest percentages of African American residents (70.2% and 67.0%, respectively). The highest percentage unemployed was found in site tracts for TRI facilities (17.6%). This was followed by Superfund sites and urban farm site tracts (15.4% and 15.2%, respectively).
Sociodemographic Composition in Site and Nonsite Tracts of Environmental Hazards and Urban Farms
Percentage homeownership was the lowest in LRP site tracts (42.5%), whereas highest in Superfund site tracts (52.5%). TRI facility site tracts had the highest percentage of people receiving SNAP (35.5%), followed by Superfund site tracts (39.4%). Brownfield site tracts had the lowest percentage of SNAP (26.8%). Superfund site tracts had the highest percentage of people without a HS diploma (28.8%). The lowest percentage of people without a HS diploma was found in urban farm site tracts (16.3%).
Table 5 displays the results of the multiple logistic regressions that assessed the relationships between hot spots of urban farms, density of hazard exposure, and density of heavy metal hazard exposure and various SOD characteristics related to environmental justice. There were several results that were statistically significant, but ultimately odds ratios demonstrated that our SOD groups of interest—namely communities of color and low socioeconomic status communities—had similar odds of residing in hot spots of urban farms, density of hazard exposure, and heavy metal hazard density exposure as their White higher socioeconomic status counterparts.
Multiple Logistic Regression for Urban Farm, Hazard Exposure, and Heavy Metal Hazard Exposure Hot Spots by Sociodemographics
Significance codes: ***p < 0, **p < 0.001, *p < 0.01, #p < 0.05.
DISCUSSION
In all comparisons, Table 3 gives tracts that featured both an urban farm and a TRI facility 1 km away, had populations with the highest percentage less than HS education, lowest median household income, highest percentage African American, and highest percentage receiving SNAP. Previously, researchers found that tracts with higher proportions of non-White residents and people living in poverty were more likely to live closer to TRI facilities. 44
Litt found communities in southeast Baltimore who lived near more brownfields experienced statistically higher mortality rates due to cancer (27% excess), lung cancer (33% excess), respiratory disease (39%), excess, and the major causes of death (index of liver, diabetes, stroke, chronic obstructive pulmonary disease, heart disease, cancer, injury, and influenza and pneumonia; 20% excess) than communities in the same area who lived near fewer brownfields. 45
This study produced several significant results suggesting that contamination in areas in proximity urban farms is problematic in Baltimore. Table 1 gives that there were more environmental hazards in tracts that featured urban farms than in nonsite tracts. Furthermore, Figures 3 and 4 display the physical proximity of many environmental hazard sites to urban farms. Throughout the city, there are urban farms within proximity of TRI facilities, LRPs, and brownfields, ultimately putting those who consume products from those urban farms at risk due to the farms' proximity to contamination.
Disproportionate distribution of environmental and health hazards is yet another result of discriminatory zoning and planning policies implemented in the early 20th century. Studies have repeatedly shown that there to be a correlation between urban low-income neighborhoods and proximity to environmental hazards including TRI facilities, hazardous waste sites, and heavily trafficked roads. 46
Figure 4 found a large concentration of hazards with both heavy metal and unknown contamination near historically industrial areas of Baltimore. Previous research on soil contamination in Baltimore found that urban soils had concentrations that were elevated above-background levels, with a large proportion of locations exceeding EPA soil screening levels. 47
Food crops grown on contaminated urban soils contain higher concentrations of trace metals than those grown on uncontaminated soil. 48 Dietary intake of certain contaminants in food consumed by urban communities may exceed acceptable limits. 49 These trace metals can have negative neurological effects on developing fetuses and young children. 50 Elevated concentrations of Cu, Pb, and Zn in the more urbanized areas of Baltimore suggest that people living in these areas have a greater risk of exposure to these metals and their harmful effects. 51
This study had a few limitations. Not all companies are required to report toxic releases; only TRI facilities with >10 employees that produce or process >25,000 pounds or use >10,000 of a chemical listed on the TRI must report. 52 Thus, not all chemicals that may have negative human health impacts were reported. TRI data sometimes list the headquarters rather than the actual emission site, which may have skewed the data. In addition, we defined urban farms as “farms that grow food for sale in and around urban areas,” as opposed to subsistence urban farming. These farms range in size and by type of products produced, and by farming practices. 53
Therefore, private gardens, school and community gardens, and greenhouses were not included in this study. Also, different growing practices occurred in our sample of 24 urban farms, making it difficult to understand and quantify proxy for exposure to contamination. Out of 24 farms, 18 farms grew food outside in the site's soil or in remediated soil. Out of the 18 farms that grew food outside, two farms had additional hoop houses where they grew food. 54 Finally, three farms grew only in hoop houses and one farm used an indoor controlled environment. This farm utilized hydroponics. 55 It was beyond the scope of this study to examine contamination risks as approximated by proximity analyses for farms with different growing practices.
Future studies should consider plume modeling to better understand the dispersion of contaminants from legacy sites and traffic and their relation to urban farms. With this in mind, former land use is significant to consider because factory operations, logging, or mining could point to residual soil contamination. 56 Pb contamination is commonly associated with legacy pollutants such as leaded gasoline, deterioration of external paint, emissions from Pb smelters, and battery recycling. 57 Also, site-specific analysis on soil characteristics and air samples in and near urban farms should be conducted. This analysis can provide more information on the types of contaminants on each farm and identify the best protective features for each site. In addition, future study should focus on the effectiveness and feasibility of various soil remediation techniques. Previous studies on urban farming and its impact on food insecurity have noted the time intensiveness of soil remediation and the opacity of its required science as barriers to using such techniques to extract heavy metals from soils in urban farming settings.
Other assessments of urban farming have noted the cost of soil remediation, saying that urban agriculture projects that include remediation often need major support and capital to succeed. 58 Therefore, future studies should focus on making soil remediation more accessible through increased education and investment. Future studies should explore how to quantify the protection provided by various urban agriculture techniques and projects (i.e., raised beds, hoop houses, and greenhouses) to evaluate the benefits of each approach and encourage gardeners and policymakers to invest in their protective features.
Soil contamination could be further combated by utilizing raised beds with clean, imported soil, and regular testing of soil. 59 Buffer strips may be used to filter stormwater contaminants before reaching food production areas. 60 Certain cultivation methods, such as indoor or soil-free hydroponics operations, may also be used to avoid risk of contaminant exposure. 61
The risks associated with urban farming should be weighed along its other benefits. Urban agriculture is not only a food solution, but also a way to organize communities to work for changes in the policies that perpetuate inequitable access to healthy food. 62 Resident participation in urban agriculture allows community members to build connections within the community that can lead to civic engagement. 63 These corollary benefits of urban agriculture, such as civic engagement, provide opportunities to impact the food landscape through policy and increased community capacity. 64
CONCLUSION
Urban agriculture is an effective strategy to address food disparities, as it provides residents with nutritious alternatives in food deserts. However, proximity to metal contaminants must be considered when determining urban farm locations, especially near historically industrial areas. Legacy pollution sites may contribute to soil contamination, directly affecting the produce grown in urban farms. Those involved with the planning and zoning of urban farming ventures in metropolitan areas should account for environmental hazards and should enforce stricter soil safety policies.
Implementation of land inventories or monetary incentive programs should be considered by cities to encourage urban agriculture with limited health risks. Ensuring the safety of urban soils is vital to successfully adopting effective urban farms across the country. Urban farming may lessen disparities with regard to food access, but confirming soil safety helps promote health equity and environmental justice for food insecure communities by limiting unnecessary risk of exposure to heavy metal contamination.
Footnotes
ACKNOWLEDGMENTS
The authors thank all of the members of Community Engagement, Environmental Justice, and Health (CEEJH) who contributed to this project.
AUTHOR DISCLOSURE STATEMENT
No competing financial interests exist.
FUNDING INFORMATION
This research received no outside funding from any agency, foundation, or other funding mechanism.