
Abstract
Background:
The research of climate change examines social vulnerability by looking at hazard exposure and susceptibility to that hazard; however, disaster-related data are not factored into vulnerability.
Methods:
Using Hazus® Hurricane Model, disaster losses are calculated using data from the Houston metropolitan area and the 2008 historical storm event, Hurricane Ike. 2010 U.S. Census indicators quantify socioeconomic factors. GeoDa 1.14 open source software investigates nonrandom spatial clusters with exploratory spatial data analysis local Moran's I score to identify census tracts with high associated disaster losses and vulnerability.
Results:
We demonstrate the importance of adding disaster loss data with the spatial analysis of vulnerability factors, including race, median income, and poverty. A nonrandom spatial component was found within and between these variables, confirming place matters. The average loss rate shows an increase of the number of census tracts that had a higher proportion of loss regardless of income.
Discussion:
Incorporating historical disaster loss data into the model provides a better picture of vulnerable populations in the Houston metropolitan area. Disaster loss data is a crucial performance assessment technique that can effectively assess current approaches and compare the accuracy of other methods for identifying high-risk areas.
Conclusion:
Previous social vulnerability studies in metropolitan areas focus on disaster impacts and recovery operation outcomes or on susceptibility to natural hazards. Our study investigates both vulnerabilities: social and biophysical. This average loss rate shows loss in relation to income, highlighting the importance of standardizing data to compare census tracts that are disproportionately affected.
INTRODUCTION
In the United States, 151 weather-oriented disasters resulted in >$1 billion dollars in damages with total costs reaching $1 trillion dollars between 1980 and 2013. The Houston–Galveston–Brazoria (HGB) region has a long disaster history related to hurricanes and tropical storms that track from the Gulf of Mexico. In 1983, Hurricane Alicia, a category 3 hurricane, hit Galveston, Texas, and caused 21 deaths and $2 billion in damages. 2 In 2001, tropical storm Allison hit Freeport, Texas, and resulted in an estimated $5 billion in damages and 41 deaths. 3 In 2005, Hurricane Rita hit southeastern Texas culminated in ∼$10 billion in damages and seven deaths. 4 Hurricane Ike, the ninth tropical storm of that season 5 made landfall at Galveston, Texas, as a category two hurricane with winds of 110 mph. 6 , 7 Ike caused wide spread destruction, damage with an estimated $19.3 billion in damages and 114 deaths, making it the third costliest Hurricane at that time in the U.S. history after Hurricanes Katrina and Andrew. 8 In August 2017, Hurricane Harvey, a category four hurricane, hit the HGB, causing $125 billion in damage. Harvey was directly responsible for 68 deaths (45 in the Houston metro area) and indirectly responsible for an additional 35 deaths. 9
Vulnerable populations are disproportionately affected by natural disasters resulting in inequitable consequences in areas, including social capital, economic hardship, environmental hazards, and health issues. Hazardous exposure and social vulnerability require examination of both biophysical risk (e.g., disaster-related consequences) in addition to vulnerable population characteristics. Studies of flood impacts, response, and postevent recovery typically document disproportionate impacts for socially disadvantaged communities 10 , 11 using a social vulnerability to hazards/disasters lens. 12 In the past three decades, the emergence of a social vulnerability perspective on hazards and disasters emphasizes the influence of social inequalities on differential risks, including debilitating damage and uncompensated loss. 13 , 14 Natural disaster impacts are context dependent, but often include social class, race, ethnicity, gender, age, disability and health status, and immigration and citizenship status—some of the axes of social inequality that environmental justice research focuses on. 15
The built environment—the surroundings in which people work, live, and play—and the vulnerability associated with place can identify areas within a community with higher health and environmental burdens. However, studies examining neighborhood-level contexts in relationship to racial inequality, segregation, and environmental hazards are mixed. 16 , 17 A possible solution to macrolevel studies is focusing on smaller geographic units and understanding local conditions contributing to interactions between race, segregation, and space. 18 , 19 , 20
Vulnerability studies show that socially marginalized people have reduced capacities for self-protection in terms of mitigating flood hazards at home sites pre-event, evacuating in response to flooding, returning home or to employment after flood-induced livelihood disruption, and accessing social protection resources to reduce the impacts of flooding such as flood insurance, preflood hazard mitigation infrastructure, emergency response information, and postdisaster assistance. 21 , 22 In addition, such studies indicate that socially vulnerable groups experience adverse consequences of flood disasters in terms of morbidity and mortality, 23 which may reflect both their increased exposure to flooding during actual flood events and their reduced access to protective resources. The increase in casualties are unequally distributed within income and race and associated with the disaster itself, the built environment, and socioeconomic factors. 24 , 25 , 26 Effective mitigation is reliant on a community's existing social and economic conditions to natural disaster risk with some groups disproportionately impacted than others. 27 , 28 , 29 , 30 , 31 , 32 , 33 , 34 Vulnerability assessments predict the likelihood of loss, injury, or other harm with the ability to recover from these impacts and create a relative index score to compare social vulnerability between different groups, census areas, and geographic areas. 35
Social, economic, and political factors shape structural conditions that determine vulnerability within collective risk, disaster preparedness, and access to resources for response and recovery. 36 For example, renters rely on landlords for mitigation plans. 37 Wealthier households absorb losses and recover from disasters compared with impoverished areas. 38 Populations with greater social and economic disadvantages are more likely to experience devastating socioeconomic, environmental, and health consequences after a disaster. 39 , 40 Thus, incorporating area sociodemographic and economic factors along with environmental risk can prepare for disaster risk management and mitigation. 41
Differences in socioeconomic status, race, and household composition matters when forecasting the effects of natural hazards. 42 This becomes increasingly difficult in a multinatural hazard metropolitan area where regulations are supplementary to climate adaptation and mitigation, and vulnerable populations are not able to dwell in nonhazardous locations. 43 These regulations are derived from federal, state, and local governments, and can include guidelines for zoning, building codes, and mandated flood insurance.
Vulnerability is the exposure, frequency, and extent of the physical hazard(s) in regard to the human sensitivity to the impacts. 44 This composite vulnerability, which is a function of hazard, exposure, and sensitivity, is usually referred to as biophysical vulnerability. 45 Place vulnerability is the interaction of these two vulnerabilities. There are two types of risk: event risk (ER) and outcome risk (OR). The ER is defined as the occurrence of a particular hazard (extreme event) and OR as probability of a particular outcome. 46
Social vulnerability to natural hazards and environmental justice issues are intrinsically linked, especially around urban and metropolitan areas. 47 , 48 , 49 Neighborhood social and physical environmental contexts often determine one's health outcomes 50 , 51 , 52 , 53 , 54 , 55 and point out the persistent existence of inequalities in environmental health among poor neighborhoods. 56 This type of systematic and structural disadvantage among racial/ethnic minority communities exacerbates the existing racial disparities in health. 57 , 58 , 59 , 60 Poor communities also tend to lack access to parks, grocery stores, and health care facilities, 61 and suffer from lower quality housing and overcrowded living conditions. 62 The built environment, whether it is the physical structures of communities, land use, access to health care, social services, grocery stores, parks, or proximity to air, water, or soil contaminants, profoundly affects the health status of individuals living within. 63 , 64 These inequities also persist with disaster hazards with poorer and minority communities experiencing higher rates of injury and death outcomes. 65
According to Cutter et al., the most vulnerable populations in the United States, identified by the social vulnerability index, are clustered in metropolitan counties around the east and south coastal regions in Texas and the Mississippi Delta region. 66 Understanding underlying causes and context of vulnerability is increasingly important as hazardous disaster events become more frequent and extreme. 67 Emergency response and recovery efforts are often less effective in supporting racial/ethnic minorities living in poverty. 68
This study examines the vulnerable populations in the HGB region, which is also referred to in the U.S. Census as the Houston–Sugar Land–Baytown consolidated metropolitan statistical area and 2008 historical disaster loss classification data associated with Hurricane Ike. This time frame was chosen based on our previous hurricane research involving disaster vulnerability and predictive analytics. 69 Data collection, management, and finalizing predictive models started before the availability of disaster loss classification data for Hurricane Harvey. Predictive analytics, artificial intelligence, and geostatistics incorporating both disaster loss data and vulnerable population characteristics is new to emergency management. Natural disasters are unique occurrences and our research focuses on establishing possible models for a single event versus across events.
2010 U.S. Decennial Census data were chosen because of the sample size and the proximity of time to Hurricane Ike. In 2010, the HGB consisted of an eight county region that covers 22,735 square kilometers and ∼6 million people. 70 Within the city of Houston, in 2010, people living below poverty level were 15% compared with the national average of 9.2%, 71 , 72 and consisted of 25.6% white, 23.2% black, 43.8% Hispanic, 6.0% Asian, and 1.4% other populations. 73 Furthermore, the HGB includes the Houston Ship Channel (HSC) lined with >5000 industrial and petrochemical facilities. 74 Environmental justice issues surrounding lower income and minority populations along the HSC are well documented. 75 , 76 , 77 HGB includes 514 Toxic Release Inventory Sites that are required to report the release of toxic chemicals identified by the U.S. Environmental Protection Agency due to adverse human health effects. 78
Socially vulnerable populations living in HGB, such as racial minority and low income groups, are also more likely to reside in proximity to HSC industrial facilities releasing potentially hazardous chemicals, with higher total toxic air concentrations. 79 , 80 , 81 Examining disaster vulnerability in HGB residential areas uncovers similar patterns of inequity and injustice within minority and low-income populations. 82 Flooding is an ongoing issue in the Houston area due to the Bayou watershed infrastructure, primarily flat topography and tropical storms creating significant flooding events. 83
The damage created by large-scale hurricanes are the latest cases that emphasized the susceptibilities of coastal areas and reintroduced demands for preventive disaster mitigation and emergency response planning. Numerous health and environmental equity studies use geographic information systems (GIS) for visualization and spatial analysis; however, methodology to integrate GIS into ER and OR vulnerabilities research is limited. Our study investigates vulnerability using a GIS framework with the inclusion of disaster loss data to examine the role loss plays within minority and low-income communities. The need to examine both ER and OR vulnerabilities within a disaster context is significant, especially due to frequent hazard occurrences and disaster results experienced by vulnerable population groups. 84 , 85 , 86
METHODS
We developed a methodology to integrate GIS spatial analysis into disaster vulnerability research (Fig. 1). This framework is designed for research that uses polygons (i.e., census tracts) as the geographic unit. This research uses secondary data from government sources which does require IRB approval or a consent document. From lessons learned, this detailed model may guide environmental and health equity research with a three-step sequential framework. The first step is exploratory data analysis (EDA), which includes descriptive, bivariate, and multivariate analysis. This is important because limiting the number of variables is optimal for a spatial analysis due to autocorrelation. This step, which does not include a spatial component, helps investigators identify potential significant association between primary variables. The goal is to create multiple visualizations for a single variable (i.e., histogram, boxplot, and map) and using the brushing and linking tool. This tool allows you to highlight an area of interest on a graph or map and then show the corresponding result on the other visualizations. This is also useful in comparing two or more variables with scatterplots, parallel coordinate plots, and maps.

Geographic information systems framework to investigate spatial relationships. EDA, exploratory data analysis; ESDA, exploratory spatial data analysis.
After narrowing variables of interest, the second step is exploratory spatial data analysis (ESDA) to investigate the possibility of a spatial component within the data. This determines if a variable is randomly distributed across census tracts in a defined geographic region or space (where someone lives). An integral step within ESDA is the selection of spatial weights, which determines the amount of influence a neighboring feature has on a location. We chose a contiguity weight matrix that identifies neighbors based on polygons sharing common borders. ESDA involves global and local spatial autocorrelation that detects spatial trends and outliers.
Global autocorrelation determines overall clustering within the data set. If this clustering exists, we can then move onto local indicators of spatial association (LISA) that pinpoints the location of these clusters. However, LISA cannot explain the patterns it discovers. 87 To confirm spatial patterns, we conduct spatial statistics, such as geographic weighted regression. We learned that although our analysis needed to be partitioned into these three areas, there was a considerable overlap between EDA and ESDA to distill relevant variables.
By creating these deliberate reiterative processes, visual geographic patterns among variable of interest emerged, which were not apparent from preliminary statistical analysis. 88 Permutations are set at 999, which are needed to test for statistical significance. A pseudo p-value at 0.01 is carried out for each observation to determine significance with high–high and low–low clusters. This value is set at 0.01 to minimize false positives, significant clusters appear but are nonsignificant, which can happen when the pseudo p-value is set at 0.05.
High–high is defined as census tracts with a high percentage of a variable that are located with boundaries touching to form clusters. 89 Low–low is defined as census tracts with a low percentage of a variable that are located with boundaries to form clusters. 90 It is important to keep in mind that the reference to high and low is relative to the mean of the variable with the value between 0 and 1, and is meant to be interpreted as a spatial outcome and not that of statistical significance. 91 Therefore, the term pseudo p-value is used for significance.
The Federal Emergency Management Agency Hazus® software is a disaster mitigation GIS tool to evaluate physical, economic, and social impacts and losses caused by earthquakes, floods, and hurricanes. 92 The Hazus risk assessment includes identifying hazards, profiling hazards, creating assets inventories, estimating losses, and considering mitigation options. 93 Historical Hurricane Ike (2008) data were retrieved from Hazus (Table 1) and converted to percentile ranks (i.e., each rank is divided by the number of records with valid values and multiplied by 100) and a simple additive model was used to create the disaster loss index for the event.
A Narrow List of Variables for Spatial Analysis
2010 U.S. Decennial Census Data (Table 1) average loss rate was calculated by dividing the total building loss in thousands of dollars by the median household income for each census tract. GeoDa software was used to conduct EDA (Boxplot Hinge 1.5, Boxplot Map Hinge 1.5; Parallel Coordinate Plot) and ESDA with a weight matrix (Queen Weight, 999 permutations, 0.01 pseudo p-value) to conduct univariate and bivariate local Moran's I. 94
RESULTS
EDA confirmed spatial patterns within the three socioeconomic and disaster loss index variables to investigate variables in step two of the model. Global spatial autocorrelation determined that clustering existed (a spatial component within a variable) to move forward with local autocorrelation. 95 Census tracts that showed possible correlation were then brushed and linked to boxplot maps for visual comparison.
Figure 2 is a boxplot map, with a hinge of 1.5 of average loss by census tracts, in which the four categories are designated into six bins to identify the lower and upper outliers. 96 This boxplot map allows us to illustrate extreme value in the HGB, especially the 26 census tracts that are in the upper outlier range. In addition to impacts on the east side of the HGB, there are also affects in the center city area of Houston.
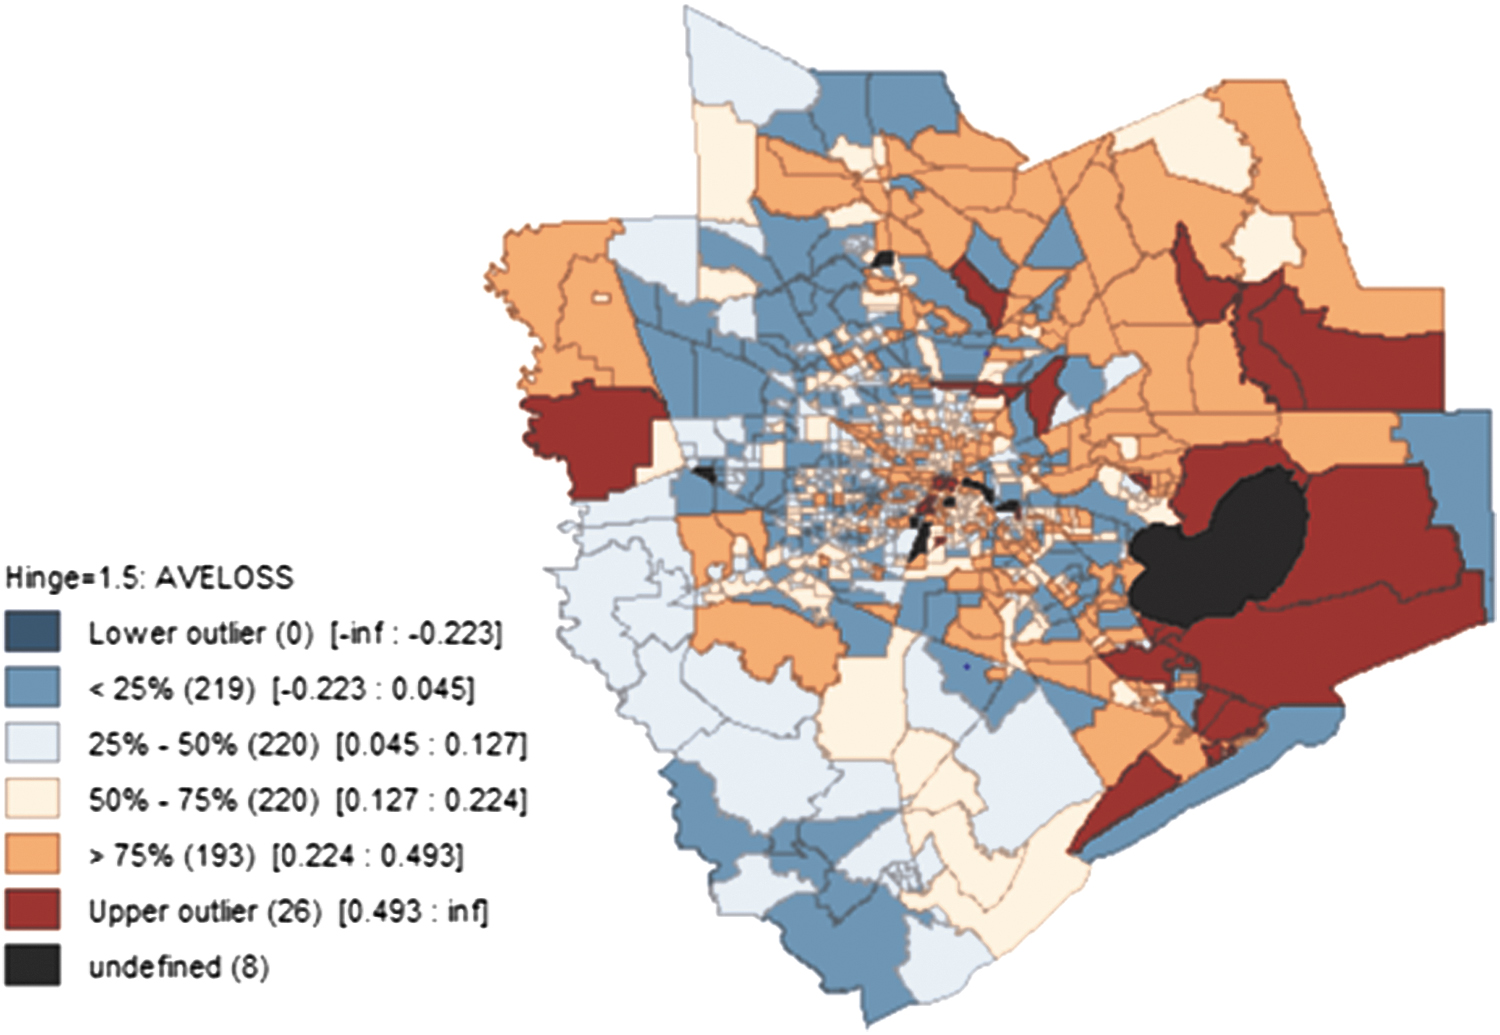
Boxplot map of average loss per census tract in the Houston–Galveston–Brazoria.
Using the brushing and linking tool, percent black population is selected on Figure 3 boxplot for census tracts that have at least 50% black population. The linking tool then highlights these census tracts on the average loss boxplot map. This identifies predominantly black population census tracks that experienced losses >50% in the city of Houston, which may be overlooked in comparison with the coastal census tracks.
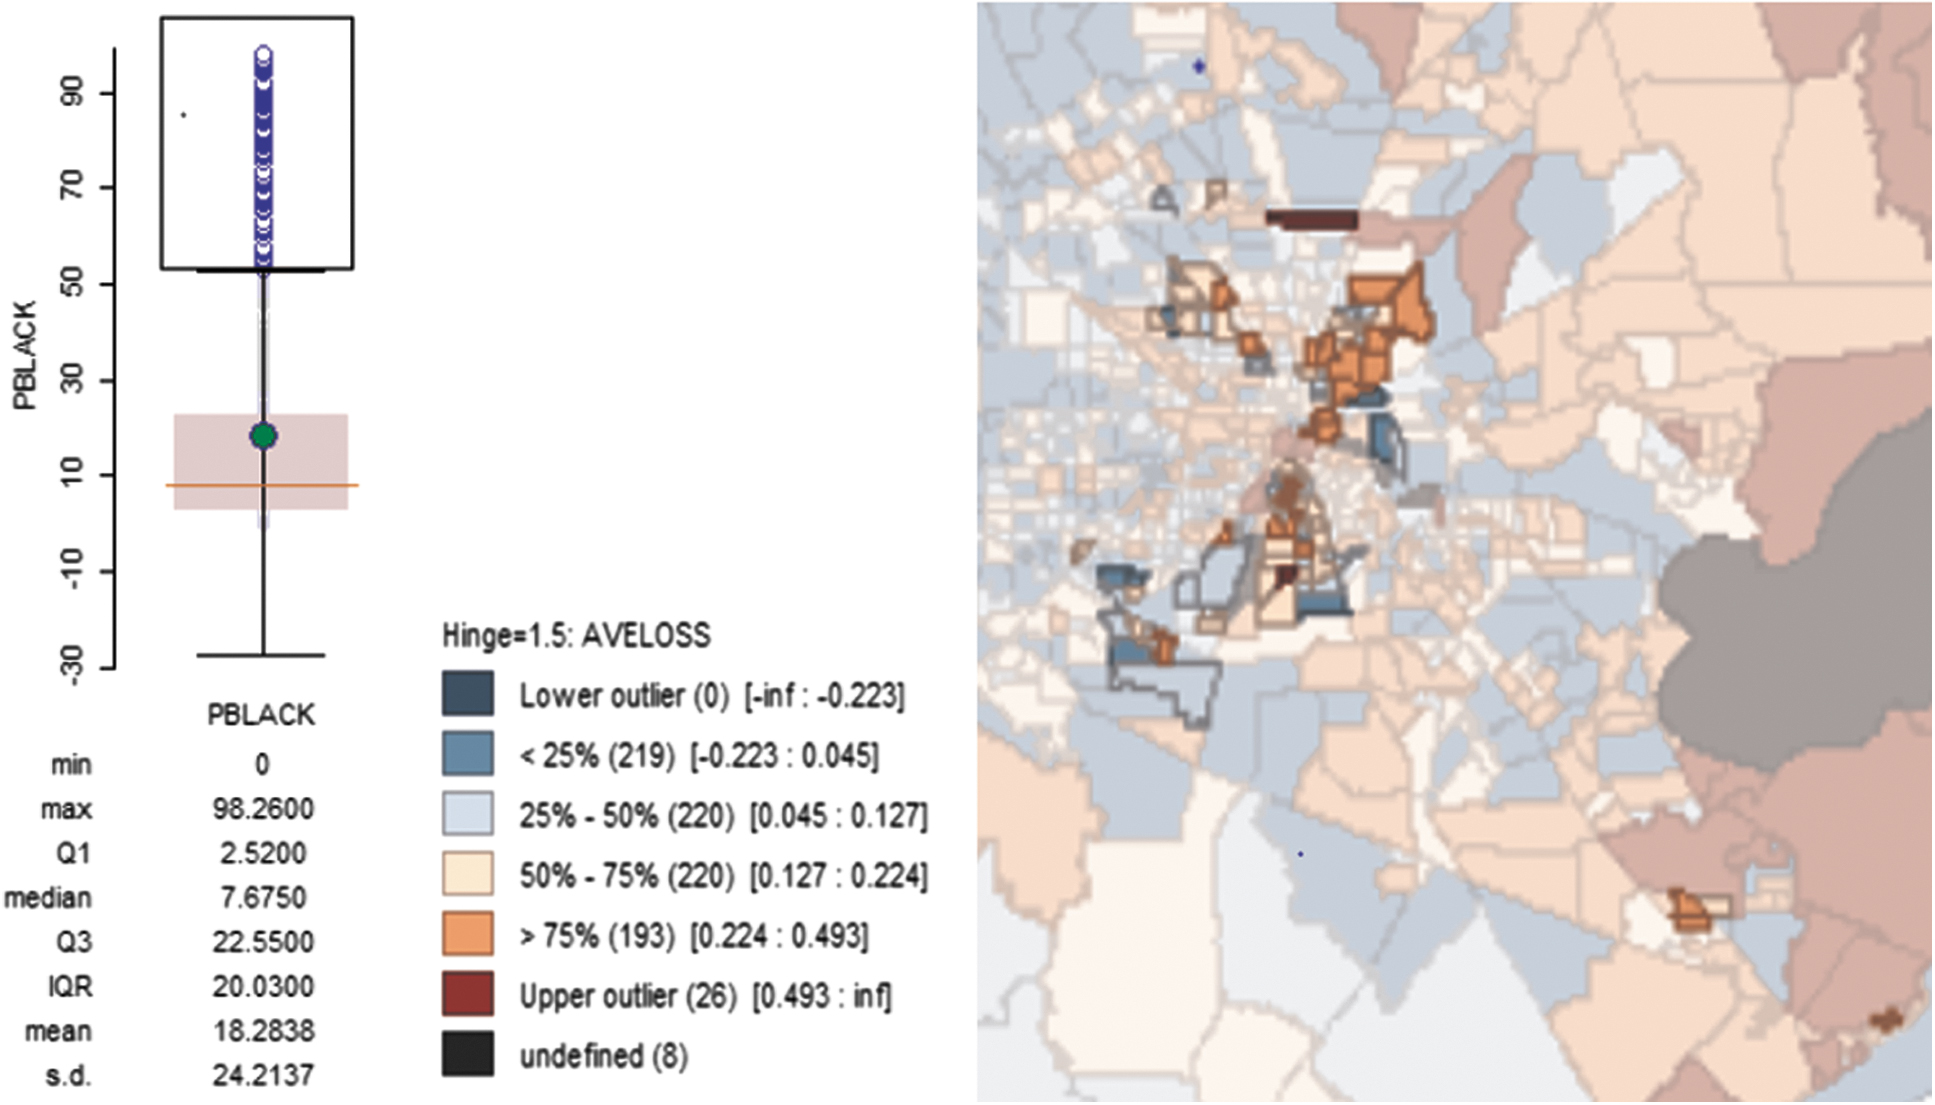
Boxplot and boxplot map with the highest percent black population census tracts highlighted on the percent average loss map.
An EDA multivariate parallel coordinate plot was constructed to visually identify clusters and patterns in a multidimensional variable space. With the brushing and link tooling, Figure 4 shows how the percent black population was again selected based on the upper quartile of the boxplot to see the relationship between percent black population, median housing value, disaster loss index, and the average loss rate. Each line represents a census tract in relation to the other variables on a scale from low to high (left to right). We can investigate the relationship for hypothesis generation between high percent black population census tracts and the other variables. The disaster loss index classifies them as experiencing minimal building loss; however, the average loss shifts these census tracts into a higher loss category.

Parallel coordinate plot with percent black population, median housing value, disaster loss classification index, and average loss rate.
The Univariate Local Moran's I show significant high–high clustering within the variables of percent black population (0.664) and percent poverty (0.602). In Figure 5, the univariate LISA is an example of high–high/low–low map looking at significant clusters (0.582) for median household value. Low–low represents a bigger cluster of low median housing values, whereas the high–high shows a smaller cluster of high median housing variables. However, when investigating Bivariate Local Moran's I between the variables, there was one weak association with percent black population and percent poverty (0.379).
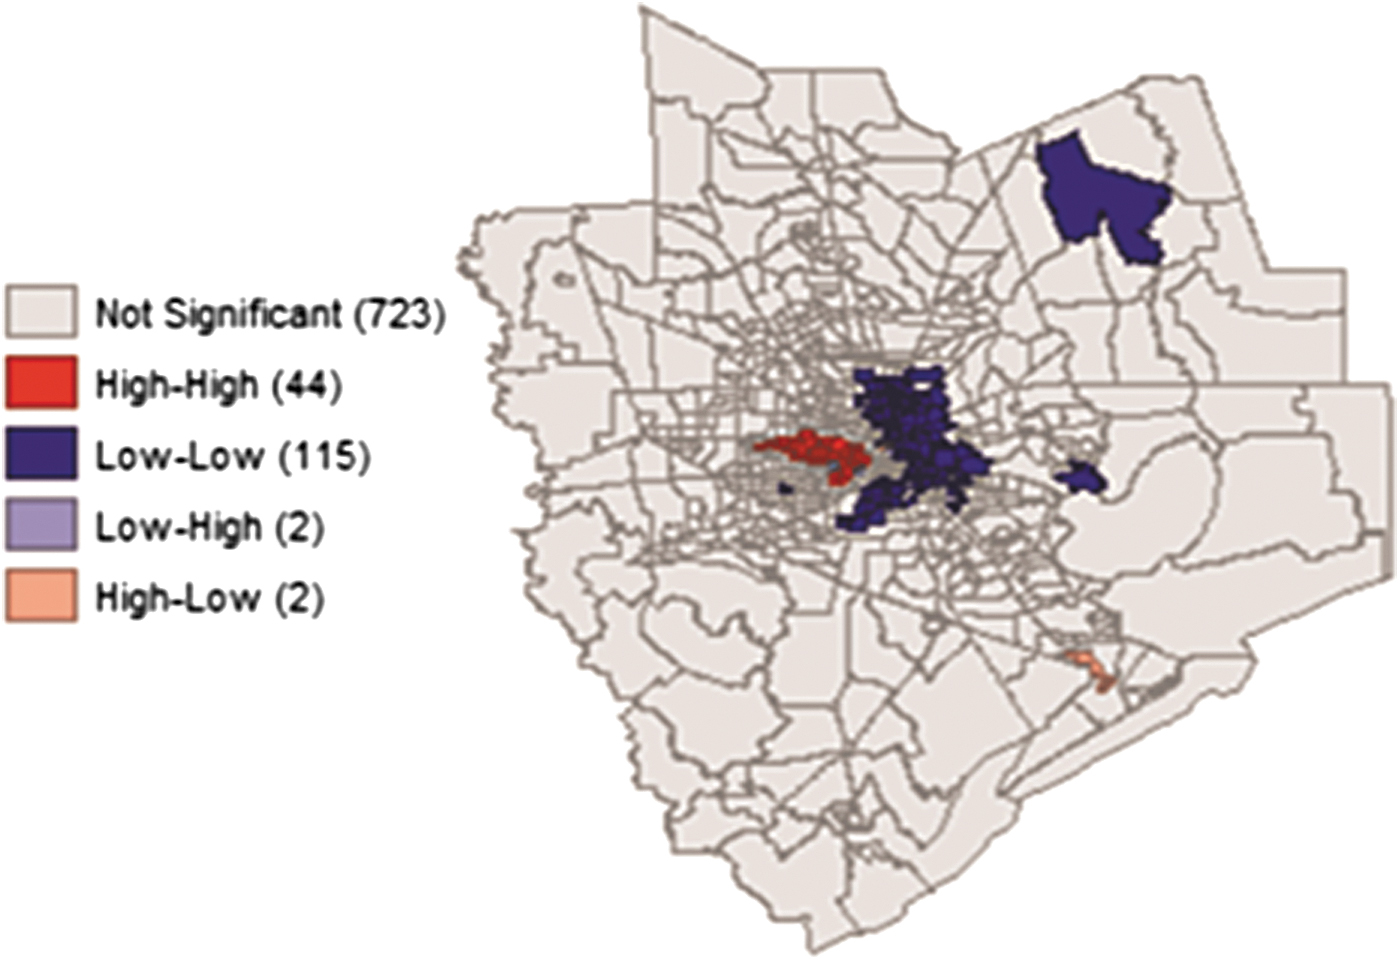
Univariate local indicators of spatial association map with median housing values with low–low and high–high significant clusters.
The disaster loss index—consisting of the number of displaced households, number of short-term shelters required, and total building loss in thousands of dollars—showed some significant clustering using univariate LISA (0.223) with 27 high–high census tracts. The average loss variable had a slightly higher score (0.268) with 35 high–high census tracts, including a cluster in the center area of the city of Houston, which were not initially present with the disaster loss index. This shift identifies eight additional vulnerable census tracks that might need further mitigation assistance.
DISCUSSION
The environmental justice movement has sparked contentious debates among researchers, policy makers, activists, and industry as to whether environmental discrimination actually exists and how broader social and structural factors contribute to such disparities. 97 Investigating environmental and health disparities with complex models requires the integration of new methods to better understand relationships between environmental risk and health outcomes. Traditional statistical results may not always provide the necessary insights into these complicated relationships between geography, sociodemographic characteristics, and environmental exposures because multivariate regression models do not take into consideration locality or the spatial relationship between factors. 98 , 99 There are challenges with geographic data in inter-relating all the variables in a meaningful way. 100 Thus, the exploratory process requires an iterative process paying particular attention to nuances within the variables.
It is often the case that vulnerable populations are in highly hazardous areas exposed to such disasters, 101 , 102 exacerbating the vulnerability of these areas. Our study shows that both biophysical and social vulnerabilities produce hazard of place 103 and are needed to examine smaller geographic areas. Our study captures the complexity working within two vulnerability interactions that incorporate variables from disaster models and population characteristics within the HGB. EDA captured patterns of census tracts that experience high rates of average loss in relation to race and poverty within the city of Houston. These areas might be overshadowed by larger census tracts located closer to the gulf coast. ESDA found significant spatial clusters that encourage researchers to incorporate historical hurricane disaster data into vulnerability models to better understand building loss in dollars. Median household value in lower incomes areas show lower disaster losses in relation to higher income communities, but additional research is needed to investigate the proportion of loss of dollars in relation to income.
There are merits of ESDA for public health applications especially with the brushing and displaying relationships between variables. 104 Our research confirmed that brushing and linking the spatial autocorrelation scatterplot to maps, graphs, and charts was essential in discovering and narrowing the list of indicators. As we progressed to spatial regression, formalizing the hypothesis with key variables was essential to avoid creating models that overfit the data. 105 Therefore, this framework is a systematic way to analyze variables of interest derived from multiple sources.
When incorporating GIS methods into the framework, decisions about data types and geographic units are needed. Data collected in HGB can be aggregated by census tract, zip code, and super neighborhoods (within Houston city limits). In general, data aggregated at higher level governmental units (county or city) compared with data aggregated by smaller units (census tract or block groups) are less reliable as indicators of environmental burdens, and less accurate in identifying the affected populations. When using larger geographic units, homogeneity within the specific demographics unit cannot be assumed, because of the difficulty estimating the average impact of environmental exposure within geographic boundaries. Also, depending on the level of units of analysis, the distribution of interacting factors, such as poverty or racial composition is often under- or overestimated. 106 The availability of data often dictates the level of aggregation, and one of the obstacles of conducting our research is working within such data constraints.
Another issue regarding data utilization is the availability of compatible community- or neighborhood-level data that can be compared across geographic locations. 107 , 108 There are challenges and limitations associated with databases when examining data both vertically (overtime) as well as horizontally (multilevel). When we started our initial disaster vulnerability research and prediction analysis, Hurricane Harvey had yet to manifest. Moving forward with research, this study continued to work within the Hurricane Ike disaster loss data to compare outcomes between predictive and GIS models. This approach provides opportunities to utilize the framework to investigate other natural disasters or possibly look at disasters within the context of space over time.
Our study sets disasters and their impacts within wider social contexts 109 and highlights social factors that affect the proneness of various groups to harm. 110 Studies of social vulnerability have comprehensively documented the inconsistent impacts of hazardous events on socially vulnerable population groups. 111 , 112 , 113 , 114 , 115 , 116 There are limitations when using predetermined indices because they do not discern which theme is contributing to the overall vulnerability or variables to a particular theme. 117 Some of the approaches used to assess vulnerability tend to assign specific weights to indicators based on their relevance and correlation to the topic in question. There are no reference data for weights or final vulnerability scores 118 and many studies tend to avoid them. 119 Finally, these parameters and indicators do not occur individually but in combination leading to amplified vulnerability scores. 120 , 121
Environmental justice researchers looking at environmental hazard exposures and population characteristics can also use this framework. The research question for any proposed study will dictate the level of analysis needed in the methodological framework. There is value in all three steps for hypothesis generation, understanding spatial randomness within a variable, and spatial relationships between variables.
CONCLUSION
The use of the Hazus software offers an expanded use of predictive performance methodology since indices can be assessed based on the generated losses. Hazards are significantly reduced when appropriate land-use planning and development oversight are performed, but the majority of mitigation plans are not succeeding in actually changing development or behavior to reduce damage in the future. This kind of analysis enables the creation of better hazard mitigation and disaster recovery plans, thereby enabling a more just and effective disbursement of hazard mitigation and recovery funds.
Health and environmental equity research can benefit from the integration of GIS methods into traditional statistical approaches to investigate neighborhoods, socioeconomic and demographic characteristics, and hazardous exposure factors. There is a new emphasis placed on the built environment to understand surroundings of a neighborhood that may contribute to differential health outcomes, particularly between racial groups.
The concept of the built environment plays an important role determining population health. Geographic visualization and spatial analysis are a promising approach to identify areas with various characterizations of interest in the field of public health. It is important to understand the role of EDA and ESDA in the process and the limitations and assumptions of both the data and GIS technologies to ensure the correct interpretation of outcomes.
Footnotes
AUTHOR DISCLOSURE STATEMENT
The authors have no conflicts of interest or financial ties to disclose.
FUNDING INFORMATION
This research received no specific grant from any funding agency in the public, commercial, or not-for-profit sectors.