
Abstract
Background:
This research investigated and identified significant spatial clusters of asthma and chronic obstructive pulmonary disease (COPD)-related emergency department (ED) visits and in-patient (IP) hospitalizations, and social determinants of health in Sangamon County, IL. Sangamon County falls in the worst quartile of Illinois counties for age-adjusted asthma ED visits from years 2016 to 2018 (40.69/10,000 adults) and hospitalization rates from years 2009 to 2011 (14.4/10,000 adults). Age-adjusted COPD ED visits were 28.3/10,000 adults compared with 17.7/10,000 adults in Illinois. Age-adjusted COPD IP visits from years 2009 to 2011 were 21.1/10,000.
Methods:
Patients within the Sangamon County, Illinois geographic boundary were mapped according to diagnosis for a total of 385 unique patients with a 99% match rate. 2014 U.S. Census American Community Survey (ACS) data provided key sociodemographic variables associated with disadvantaged communities and health disparities, including education level and employment.
Results:
Overall, low median income, lower median year of housing structure, and percent health insurance emerged as key spatial indicators of COPD IP/ED and asthma ED visits. Significant clustering between health outcomes and these variables deviates from current large urban-based research literature on asthma and COPD.
Discussion:
Analysis of other types of socioeconomic, housing, and health insurance variables revealed that significant spatial components were nonexistent in rural areas. Rural social determinants of health indicators are markedly different from current respiratory disease literature.
Conclusion:
Further studies are needed, which are particularly important for those with chronic respiratory conditions who live in older homes.
INTRODUCTION
Asthma is a chronic condition characterized by a combination of inflammation, airflow obstruction, and bronchial hyper-responsiveness. In 2016, asthma was responsible for 1.7 million emergency department (ED) visits, 9.7 million physician office visits, and 188,968 in-patient (IP) hospitalization stays. 1 The estimated annual cost of asthma in the United States, including medications, doctor visits, hospital admissions, lost pay due to sickness, and decreased school and work productivity, is $81.9 billion. 2 In general, nonwhite race, younger age, season, environmental tobacco smoke exposure, and outdoor air pollution such as traffic emissions are known risk factors for asthma exacerbations. 3 ,4 The highest prevalence of asthma in U.S. adults was among African American (9.3%) and Puerto Rican (14.1%) populations. 5 The city of Springfield, IL is a small metropolitan area of nearly 120,000 residents and is the largest city in Sangamon County, IL. According to the Illinois Department of Public Health, Sangamon County is in the 75th percentile or higher for both adult asthma prevalence and asthma-related adult emergency room visits per 10,000 people in the state of Illinois. 6 In addition, the 500 Cities Project from the Centers for Disease Control and Prevention and the Robert Wood Johnson Foundation estimates that the age-adjusted prevalence rate of asthma among adults in Springfield, IL is 10.3%, higher than the state and national estimates of 9.1% and 8.3%, respectively. 7 The estimated prevalence rates by census tracts ranged from 7.7% to 15.4%, with the highest rates clustered in eastern and northern census tracts within the city limits. 8 Owing to the notable asthma burden in Springfield, IL and that variation in rates occur throughout the city, it is important to understand how asthma outcomes (ED visits/hospitalizations) vary by geography. There are also statewide variations in chronic obstructive pulmonary disease (COPD) outcomes, and research highlights that COPD may be more prevalent in states with large rural communities. 9
COPD, a severe incurable lung disease that causes irreversible airflow blockage and breathing-related problems, 10 was the third leading cause of death in the United States in 2015. 11 Approximately 15.5 million adults were diagnosed with COPD and the global COPD burden is projected to increase as the population ages. 12 In 2010, the disease cost the U.S. $32.1 billion dollars, with project costs attributable to COPD to increase to $49 billion by 2020. 13 According to the National Heart Lung and Blood Institute (NHLBI), >534,000 people have been diagnosed with COPD in the state of Illinois. 14 The Illinois Behavioral Risk Factor Surveillance System estimates that about 7.5% of the Sangamon County, IL population has COPD, compared with 5.8% in Illinois. Age-adjusted COPD ED visits for Sangamon County, IL were 28.3/10,000 adults compared with 17.7/10,000 adults in Illinois. These rates vary by zip code within the county. 15 Robust spatiotemporal data from this study may aid in the development of specific asthma and COPD morbidity reduction programs in the high-risk smaller populated areas.
Sangamon County, IL has a total population of 197,465 residents with an average of 227 people per 2.59 square kilometers and 9 rural census tracts out of 475. There are 3126 farms within the 877 square mile county boundary and ∼90,000 housing units with a median home value of $115,000. About 65% of the housing units were built before 1979 with 40% of them being built before 1960. The population is primarily white (82.8%), African American (12.9%), and Hispanic (2.4%). 4.3% of 18–64 years and 6.4% of 65 years and older live in poverty in comparison with 13% and 8.8%, respectively, statewide. 16
The complexity of health disparities involving multiple social determinants of health such as race, income, and education in relation to patient health outcomes benefits from a geographic perspective. 17 The objective of our study is to determine if space is a component within population and neighborhood characteristics as it relates to COPD and asthma ED and IP visits.
Therefore, this study investigates potential spatial relationships (nonrandom clusters of census tracts) between determinants associated with disadvantage in relation to adult asthma and COPD diagnosis within a smaller populated area.
METHODS
The target population of this retrospective cross-sectional chart review research included adults aged 18–85 years diagnosed with a primary diagnosis of asthma (ICD-9 code 493.XX and ICD-10 code J45.X) or COPD (ICD-9 code 491.XX and ICD-10 codes J40–J44) who visited Memorial Medical Center or St. John's Hospital located in Springfield, IL between January 1, 2014 and December 31, 2016. These are the only two hospital systems within Sangamon County, IL. A total of 594 participants were identified with ∼200 traveling from outside of Sangamon County, IL, which were included in the descriptive statistical portion of the study but not in the spatial analysis. Institutional Review Board STUDY00004079 met the criteria of exemption. Research involving the collection or study of existing data, documents, records, pathological specimens, or diagnostic specimens if the information is recorded by the investigator in such a manner that subjects cannot be identified, directly or through identifiers linked to the subjects. (For research conducted, funded, or otherwise subject to regulation by any federal agency “existing” means “existing at the time the research is proposed.” Otherwise, it means “existing at the time the research is proposed or will exist in the future for non-research purposes.” Furthermore, 2014 American Community Survey (ACS) data were collected for the 200 patients living in counties other than Sangamon County, IL.
Spatial integrity issues require continuous geographic boundaries to conduct spatial correlation tests. Therefore, the parameters for patient inclusion are defined as individuals who lived within the Sangamon County, Illinois geographic boundary. These patients were mapped according to asthma ED/IP visits, COPD ED/IP visits for a total of 385 unique patients with a 99% match rate. Patient data were then cleaned to remove duplicate addresses to geocode using ESRI ArcGIS software v.10.7.1. Individual-level data were aggregated to the census tract level and then converted to a rate with patient count in the numerator and total population for adults 18 years and older in the denominator. This conversion standardized the data allowing for the investigation of spatial clustering by census tracts.
Demographic factors extracted from patient charts include type of insurance, gender, race/ethnicity, and age. Descriptive statistics on demographic factors and disease outcomes were conducted in Microsoft Excel 2013. Furthermore, U.S. Census ACS data from 2014 (5-year estimates) provided key sociodemographic data, including but not limited to median income, education level, employment, race/ethnicity, age of housing, and insurance status. Census tract maps were created using three classifications, projected with NAD 1983 StatePlane Illinois East FIPS 1201 Feet with a scale of 1:558,914.
Geoda v.1.16 software examined census tract level spatial patterns of demographic, social, economic, and environmental factors associated with poorly managed asthma/COPD in Sangamon County, IL. Maps are an exploratory data analysis (EDA) visualization to identify possible patterns and investigate social determinants factors as it relates to space and place that are spatially significant. Maps of Sangamon County, IL generated with 2014 ACS data by census tract show possible overlapping patterns within the city of Springfield looking at race, employment, education, and health insurance (Fig. 1). Analysis of the remaining 2014 ACS variables showed no distinct patterns (randomly distributed). Our preliminary EDA steps support possible nonrandom distribution of these variables within census tracts throughout Sangamon County, IL. The next step is to conduct exploratory spatial analysis using Univariate Moran's I that determines if there is a spatial component within the variables. Then, Univariate and Bivariate Local Moran's I test statistic calculated possible spatial autocorrelation to investigate spatial randomness and identify potential clustering within and between variables by census tract. 18

Sangamon County, IL percent no health insurance and percent public health insurance by 2014 ACS census tract data with Jenks Natural Breaks classification method. ACS, American Community Survey.
RESULTS
A total of 114 asthma patients and 480 COPD patients were included in the descriptive statistics, which provided a complete picture of patients who traveled to hospitals located within Sangamon County, IL (Table 1). Most of the asthma patients were >36 years, and 88% of the COPD patients were >50 years. Most patients were female and white in both disease states. About 28% of those with asthma and 66% of COPD patients were on Medicare. Asthma patients had about 4.3 ED visits and 9.4 IP visits, on average. COPD patients had about 4.6 ED visits and 17.3 IP visits, on average. Table 2 compares the age of homes and socioeconomic status of all the counties represented in the data. Sangamon County, IL variables represent those used in the cluster analysis. The average of homes built before 1979 is 72.7%. The median household income ranges from $38,740 in Pike County to $61,995 in McLean County. Of those in the labor force, the percentage living in poverty ranges from 28.4% to 68%. Interestingly, of the 27 counties represented in all patient data, nearly all have their own hospital, although most are critical access hospitals.
Patient Demographic Data from Memorial Medical Center and St. Johns Hospital located in Springfield, IL
COPD, chronic obstructive pulmonary disease.
Housing Age and Other Socioeconomic Status Variables by County of Individual Patients Identified Receiving Health Care in Sangamon County, IL (Source: 2014: American Community Survey 5-Year Estimate)
In labor force.
Rural = RUCC 4–9, urban = RUCC 1–3.
RUCC, Rural-Urban Continuum Codes.
Before conducting tests of spatial autocorrelation, EDA, the use of visualizations such as maps, histograms, scatterplots, parallel co-ordinate plots and boxplots looked at each population health variable associated with concentrated disadvantage within Sangamon County, IL, including, race, insurance status, employment, and education. Then, potential relationships between these variables with correlation matrices illustrate potential relationships before adding the component of space. Maps present potential patterns within each variable to determine if a spatial component existed to conduct ESDA.
Common indicators of disadvantaged populations such as percent family poverty, percent unemployment, and percent less than high school education were spatially insignificant in relation to the asthma ED and COPD IP/ED illness rates and were, therefore, not in the result section of this research. Furthermore, additional factors such as race/ethnicity, public assistance, other health insurance types, and other poverty indicators were also spatially insignificant. The 2014 ACS variables that showed significant clustering included percent no health insurance, percent public health insurance, median household income, percent black population, percent white population, and median year of housing structure. This is a major deviation from urban concentrated disadvantage studies. ACS 2014 housing factors such as Occupied Housing Units by Year Structure Built mirrored the results of median year of housing structure. Year Structure Built (Renter-Occupied Housing Units) were spatially insignificant. The remaining housing factors had missing data, which cannot be analyzed for a spatial component.
2014 ACS percent no health insurance and percent public health insurance (Fig. 1) show a higher percentage of no health insurance within the city of Springfield and outlying farming communities. The lowest rates (1.0%–5.8%) are in the suburbs surrounding the city of Springfield. Unexpectedly, neighborhoods on the north and northeast side of Springfield, IL also have higher rates of public health insurance compared with the suburbs of Springfield, IL, and area farms around the perimeter of the county.
Mapping also displayed neighborhoods that are segregated by race. In Sangamon County, IL predominantly percent black populations are located within the city of Springfield with a higher percent white population living in the suburbs and outlying rural areas (Fig. 2). There are a few exceptions within the city of Springfield especially in lower income neighborhoods. Although these maps seem similar, there are several census tracts that are different and show diverse populations. Note that the legend for percent white population was reversed with the highest percentage of white population in a light color due to the large geographic area it covers within the county.
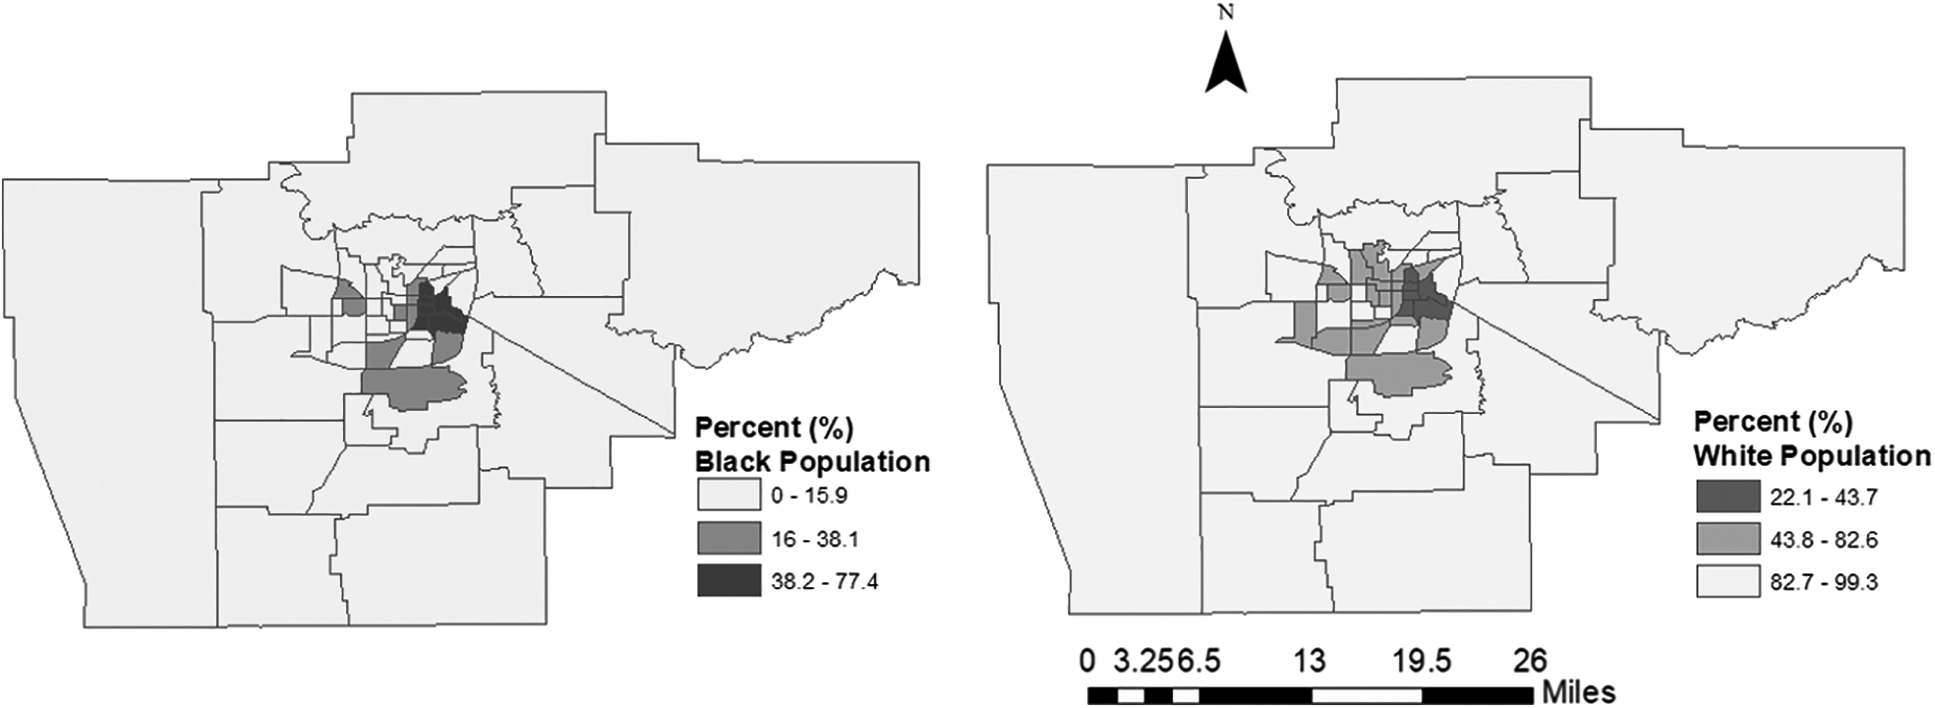
Sangamon County, IL percent black and percent white populations by 2014 ACS census tract data with Jenks Natural Breaks classification method.
Univariate Local Moran's I (queen matrix, 999 permutations, pseudo-p value >0.01) showed clustering of asthma ED (0.43), and weaker associations with COPD IP (0.29) and COPD ED (0.22). All clustering occurred within the city limits of Springfield, IL consisting of census tracts on the north and/or east side of the city. There is no clustering for asthma IP (0.09), meaning that asthma IP patients are randomly distributed throughout Sangamon County. There is very little overlap within census tracts of patient clusters for asthma ED versus COPD IP/ED. However, patient clusters for asthma ED and COPD IP/ED are located within two zip codes in the city of Springfield. Although COPD ED and IP patients lived in the same two zip codes within the city in comparison with asthma ED patients, heterogeneity exists by census tract within the zip code boundaries. Owing to Health Insurance Portability and Accountability Act protocols, maps with COPD/asthma rates at the census tract level cannot be shown.
Bivariate Local Moran's I (queen matrix, 999 permutations, pseudo-p value >0.01) examines potential clustering between each health outcome based on type of hospital visit in relation to census indicators. COPD ED rates show significant clustering with percent black population (0.317) with a weaker association with median year of housing structure (0.22) and some type of health insurance (0.23). In contrast, COPD IP rates illustrate significant clustering with low median household income (0.46), private health insurance (0.51), and percent white population (0.49). A weaker association exists with COPD IP rates in relation to median year of housing structure (0.29) and percent black population (0.23). Asthma ED rates reveal significant clustering with percent white population (0.41), low median household income (0.40), median year of housing structure (0.44), percent health insurance (0.46), and percent private health insurance (0.50).
Overall, lower median year of housing structure and low median household income emerged as key indicators for both COPD IP/ED and asthma ED visits, respectively (Fig. 3). Furthermore, percent health insurance showed spatial autocorrelation for private health insurance for both disease outcomes as well (0.50 and 0.51). In this study, significant clustering between health outcomes and sociodemographic variables deviated from current literature on asthma and COPD that has historically emphasized findings in large urban-based research. The maps show the two zip code boundaries in Sangamon County, IL that have significant spatial autocorrelation for both COPD ED/IP and asthma ED in relation to year of housing structure and median household income by census tract using quantile classification method (Fig. 3).

The maps show the two zip code boundaries in Sangamon County, IL that have significant spatial autocorrelation for both COPD ED/IP and asthma ED in relation to year of housing structure and median household income by census tract with quantile classification method. COPD, chronic obstructive pulmonary disease; ED, emergency department; IP, in-patient.
DISCUSSION
This study highlights major differences in health disparity literature that focuses on major metropolitan areas, social determinants of health, and COPD and asthma rates. Race was a factor with COPD ED and IP rates showing spatial clustering within the black population, whereas white populations experienced clustering with COPD IP and asthma ED rates. COPD ED and IP rates and asthma rates in our study also exhibit spatial clustering with other social determinants of health not commonly found in disparity literature such as low household income, type of health insurance, and age of housing. These findings are a shift from disadvantaged health inequity indicators such as poverty, unemployment, and education level. Previous research shows that minority and low-income populations experience higher levels of exposure to air pollutants. 19 In addition, research on urban areas has found that when residents are disproportionately exposed to high levels of poverty and unemployment in their neighborhoods, it serves as a contextual stressor that can manifest in poor health. 20 Moreover, structural and neighborhood-level constructs such as housing, crime, and pollution have been linked to poorer health outcomes; studies show that higher asthma burden occurs in populations that are disadvantaged, impoverished, African American, and Hispanic. 21 However, studies support that more research is necessary to understand populations that represent a larger demographic instead of looking at variables historically associated with disadvantage. 22 This geographic structural approach is common in larger cities that look at neighborhood boundaries, for example, Chicago Community Areas, Houston Super Neighborhoods, or New York Boroughs. This might explain higher mortality rates comparing rural and urban areas regarding chronic disease such as COPD with widening gap of life expectancy in rural areas. 23
Median age of housing structure might be a potential environmental factor that contributes to higher respiratory illness rates. Thirty-nine out of the 53 census tracts had a median household year between 1939 and 1977. Pre-1978 constructed homes are considered a higher risk especially due to lead paint exposure among other possible indoor air quality issues. Housing deterioration, including water damage and chipped paint, may thus increase exposure to indoor air pollutants. 24 Studies examining personal exposures and outdoor concentrations to particulate matter suggest that home characteristics and indoor air quality affect individuals with COPD. 25 Home environment is increasingly becoming an important facet in treating asthma with studies highlighting that poor housing quality is associated with poor asthma control. 26 Home-based triggers can include a variety of irritants such as dust mites, pets, mold, and indoor air pollutants. 27 In addition, poor housing and determinants such as poverty and social resources are associated with chronic asthma. 28 Median age of housing structure can be a proxy for health care providers to determine possible indoor air quality issues in the home. In addition, it is an area of further investigation to provide mitigation measures in addition to treatment. Maps also provide heterogeneity within ZIP code boundaries overlaid on census tracts allowing for the targeting of resources in a community with higher illness rates, older housing, and lower income.
Our analysis indicated that other variables commonly not found in COPD/asthma health disparity studies, including age of housing and median income, may contribute to increased negative health outcomes in Sangamon County, IL. Utilizing these clustering maps within the city of Springfield can identify neighborhoods that need additional assistance managing chronic respiratory illness especially in the context of a pandemic or epidemic. Limitations to this study include using larger geographic areas, such as aggregating health outcome data to zip code boundaries due to ethical and privacy concerns that may inadvertently support a homogenous bias in lower populated areas. Although zip codes are a smaller geographic unit, they mask heterogeneity at the census tract level. Furthermore, zip codes are administrative units that do not adhere to census-defined geographic units requiring the use of crosswalk files to reconcile these units. There are also decisions regarding time and space when choosing the ACS data set in relation to the time frame to extract patient data. There are also considerations when reconciling secondary data characteristics with COPD and asthma rates generated with individual patient records. These records provide greater detail at the census tract level; however, they might not be representative of the population visiting hospitals outside this study or that do not have access to health care. Patients with post office box numbers within the area are also excluded that might provide additional details regarding the population.
CONCLUSION
Asthma and COPD are both incurable chronic lower respiratory diseases. They are expensive disease states, requiring long-term medication management. Identifying areas with high rates of asthma and COPD and their subsequent rates of IP and ED visits may help to identify neighborhoods that need additional resources. This study highlights that rural and smaller metropolitan areas may be different than larger urban settings when investigating disease outcomes and social determinants of health. It is also possible that there is variation among otherwise seemingly similar rural areas. Moving forward with rural health disparity research, collecting both primary and secondary data at geographic units that capture heterogeneity is necessary to uncover potential spatial relationships in smaller communities. Expanding definitions of historically disadvantaged populations to investigate social determinants might capture health inequities in less densely populated areas.
Footnotes
AUTHOR DISCLOSURE STATEMENT
No competing financial interests exist.
FUNDING INFORMATION
The authors have no financial ties to disclose.