
Abstract
Air pollution, climate change, and other environmental factors contribute to increasing asthma in many cities, including Washington, DC. This work provides a case study of how community input, neighborhood-level health surveys, and air quality monitoring can inform the understanding of asthma and air pollution. A partnership between residents, concerned citizens, scientists, and educators has been working for environmental health in a DC neighborhood located on a major roadway, next to concrete batch plants and close to several construction projects. A 2016 Community Health and Safety Study by the DC Department of Health, Office of Health Equity, recognized this particular neighborhood as more vulnerable to health impacts from recent construction in the area, compared with the surrounding areas, due to lower average income and higher percentage of seniors and children. This work presents neighborhood health surveys and air quality monitoring data at a more granular, local level than available from DC government agencies. The health surveys documented residents' experiences around air pollution, asthma, and other health concerns. A key finding was evidence that asthma might be undercounted in this neighborhood; among residents who did not indicate a diagnosis of asthma, many discussed having symptoms that could reflect asthma. Air quality monitoring (particulate matter [PM]) did not indicate that federal air quality standards have been violated. Real-time PM data, however, illustrated how current PM standards, such as 1- and 24-hour averages, may fail to capture shorter duration high PM events that are consistent with resident concerns.
INTRODUCTION
The Buzzard Point neighborhood in southwest Washington, DC, faces traffic-related pollution and fugitive dust from concrete batching and major construction projects. It is bounded by a major roadway, S. Capitol Street (Fig. 1), whose traffic monitor near the Frederick Douglass Memorial Bridge has recorded high traffic volumes, with more than 40,000 vehicles per day (2015–2018). 1 Residents report anecdotally that traffic congestion on S. Capitol Street is often high, especially when there are games being held at one of the two stadiums. Higher traffic volumes and engine idling translate to higher levels of air pollution. 2 Construction activities have also increased neighborhood truck traffic.
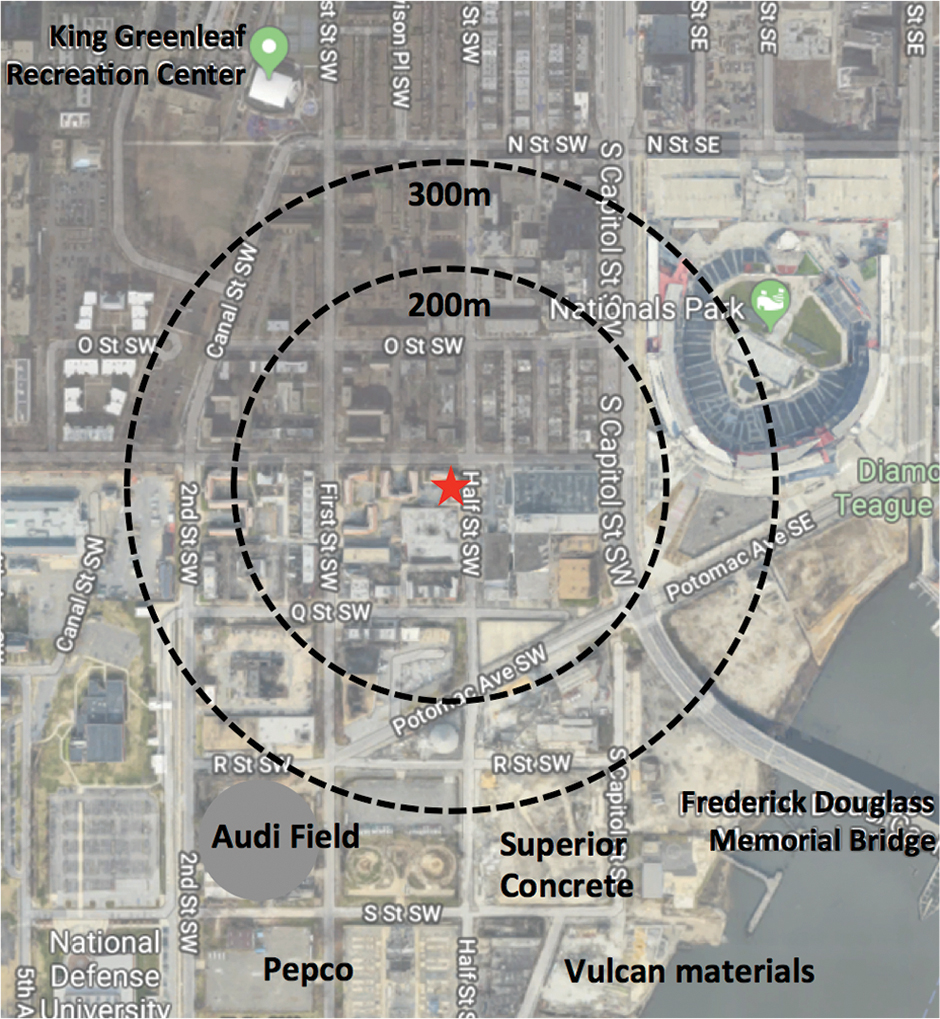
Map of Buzzard Point neighborhood showing proximity to two sports stadiums (Audi Field and Nationals Park), two concrete plants (Superior Concrete and Vulcan Materials), and an electrical substation (Pepco). South Capitol Street, a major thoroughfare, runs between the neighborhood and Nationals Park. The Frederick Douglass Memorial Bridge has some of the highest traffic volumes in DC, and a replacement bridge is being built alongside it. A DOEE PM2.5 monitor is housed at the King Greenleaf Recreation Center. The neighborhood monitor (depicted by a red star) is housed on the second floor of an apartment complex. Image from Google Maps. DOEE, Department of Energy and the Environment; PM, particulate matter. Color images are available online.
Sources of particulate matter (PM) also include industrial sources and fugitive dust from demolition and construction. 3 , 4 Major construction has included a new electrical power station (Pepco), a 20,000-seat stadium (Audi Field), and a replacement construction project for a major bridge (Frederick Douglass Memorial Bridge), which will soon be followed by demolition of the old bridge. In addition, there are concrete batch plants (Superior Concrete and Vulcan Materials) in proximity to low-income public housing units and garden-style townhomes, most of which are low rise and lack central ventilation. One of the concrete batch plants, Superior Concrete Materials, renewed its permit during the monitoring period. That facility was recently penalized for violations of the Clean Air Act before the repermitting. The two counts were operating without a required operating permit and with a stationary engine. 5
During the construction of Audi Field (July 2016–July 2018), fence-line monitoring conducted by the DC Department of Energy and the Environment (DOEE) and Haley and Aldrich Consulting Company provided further evidence for fugitive dust and diesel pollution. For each exceedance of their air quality action level, DOEE and/or Haley and Aldrich documented the cause and the action taken for dust mitigation. Several times it was determined that the source of high PM10 was not stadium construction, but instead, the adjacent concrete batching plants. There were also events where diesel fumes, rather than construction dust, triggered the action level. These findings implicate concrete batching and diesel as pollution sources, in addition to demolition and construction, affecting the neighborhood.
Fugitive dust, commercial truck traffic, construction noise, and traffic-related pollution are just a few of the many issues this community faces. In response to resident health concerns, the DC Department of Health Office of Health Equity conducted the 2016 Buzzard Point Community Health and Safety Study (CHASS). 6 Meetings with the city agencies responsible for oversight have occurred throughout the construction and concrete batch plant repermitting processes. However, residents have felt that the recommendations laid out in the CHASS have not been adequately followed, and that the community still has an unfair burden of pollution. 7 , 8 , 9
Air pollution and asthma
Emerging and convincing evidence suggests that traffic-related-air-pollution (TRAP) increases the burden of asthma in children in urban areas 10 , 11 , 12 and that low-income and African American families are more severely impacted. 13 An estimate of the number of asthma cases in the United States for 2000 and 2010 found an increase in asthma rates that was higher in urban areas and in blocks with the lowest household incomes. 14 Low-income and African American families are exposed to higher levels of fine PM (PM2.5) and ozone, and many low-income neighborhoods in urban cities are located near major highways where exposure to these pollutants occurs more frequently. 15 Along with ozone and nitrogen dioxide, PM2.5 induces airway inflammation and airway hypersensitivity, two characteristics common in children and adults with asthma. 16
African Americans live disproportionately near facilities that emit PM. 17 Studies have shown that short-term exposure to PM10 (PM smaller than 10 μm in diameter) and PM2.5 (PM smaller than 2.5 μm in diameter) has been associated with increased asthma symptoms, while long-term exposure has been linked to poor asthma control and decreased lung function. 18 Smaller particles penetrate further into the lungs bypassing natural barriers such as cilia in the nose that trap larger particles. Asthma outcomes are likely not only to be due to the size of PM but also on its chemical composition. 19 , 20
Additional factors may work together with TRAP to make low-income and African American families more vulnerable to asthma. A study of the association of air pollution and other factors with asthma hospitalizations found that residence near industrial areas, African American race, PM2.5 annual average, Medicaid eligibility or no insurance, obesity, and poverty were associated with an increased likelihood of hospital visits for asthma. While air pollution was a major factor, it could not be singled out as the only one to increase the risk of asthma exacerbation. 21
Health and air quality in Buzzard Point
In 2016, the DC Department of Health's Office of Health Equity released a Buzzard Point CHASS. 22 The study addressed the 20024 Zip Code within Ward 6, but also focused on the census tract that maps onto the Buzzard Point neighborhood, CT064 (Fig. 2). The study documented how, compared with those living in other neighborhoods within the 20024 Zip Code, CT064 residents are mainly African American, of lower socioeconomic status, and have a higher use of Medicaid or Medicare insurance coverage. Indices of economic well-being, including senior poverty, families with female heads of households, teen births, and unemployment, were all higher in CT064 than in DC overall. These point to a distressed neighborhood, with potentially more vulnerability to poor environmental quality because of the inability to economically cushion family members from adverse environmental exposures. 23 While census-tract-level analysis in the CHASS revealed how residents have socioeconomic disadvantages compared with the surrounding areas, the study did not provide health outcomes at the census-tract level. Measures of health outcomes by census tract might provide more precise estimates. Our survey used a survey instrument adapted from the Behavioral Risk Factor Surveillance survey, which asked questions about asthma diagnosis as well as asthma symptoms and severity of asthma symptoms. 24 , 25 , 26 Prompted by this gap in health data, our partnership worked with residents at the community level to gain a better portrayal of asthma and health in CT064.
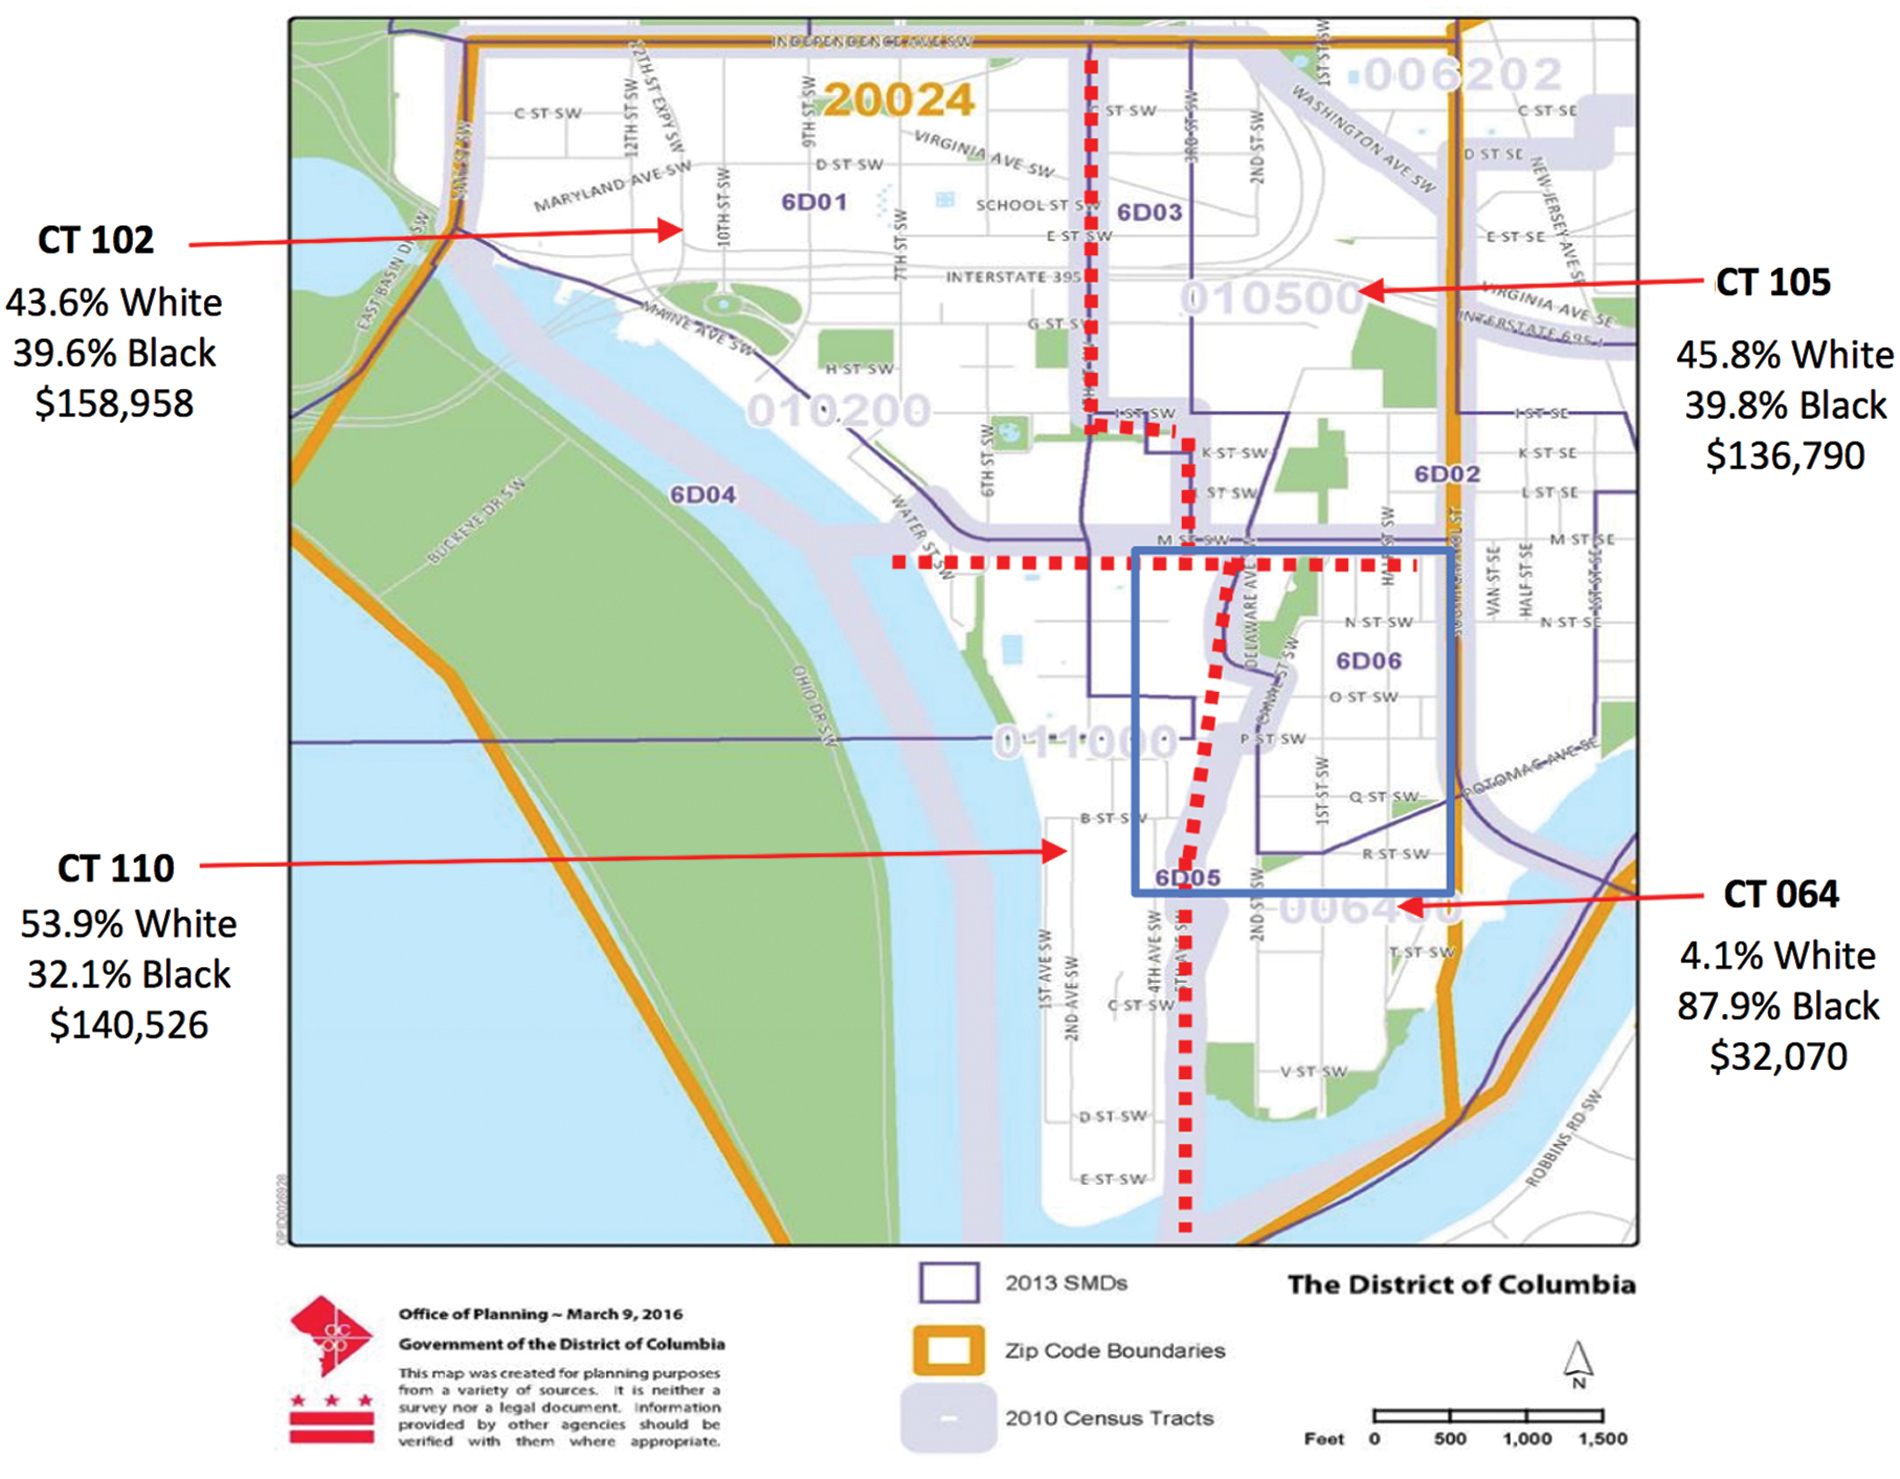
Demographics (% population and mean family incomes) of Buzzard Point. Adapted figure from the Buzzard Point Community Health and Safety Study by the DC Department of Health, Office of Health Equity. Percentages are 2010–2014 population estimates. The blue square marks the area represented in Figure 1. Color images are available online.
Studies from communities where associations between respiratory symptoms and air quality were directly measured 27 , 28 underscore the need for collecting data, enabling localized conditions such as proximity to pollution point sources to be correlated with health outcomes. Current stationary monitoring can fail to capture pollution hotspots, but a denser network of portable monitors, with high spatial resolution, can better capture local pollution that affects health outcomes. 29 At the time of the beginning of this study, the closest DOEE air quality monitors were over a mile away. In 2018, DOEE placed a Federal Reference Method (FRM) PM2.5 monitor in the neighborhood, on the roof of King Greenleaf Recreation Center, which is about 700 m away from the emission sources (Fig. 2). This study fills data gaps by monitoring PM in the neighborhood prior to 2018, by capturing pollution about 300 m away from emission sources (Fig. 2), and by taking measurements in real time (one-minute averages).
Proximity to emission sources was important since studies have shown how PM will be higher closer to sources than far away, with significant differences on a scale of several hundred meters. For example, in a region with good air quality, students at schools <300 m downwind from major roadways had higher incidences of asthma. 30 Some traffic-related pollutants dissipate within 50–100 m away from roadways. 31 Several hundred meters make a difference for fugitive dust as well. In one study, PM10 from a construction site fell 50% within 80 m, 32 and extrapolating the decay profile indicates that PM10 from the source could be over four times higher at 300 m versus 700 m away.
Through outreach activities conducted and coordinated by its Advisory Neighborhood Commissioner (ANC), Rhonda Hamilton, members from the community, university partners, and other interested members formed a nonprofit community organization called Near Buzzard Point Resilient Action Committee, to focus attention on the role of environmental pollution and health conditions affecting community residents. The resulting community-based data presented here illustrate the importance of working at the neighborhood level for a better understanding of local environmental conditions believed to contribute to poor health outcomes.
METHODS
Health survey and focused educational session
The survey was distributed through group educational sessions at a public housing complex (red star in Fig. 1). These were small group settings with ∼8 to 10 participants. The principal investigator read aloud the consent form to participants before the participants providing their written permission to participate. The participants signed the consent and completed the survey. A survey was considered complete when all questions were answered and returned to the principal investigator. All participants were permanent residents of the Buzzard Point neighborhood, and those who were not were excluded from data collection. Participants were recruited largely by the ANC, Ms. Hamilton, during the week. Sessions were held mostly in the evenings and on weekends. IRB was approved through the George Washington University (IRB#051729).
The survey (provided in the Supplementary Data) collected demographic information and responses to 36 open-ended, closed-ended, and Likert-scale questions/statements (hereafter “questions”) to assess health status and health perceptions. This was an educational intervention study using a paper survey with validated questions from the CDC Behavioral Risk Factor Surveillance System (BRFSS) 33 for the District of Columbia standardized survey instrument. BRFSS survey asked two important questions that we considered an indication of asthma and chronic obstructive pulmonary disease (COPD) recognizing that those who had asthma may also report having COPD. This is a comprehensive instrument; however, only questions related to quality of life, chronic diseases or illnesses, and demographics were asked. The survey tool also used the World Health Organization (WHO) quality-of-life scale. 34 Our self-reported survey responses do not permit us to tease out differences in respiratory illness in the population that responded.
Following survey completion, residents received a short demonstration on identifying asthma signs and symptoms, and on how air pollution and climate change can affect those with breathing problems. This was a hands-on demonstration with various asthma models and HEPA filter room air purifier to show that residents understood how to recognize asthma symptoms and how to use a room air purifier. The educational sessions provided participants with the knowledge and skills essential for identifying asthma symptoms and the various tools that could be used to manage asthma. Educational sessions also provided information about climate change and on how to use an air purifier to filter harmful PM and improve home indoor air quality.
PM monitoring
The neighborhood monitor (red star in Fig. 1) was located on the second-floor level of a residential apartment complex. It sampled air from outside the window through tubing. One-minute PM averages of 1-second readings were recorded using a TSI DustTrak DRX laser particle counter that reports fractions by size (PM2.5 and PM10).
Because laser particle counters are known to give PM2.5 readings that are consistently higher than instruments used for regulatory purposes (FRM), 35 there are limitations to the conclusions that can be drawn from the measurements. Deviations from FRM also depend on weather conditions and particle size. 36 PM10 data reported here are directly from DustTrak readings. Previous work 37 using the same instrument included PM2.5 calibration. PM2.5 data reported here are calibrated, using the same method as before.
RESULTS
Health survey
The survey was a convenience sampling of 97 individuals, roughly 4% of the census tract population of 2569 for CT064. 38 Responses are in Supplementary Tables S2–S7 and shown graphically in Supplementary Figure S2. Figure 3 shows the respondents' demographics, compared with CT064 as a whole. Respondents were overwhelmingly female. One in five respondents was 65 years and older, a higher percentage compared with CT064 as a whole (13% 39 ). The majority (n = 91, 94%) identified as African American, similar to the 89.7% black non-Hispanic reported for CT064 in 2012 40 and 74% black in 2018. 41 However, respondents were less likely to be married or to have a college degree, compared with CT064 as a whole. Respondents' income distribution was consistent with CT064. The average income for CT064 was $32,070 for 2010–2014, with an 18.7% unemployment rate and 47% in poverty. 42 The 2018 census data list a median household income of $30,991 and a 35% poverty rate. Table 1 shows generally poorer self-reported health outcomes for survey respondents, compared with DC as a whole.
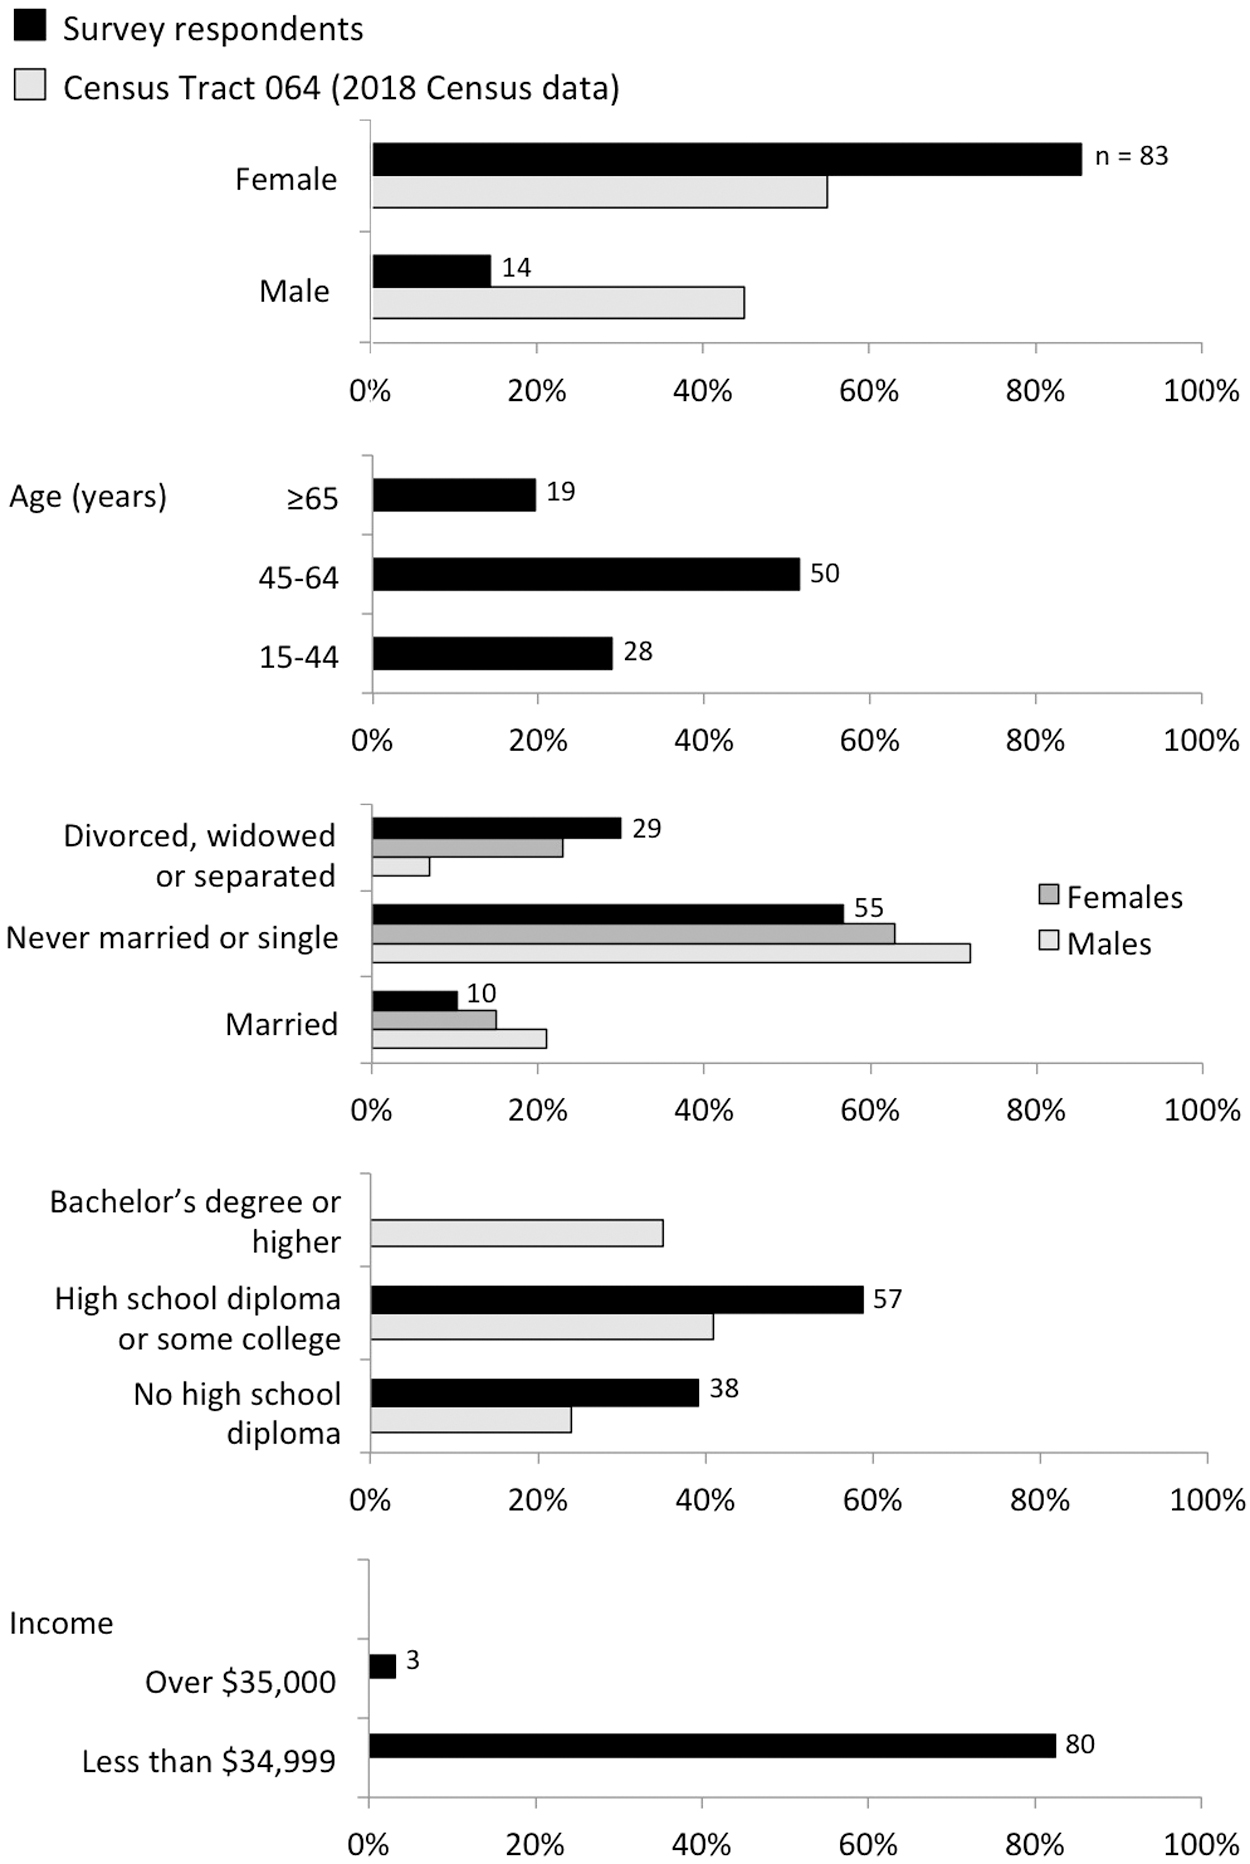
Demographics of survey respondents (n = 97, black) compared with data for CT064 as whole (gray). Census tract data are from 2018 (5-year average) found online. Some fields are missing in the figure because categorization of age and income differs between census data and survey response data. Numbers of respondents who gave a particular answer are listed. Not shown are the numbers who did not answer a question.
Indicators of General Health for Survey Respondents in the Buzzard Point Neighborhood Compared with Other Areas of District of Columbia
Source: District of Columbia Department of Health, Office of Health Equity, “Buzzard Point Community Health and Safety Study, (CHASS). 2016. <
Source: DC Department of Health, Behavioral Risk Factor Surveillance System Annual Report. 2017. <
COPD, chronic obstructive pulmonary disease; NA, not available.
Almost half (n = 39) of those surveyed reported that they had been told at some point that they had asthma, and the majority (n = 32) reported that they still had asthma. We did find that there was an overlap (n = 16) of those who reported asthma and COPD diagnoses. Most received their asthma diagnosis when they were young (Fig. 4). In addition to those diagnosed with asthma, 24 reported experiencing some symptoms of asthma, despite having no asthma diagnosis. Both groups report similarly on questions about their general health (Supplementary Fig. S1). NIH standards provide an asthma severity classification, which indicates asthma burden in participants. 43 The four classifications are in Supplementary Table S1. Figure 5 profiles survey respondents in the two groups, after classification according to these NIH standards. Some cases lacked enough symptoms for a clear classification but presented close to intermittent asthma. These were categorized as “almost intermittent.”
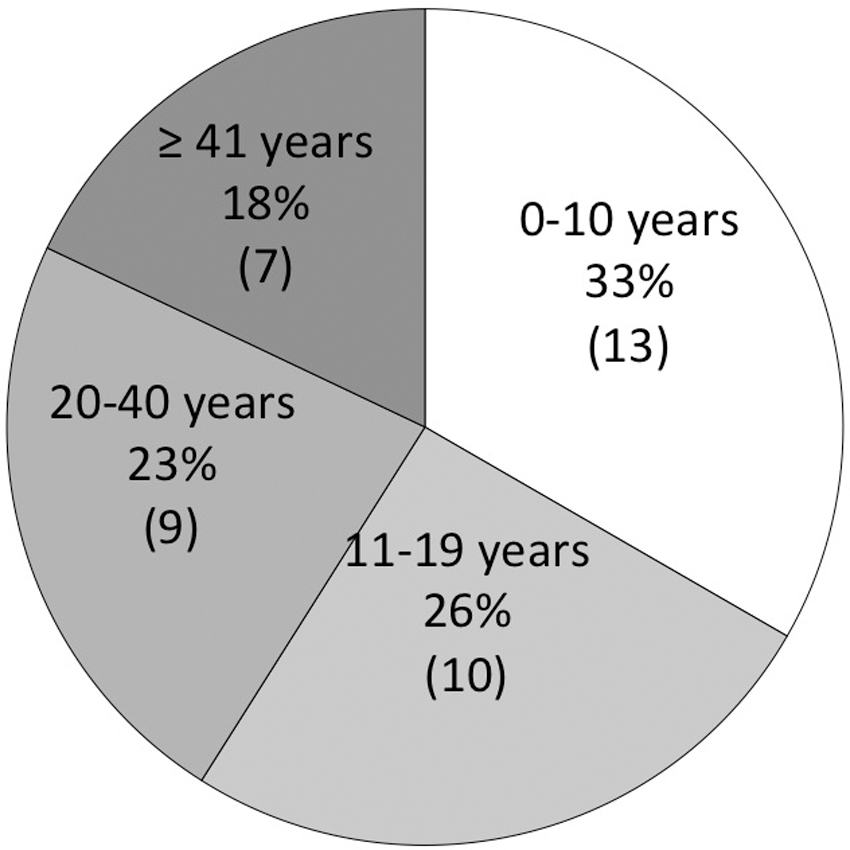
Range of ages at which surveyed residents with asthma received their diagnoses, younger than age 20 for 59% and age 20 years and older for 41%.

Classification of asthma severity for those diagnosed with asthma (left) and those without a diagnosis but reported experiencing asthma symptoms (right). A total of 63 survey respondents reported asthma symptoms, out of the total of 97 who responded to the survey.
Figure 6 shows responses to questions that probed participants' views on environmental hazards. Nearly 50% felt that air pollution had affected them personally or had affected a family member or friend. Those with an asthma diagnosis (n = 39) and those with asthma symptoms but no diagnosis (n = 24) were more likely to report that air pollution had affected them individually than those who did not have asthma or asthma symptoms (n = 26). The top three environmental issues that concerned most residents were air pollution, traffic/congestion, and pollution of our waterways.

Perceptions about environmental hazards.
Air quality monitoring
Neighborhood PM2.5 was below the U.S. Environmental Protection Agency (U.S. EPA) and WHO standards (Table 2). Table 2 shows higher neighborhood 24-hour PM10 averages than the WHO guidelines, but because PM10 readings were not calibrated against an FRM monitor, we cannot conclude that there were actual exceedances. DOEE monitors both PM10 and PM2.5 at the MacMillan Reservoir. Neighborhood PM10 24-hour averages showed weaker correlation with the MacMillan Reservoir than PM2.5 (Supplementary Fig. S3).
Neighborhood Particulate Matter Averages Compared with U.S. Environmental Protection Agency and World Health Organization Limits
Source: U.S. EPA, Particulate Matter (PM) Pollution. <
Source: WHO, Air Quality Guidelines. <
For 24-hour averages, listed values are the top five values over the monitoring period. Annual averages are for 7/26/16–17, 7/26/17–18, and 7/26/18–19, respectively.
PM, particulate matter; U.S. EPA, U.S. Environmental Protection Agency; WHO, World Health Organization.
For the Audi Field construction project, the action level for dust mitigation was defined as when a 15-minute rolling average during work hours exceeded 100 μg/m 3 at the fenceline, as measured by a DustTrak, the same type of instrument as the neighborhood monitor. Applying this criterion to the neighborhood data revealed that PM10 met the action level frequently, sometimes several times a week (Fig. 7).

PM10 at the neighborhood monitor. Gray marks periods when monitoring did not occur. The top graph shows 24-hour averages, and the dotted line marks the WHO level of concern, 50 μg/m
3
. Averages did not exceed the U.S. EPA 24-hour standard of 150 μg/m
3
. The bottom two graphs show the frequency at which PM10 reached the action level criterion, set at 15-minute rolling averages exceeding 100 μg/m
3
. The middle graph indicates the number of minutes per day that the action level was exceeded. The bottom graph indicates the number of days per week that had action level events. The asterisks indicate the two times that data were collected on July 4, when fireworks are known to contribute to high PM. Sources for the WHO and U.S. EPA 24-hour averages: (
DISCUSSION
Health surveys
The CHASS report described health data at the zip code level. Chronic lower respiratory diseases were among the top 5 causes of death. Along with cardiovascular diseases, cancer, and accidents, the zip code had a slightly higher death rate for lung cancer. The zip code had a higher prevalence of adult asthma than both DC and the nation as a whole (Table 3), similar to rates in Wards 4, 5, 7, and 8, where more low-income and African Americans reside, and higher than Ward 3, which has the highest income and a higher percentage of Caucasians.
Comparison of Adult Asthma Prevalence for Buzzard Point Compared with Selected Wards in the District of Columbia
Source: Centers for Disease Control and Prevention National Health Information Survey 2018. <
Source: District of Columbia Department of Health. Overview of Asthma in the District of Columbia, May 2016. Community Health Administration, Asthma Control Program.
Source: District of Columbia Department of Health, Office of Health Equity, “Buzzard Point Community Health and Safety Study, (CHASS). 2016. <
This study was motivated by community residents who felt that the zip code level reporting of health outcomes failed to capture their realities. While the health survey data presented here may not be generalizable to the entire CT064 census tract, a known limitation to community-based research, 44 Figure 3 illustrates how the survey respondents include those more vulnerable. They represent a higher percentage of women, elderly people, not currently married, and those without college degrees compared with the census tract as a whole.
By focusing on the residents in the poorest and least white census tract within the zip code, this study begins to illustrate health disparities that were not as apparent in the CHASS zip code level. While zip code 20024 and DC had similar percentages of self-reported health as fair or poor, as opposed to good or better, 12.8% in DC and 11.2% in zip code 20024, 45 the percentage among survey respondents was 40.2% (Fig. 3 and Table 1). While zip code 20024 had a higher asthma rate compared with DC (Table 3), 46 42.3% of respondents reported an asthma diagnosis. Compared with DC as a whole, respondents also indicated adverse health outcomes at higher rates (Table 1).
Health insurance coverage was similar for respondents with the rest of DC, as 90.7% indicated health insurance coverage, compared with 97% in DC overall. 47 The majority (84 out of 97) had at least one health care provider and had been to a routine checkup within the last year (76 out of 97). Cost was an obstacle for residents obtaining health care. Almost a quarter (24 out of 97) reported not seeing a doctor when needed because of cost, on par with a national estimate of 1 in 4 Americans in 2020. 48 It follows that residents' poor health compared with other parts of DC is not caused by a lack of health care. We acknowledge that health care is complex and there are far more reasons that residents may experience lack in health care such as limited transportation as an example; however, our survey questions were limited to the CDC BRFSS validated instrument.
Of the health indicators in Table 1, asthma prevalence was significantly high. Many who did not indicate a diagnosis of asthma discussed having respiratory symptoms consistent with asthma or chronic bronchitis. While 42.3% indicated having been diagnosed with asthma, 64.9% had either a diagnosis or symptoms of asthma. Those meeting the NIH classification of intermittent or more serious asthma comprised 55.7%. Individuals whose responses would classify them as having severe or persistent-moderate asthma included those who indicated no asthma diagnosis. More than half of the participants who self-disclosed having an asthma diagnosis were diagnosed during childhood or adolescence, while a third self-disclosed diagnosis as adults. Adult-onset asthma is a common occurrence, affecting 235 million people worldwide and causing 350,000 deaths each year. 49 Asthma diagnosed later in life appears to be more severe and progressive. Those who were diagnosed during childhood or adolescence appear to have less severe asthma, and remission is common. 50 This work categorized participant asthma based on the NIH guidelines; however, we recognize that there are limitations in that the small numbers should be viewed with caution. Still, the data highlight that many participants have a long-standing history of asthma, evolving from childhood, which may demonstrate under normal circumstances a mild asthma condition. The air pollution from traffic and construction dust this community has faced may exacerbate asthma symptoms and increase the severity and progression of their asthma condition.
The CHASS summarized resident concerns and stated how, “Specifically, residents are concerned that their ‘already vulnerable community—home to many children, seniors, and many residents with fragile health—will be further threatened by the trucking of contaminated soil, dust, construction traffic, noise, and other disturbances.’” Survey responses echo the quote, with air quality and traffic pollution cited as particular environmental concerns (Fig. 6). More than 50% of those surveyed, regardless of whether or not they themselves had asthma, felt that poor air quality affected their health or the health of a family member or friend, which speaks to the perception of poor neighborhood air quality.
Air quality
A surprising finding was that, by U.S. EPA standards, neighborhood PM levels (Table 2) were not problematic. Yet, PM may be contributing to the community's high levels of asthma, and community voices have consistently expressed concern about poor air quality. The failure to exceed U.S. EPA standards for PM, while residents continue to perceive poor air quality and health, highlights a mismatch between current methodologies and community perceptions that this study has the potential to inform.
A first possibility is that PM standards should be more stringent, echoing recent studies that call for a closer examination of U.S. EPA 51 and WHO standards. 52 Even for individuals with exposures below the EPA threshold for PM2.5, higher exposures correlated with higher rates of hospitalization for respiratory and cardiovascular diseases. 53 Growing evidence about the health effects of coarse PM (the fraction of PM10 larger than PM2.5) puts particular attention on PM10 standards, which are in the United States three times higher than for the WHO (Table 2). Coarse PM can deposit in upper airways, 54 and at high-enough concentrations, can penetrate to the lungs. 55 Evidence of coarse PM health effects is growing. 56 , 57 In Taiwan, it was associated with increased hospitalizations for respiratory disease, even after controlling for other air pollutants. 58 A national-level study using Medicaid health data showed that long-term exposure to coarse PM is associated with increased asthma in children, with a stronger correlation for children younger than 11 years. 59 These outcomes may relate to chemical composition. Dust from concrete batch plants contains mostly calcium oxide and silica, with trace quantities of metals such as strontium, manganese, and chromium. 60 Exposure to silica can lead to irreversible lung disease, as documented in workers who break up concrete using drilling devices. 61 These studies indicate how further work to inform new PM10 standards should include consideration of chemical speciation.
A second possibility is that 24-hour and annual averages fail to capture residents' lived experiences, and that a higher time resolution is needed. A key finding from this work is that 15-minute averages were able to describe the neighborhood's poor air quality in a way that annual averages did not. The analysis relied on the action-level criterion for dust mitigation from the Audi Field construction project, 15-minute rolling averages above 100 μg/m 3 PM10. Counting these short-lived, high-PM events revealed that patterns were obscured in averages. In July 2016, such events occurred up to four days a week (Fig. 7). By the end of the monitoring period, however, the frequency decreased. This decrease was consistent with two changes. First, Superior Concrete underwent a new permitting process in late 2017, and the old facility ceased operation on July 20, 2018. Emissions from concrete batching plants are 27%–68% PM10, depending on the activity and degree of dust control, 62 and only 6% PM2.5. 63 The new facility was subject to stricter dust controls, and the decrease in emissions translated into lower PM10. Second, construction of Audi Field terminated at the end of July 2018. Construction and demolition, along with roadways, are more likely to generate coarse PM (PM10 that is larger than PM2.5) than fine particles. 64 Thus, an end to the Audi Field construction project also translated to lower PM10.
Our findings suggest that alternative methods of data monitoring and analysis should address short-event, high-PM exposures. Such exposures may overwhelm the defensive mechanisms in the upper airway that normally protect the respiratory tract from coarse particles. High acute or chronic exposures to chemical irritants could increase PM retention in the lungs. The ability of the mucociliary defense system may be disrupted in these circumstances. 65 High, short-term coarse particle exposures have been associated with increased morbidity and mortality for respiratory illness. 66 Acute exposure to concentrated coarse particles in 2-hour intervals caused mild cardiopulmonary effects in young-adult volunteer test subjects. 67 Thus, short-term, high-intensity exposures, such as the ones at Buzzard Point during peak poor air quality periods, may exacerbate the effect of exposure to PM. One study has suggested that imposing 1-hour PM standards rather than reducing 24-hour standards could reduce exposure risk that comes from short-duration, high-intensity events. 68 Another study illustrated how pollution hotspots experience transient peaks in PM10 on the hourly scale, and pointed out the need for data characterizing such peaks, to support epidemiological studies that relate pollution to asthma and other diseases. 69 The 15-minute timescale used in the Audi Field action level criterion indicates that even shorter timescales may be necessary, underscoring the importance of studies that characterize short-duration pollution events. 70 , 71 , 72 , 73 , 74
CONCLUSION
Community-based research informs both health and air quality research, in this case by providing information missed by conventional monitoring and data collection. Community health surveys revealed neighborhood-level discrepancies that had been obscured at a larger zip code level. An important conclusion therefore is that asthma may be underdiagnosed in the Buzzard Point neighborhood, and relying on diagnoses may lead to underestimating its prevalence in communities such as Buzzard Point. This important finding underscores the value of health data at a census-tract level, especially when there are socioeconomic disparities within the larger zip code level.
Neighborhood air quality data illustrated how time-resolved measurements capture spikes in PM that are obscured in averages. Further research to better establish the links between asthma and air pollution will require data collection on a high resolution in terms of both location and time, to capture census-tract-level health disparities and short-duration, high-pollution events that may affect the community health.
Footnotes
ACKNOWLEDGMENT
The TSI DustTrak is on loan from Smith College (MA, USA).
AUTHOR DISCLOSURE STATEMENT
No competing financial interests exist.
FUNDING INFORMATION
This work received support from the NSF grant 1531636, the DC Space Grant Consortium, and the University of the District of Columbia.
Supplementary Material
Please find the following supplemental material available below.
For Open Access articles published under a Creative Commons License, all supplemental material carries the same license as the article it is associated with.
For non-Open Access articles published, all supplemental material carries a non-exclusive license, and permission requests for re-use of supplemental material or any part of supplemental material shall be sent directly to the copyright owner as specified in the copyright notice associated with the article.