




Abstract
Emerging evidence from epidemiological studies has shown that exposure to particulate matter (PM) affects brain and neurological health in addition to respiratory and cardiovascular diseases. This poses serious public health issue, especially in developing countries with weak air pollution control policies and mitigation approaches. The study aimed to evaluate the short-term effects of ambient PM2.5 and PM10 (particles with an aerodynamic diameter <2.5 and 10 μm, respectively) concentrations on the resident of Arak (Iran). The World Health Organization (WHO) Health Assessment model was used to estimate the incidence of chronic bronchitis (ICB) among adults and prevalence of bronchitis (PB) in children, including morbidities such as restricted activity days (RADs) and work days lost (WDL). Annual mean PM2.5 concentrations were 12.9 and 24.1 μg/m 3 , whereas PM10 were 84.5 and 51.9 μg/m 3 in 2015 and 2016, respectively. In 2015–2016, 37.6%–56.9% for ICB, 28.0%–44.3% for PB, 2.5%–7.0% for RADs, and 2.4%–6.9% for WDL were attributed to ambient PM10 and PM2.5 exposures, respectively. Finally, 6–10 ICB, 6–10 PB, 279–788 RADs and 76–214 WDL attributable cases due to PM10 and PM2.5, respectively, could be prevented if the annual limit values of 10 μg/m 3 were not exceeded. This study could serve as proxy for similar urban residential environments across many developing countries to aid in informing local and national authorities about future stringent air pollution mitigation policies.
INTRODUCTION
Air pollution is one of the major environmental risks identified as the leading cause of global burden of diseases mostly in developing countries. 1 , 2 , 3 Anthropogenic activities, traffic emissions, industrial activities, and burning of biomass are known as one of the major causes of air pollution in most cities. 4 , 5 , 6 , 7 In addition, the effect of climate change has exacerbated urban air quality levels through long-range transportation of several pollutants from erratic forest fires. 8 , 9 All these sources emit several types of harmful air pollutants, including sulfur dioxide (SO2), nitrogen oxides, polycyclic aromatic hydrocarbons, and particulate matters (PMs) into the ambient environment, 10 , 11 leading to the formation of secondary air pollutants such as tropospheric ozone. 12 , 13 The situation is different in Middle East where frequent dust storms coupled with energy intensive petrochemical and oil industries are the main sources of air pollution, especially PM. 14 , 15
PM with aerodynamic diameter <2.5 μm (PM2.5) and 10 μm (PM10) are common in Middle Eastern region with high concentration levels exceeding the WHO human exposure threshold limits of 10 and 20 μg/m 3 for PM2.5 and PM10, respectively. 16 Recent studies showed that exposure to ambient PM could lead mortality due to asthma, chronic obstructive pulmonary diseases (COPD), ischemic heart disease (IHD), and myocardial infarction (AMI), and hospital admissions mainly for respiratory and cardiovascular diseases. 17 , 18 , 19 Some studies showed that exposure to high PM2.5 and PM10 concentrations is associated with the incidence of type 2 diabetes mellitus in few Middle Eastern countries (e.g., Iran and Saudi Arabia). 20 , 21 The mechanism underlying these health effects is due to the mediation of PM2.5 causing endothelial dysfunction, dysregulation of visceral adipose tissue, mitochondrial dysfunction, and brown adipose tissue alteration thereby inhibiting the production and functioning of insulin in humans. 22 According to the WHO, 84% of global population was exposed to annual PM2.5 and PM10 mean concentrations exceeding the limit values of 10 and 20 μg/m 3 , respectively, leading to millions of premature deaths in the world. 23 In Iran, several studies assessed the health effects of several pollutants in most cities. For instance, Faridi et al. 24 estimated the long-term effects of PM2.5 in Tehran, and stated that 24.5%–36.2%, 19.8%–24.1%, and 13.6%–19.2% of cerebrovascular diseases, IHD, and lung cancers, respectively, were attributed to PM2.5 for a 10-year period of exposure. The number of deaths due to PM2.5 and PM10 exposure are 131.0, 62.9, and 18.8 for total, cardiovascular, and respiratory mortality, respectively, and could be avoided if ambient PM levels in Hamadan city could meet the WHO limit value of 10 μg/m 3 . 25 In Hamadan, 2.5% of hospital admissions due to COPD and 4.7% of AMI mortality were attributed to PM10 (78.0 μg/m 3 ) and SO2 (45.1 μg/m 3 ) exposures, respectively. 26 According to Goudarzi et al., 27 about 92% of mortality and hospital admissions due to cardiorespiratory diseases occurred when daily PM10 concentrations in Kermanshah are <150 μg/m 3 .
The main objectives of this study are to (1) assess the temporal and seasonal ambient levels of PM2.5 and PM10 in Arak city (Iran) and (2) estimate the incidence of chronic bronchitis (ICB) and prevalence of bronchitis (PB) among children and adults as well as the number of restricted activity days (RADs) and work days lost (WDL) due to ambient PM exposure.
MATERIALS AND METHODS
Study area
Arak (34° 5′ 30″ N and 49° 41′ 21″ E) is one of the cities located in Markazi province in central Iran (Fig. 1), with an area of about 88 km 2 , a mean elevation of 1748 m, and a population of about 600,000 people living in six urban districts. For the past decades, there was a rapid increase in urbanization coupled with intense industrial activities and road traffic in the city, 28 leading to an increase of air pollutants emissions. 29 The climatic conditions of the city are characterized by hot and dry summer season with annual maximum temperature of 35°C and very humid and cold winter temperature of −15°C with relative humidity of 46%. The annual mean rainfall of the city is about 350 mm. The varied weather conditions of the city together with diverse pollution sources may result to high levels of ambient pollutants concentrations, thereby posing health threat to the population. 30
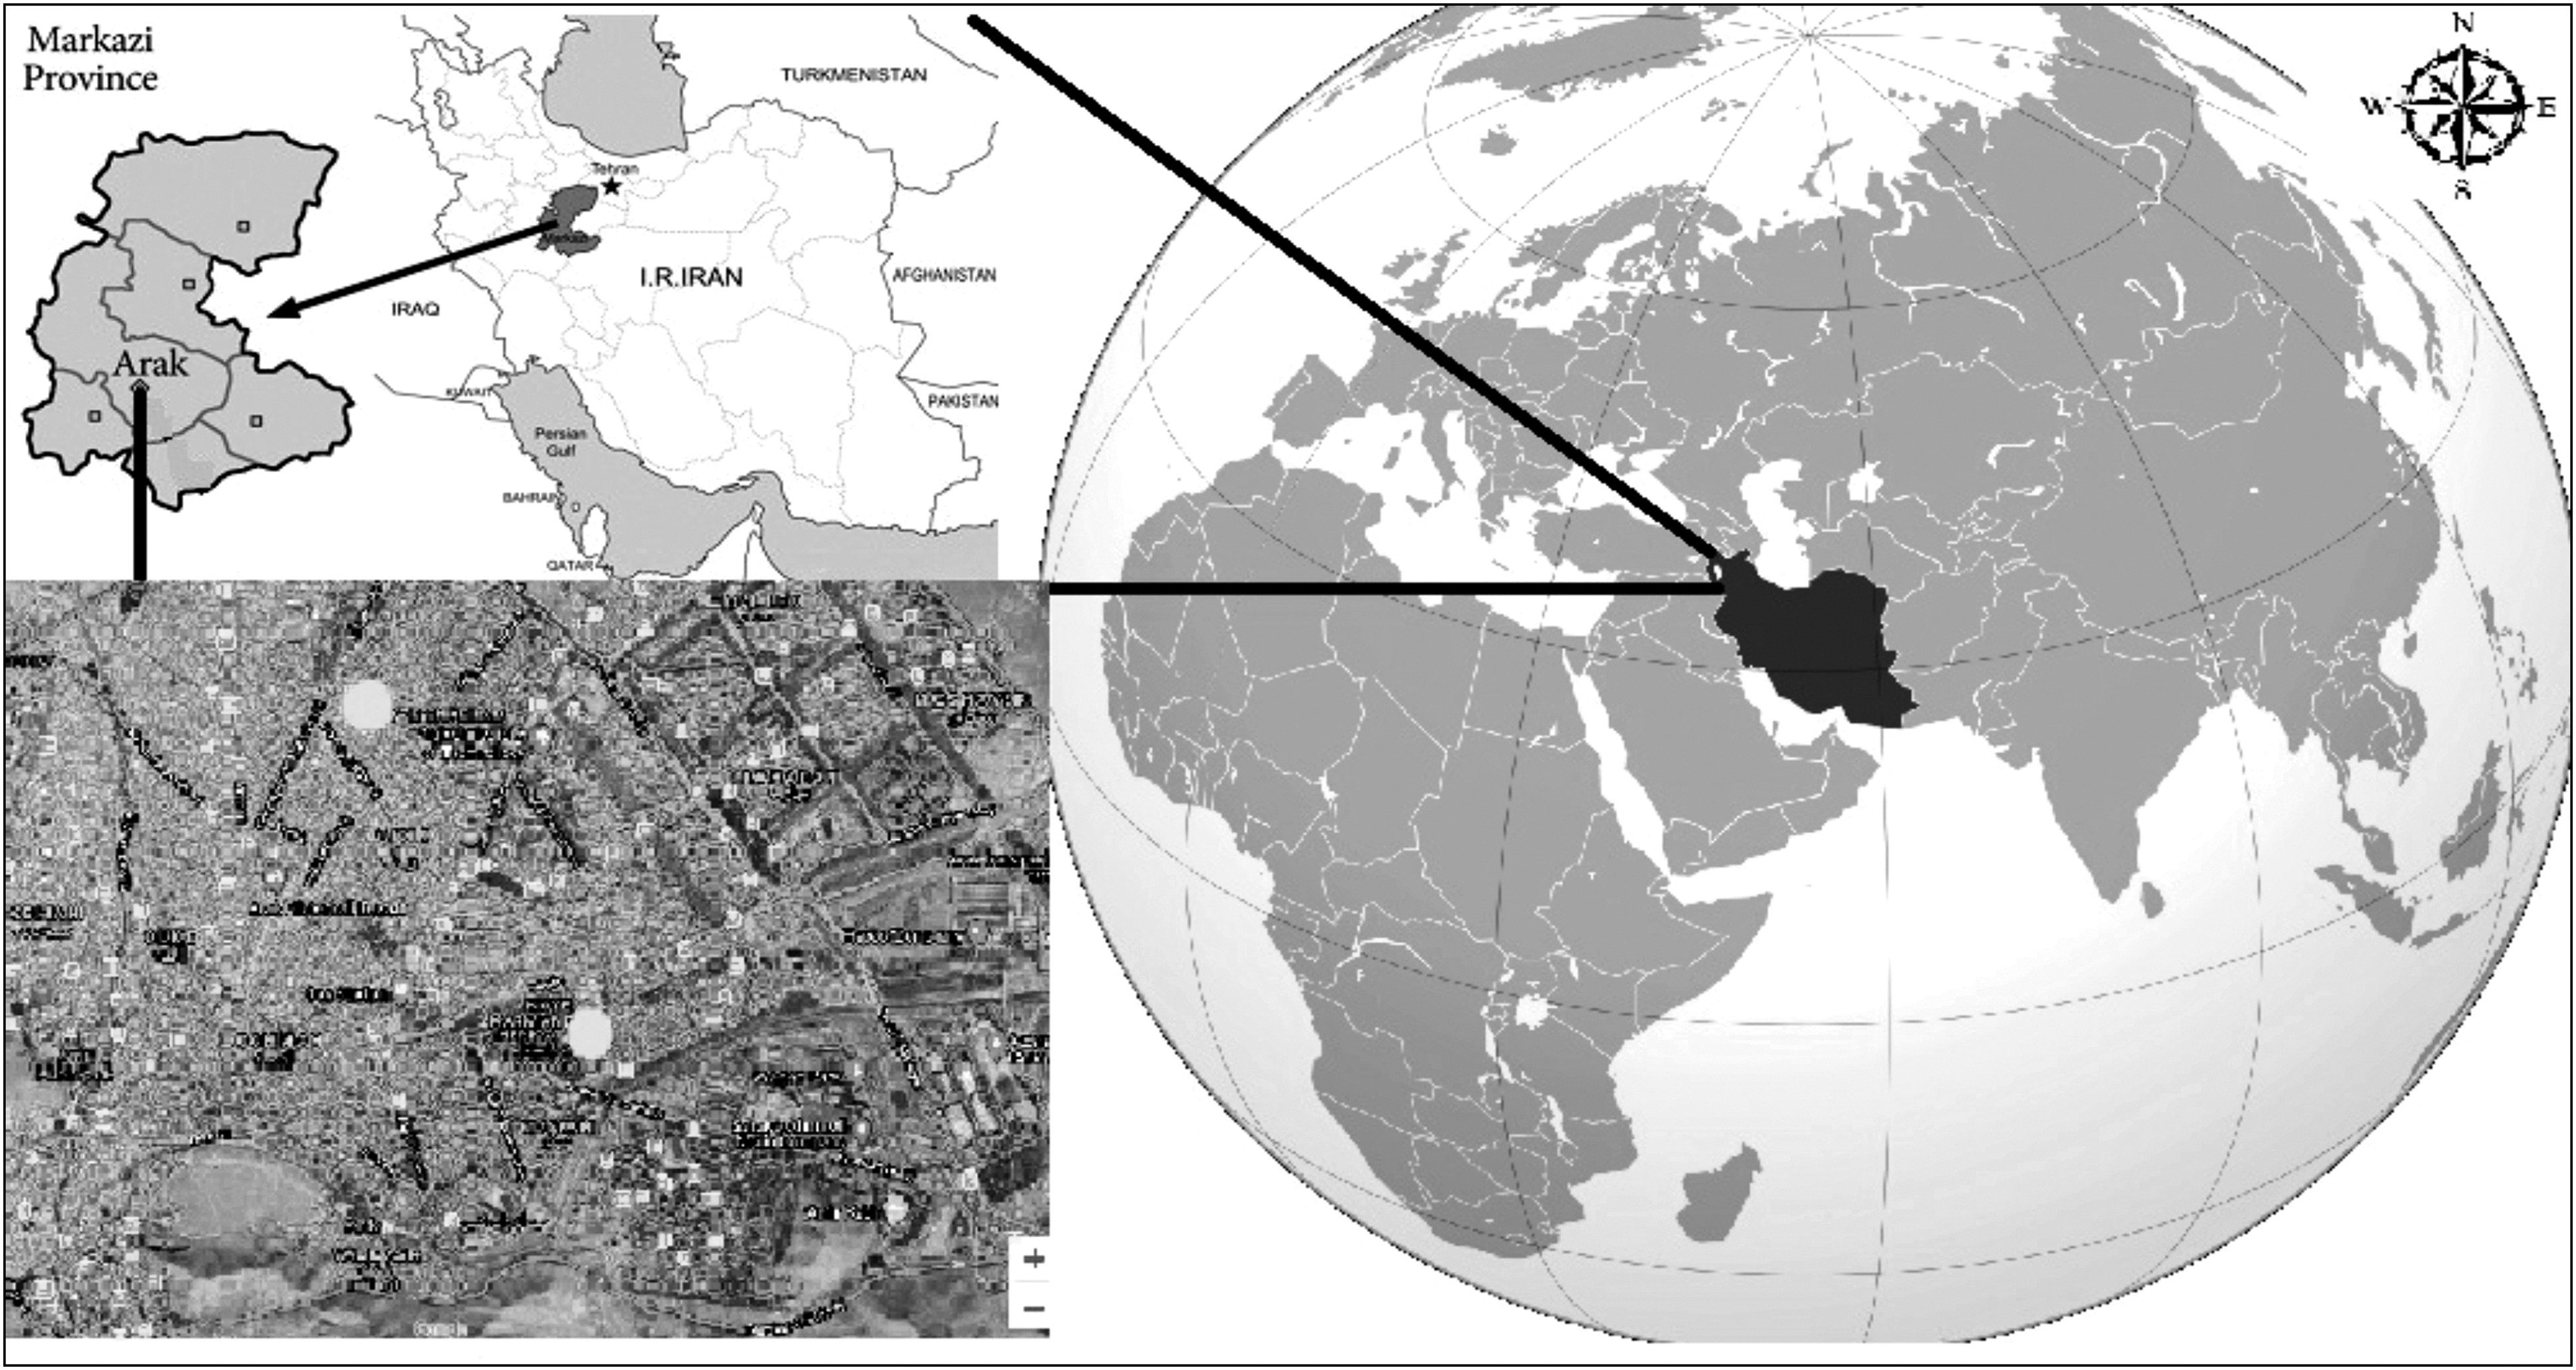
Location of Arak city with two air quality monitoring stations (white dots).
Ambient PM2.5 and PM10 measurements
Arak has two air quality monitoring stations, Shariati and Horbia (Fig. 1); therefore, we used the measured data by Environmental Agency of Arak (EAA) for analysis of health impacts between residents of the city. The ambient PM data were acquired from the Air Quality Monitoring Unit within the EAA. The unit reports, manages, and stores all air pollution data of Arak city. The PMs were measured through beta attenuation technique where 14 C element emits beta ray to measure the ambient PMs through the help of the scintillation detector. Hourly PM10 and PM2.5 data used under the study are exposure concentration levels from 1st January to 31st December in 2015 and 2016. The real-time hourly PM concentrations were converted to average daily exposure concentration levels with Excel software (version 10). The data were further converted to different concentration intervals with their respective frequency days of exposure based on the input requirement for health risk assessment model.
The health impact assessment model
The human health effects associated with exposure of ambient pollution under this study were estimated by the concentration-response model called AirQ+ (version 1.0) developed by the WHO Regional Office for Europe under European Centre Environment and Health group.
31
,
32
The model can estimate the short- and long-term burden of diseases resulting from exposure to some particular pollutants such as PM2.5, PM10, NO2, O3, and black carbon. The model also can estimate the mortality and morbidity of air pollution using epidemiological data, including relative risk (RR) and baseline incidence (BI) with either ambient or household air pollution data.
33
,
34
,
35
In this study, the health impacts were first estimated by modeling the attributable proportion (AP), which is the proportion of health impacts in a given population attributable to a given air pollutant c.
36
,
37
The default RR parameter in the model was derived from concentration-response model from cohort studies conducted in Europe and North America, RR is a relative risk associated with a particular health effect of an exposed population for a given pollutant exposure category.
38
The degree of health effects attributable to the exposed population was quantified as the function of BI and AP as shown in Eq. (2). The final excess number of cases of a particular health endpoint is then estimated according to Eq. (3).
where AP = attributable proportion, RR = relative risk value for a given air pollutant c, P(c) = population exposed to c, BI = baseline incidence rate of a particular heath effect, IE = frequency of pollutant exposure for different ranges of concentrations, NE = numbers of excess cases for a given health endpoint, and Z = population size of the exposed group. 39
Exposure assessment
The hourly PM2.5 and PM10 concentrations were converted to daily, seasonal, and annual average concentrations. The study employed annual average PM concentration data and health data of AirQ default RR values and BI data from literature to estimate the health impacts attributed to PM exposure as indicated in Table 1. The estimated health impacts were based on the assumption that the observed PM concentrations were the adequate representative of the mean population exposure levels. The number of excess cases and the AP of ICB, PB, RADs, and WDL were estimated based on the PM exposure concentration data, RR, and BI values (Table 1).
Baseline Incidence and Relative Risk for 10 μg/m 3 Increase in Ambient PM2.5 and PM10 of Arak Inhabitants at 95% Confidence Intervals
BI, baseline incidence; CI, confidence interval; ICB, incidence of chronic bronchitis in adults (≥18 years old); PB, prevalence of bronchitis in children (5–17 years old); RADs, restricted activity days (all ages); RR, relative risk; WDL, work days lost (≥18 years old).
Results
Temporal emissions of PM2.5 and PM10
Annual trends
Table 2 depicts the mean annual concentrations of PM2.5 and PM10 in 2015 and 2016. The annual mean PM2.5 concentrations (12.9 μg/m 3 ) in 2015 is about twice compared with 2016 (24.1 μg/m 3 ). However, the annual mean PM10 concentrations decreased from 84.5 μg/m 3 in 2015 to 51.9 μg/m 3 in 2016. This decrease could not affect the 2016 PM2.5 concentrations as they constitute significant proportion of PM10 concentrations. The annual maximum daily average (87.6 μg/m 3 ) for PM2.5 in 2015 showed a reduction compared with 2016 (105.8 μg/m 3 ).
Summary Statistics of Annual Emissions of PM2.5 and PM10 in Arak, Iran
Temporal seasonal concentrations
The seasonal (spring, summer, fall, and winter) plots of daily mean concentrations for ambient PM2.5 and PM10 are shown in Figure 2 for 2015 and 2016. Generally, a higher concentration of pollutants was experienced for all the seasons for the 2-year period. For PM2.5, summer seasons (18.2 μg/m 3 for 2015, 35.6 μg/m 3 for 2016) recorded higher average exposure concentrations, whereas lowest average concentrations occurred in the 2016 winter (3.6 μg/m 3 ) and fall (6.68 μg/m 3 ) seasons, which might cause very minimal health effects to the residents. Oppositely, there were generally high ambient PM10 concentration levels in 2015 compared with 2016. Also there were minimal seasonal variations for 2015 levels. Thus, Arak inhabitants were exposed to similar higher concentrations of PM10 for all the seasons. However, in 2016, the lowest PM10 concentrations occurred in spring (35.2 μg/m 3 ) with summer (69.3 μg/m 3 ) having highest levels.

Seasonal trends of PM2.5
Classification of the pollutants exposure concentrations
In this study, the person-day exposure of the daily average concentrations of PM2.5 and PM10 were classified based on WHO's predefined air quality guideline and interim target concentration levels categories (WHO 2006). These classifications were defined as low (<25 μg/m 3 ), moderate (25.0–37.5 μg/m 3 ), high (37.5–50.0 μg/m 3 ), and very high (>50 μg/m 3 ) pollution level for PM2.5, and low (<50 μg/m 3 ), moderate (50–75 μg/m 3 ), high (75–100 μg/m 3 ), and very high (>100 μg/m 3 ) pollution levels for PM10. Figure 3 illustrates the varied concentration classes of both PM2.5 and PM10 for 2015–2016 of which people of Arak are exposed. Most of the PM2.5 concentrations such as 0–29 μg/m 3 (maximum person-days of exposure of >100%) intervals ranges from low to moderate pollution levels, and 20–69 μg/m 3 (maximum person-day exposure of 93%) from low to very high levels for 2015 and 2016, respectively. However, the PM10 showed evenly distribution of different concentration categories for the entire 2-year period. The highest person-day exposure of 50% occurred when the concentration was 50–59 μg/m 3 for both 2015 and 2016. Also, most of the person-day (about 0%–23%) were exposed to PM10 concentration ranging from 100 to 349 μg/m 3 , which is deemed as very high pollution levels for both years.
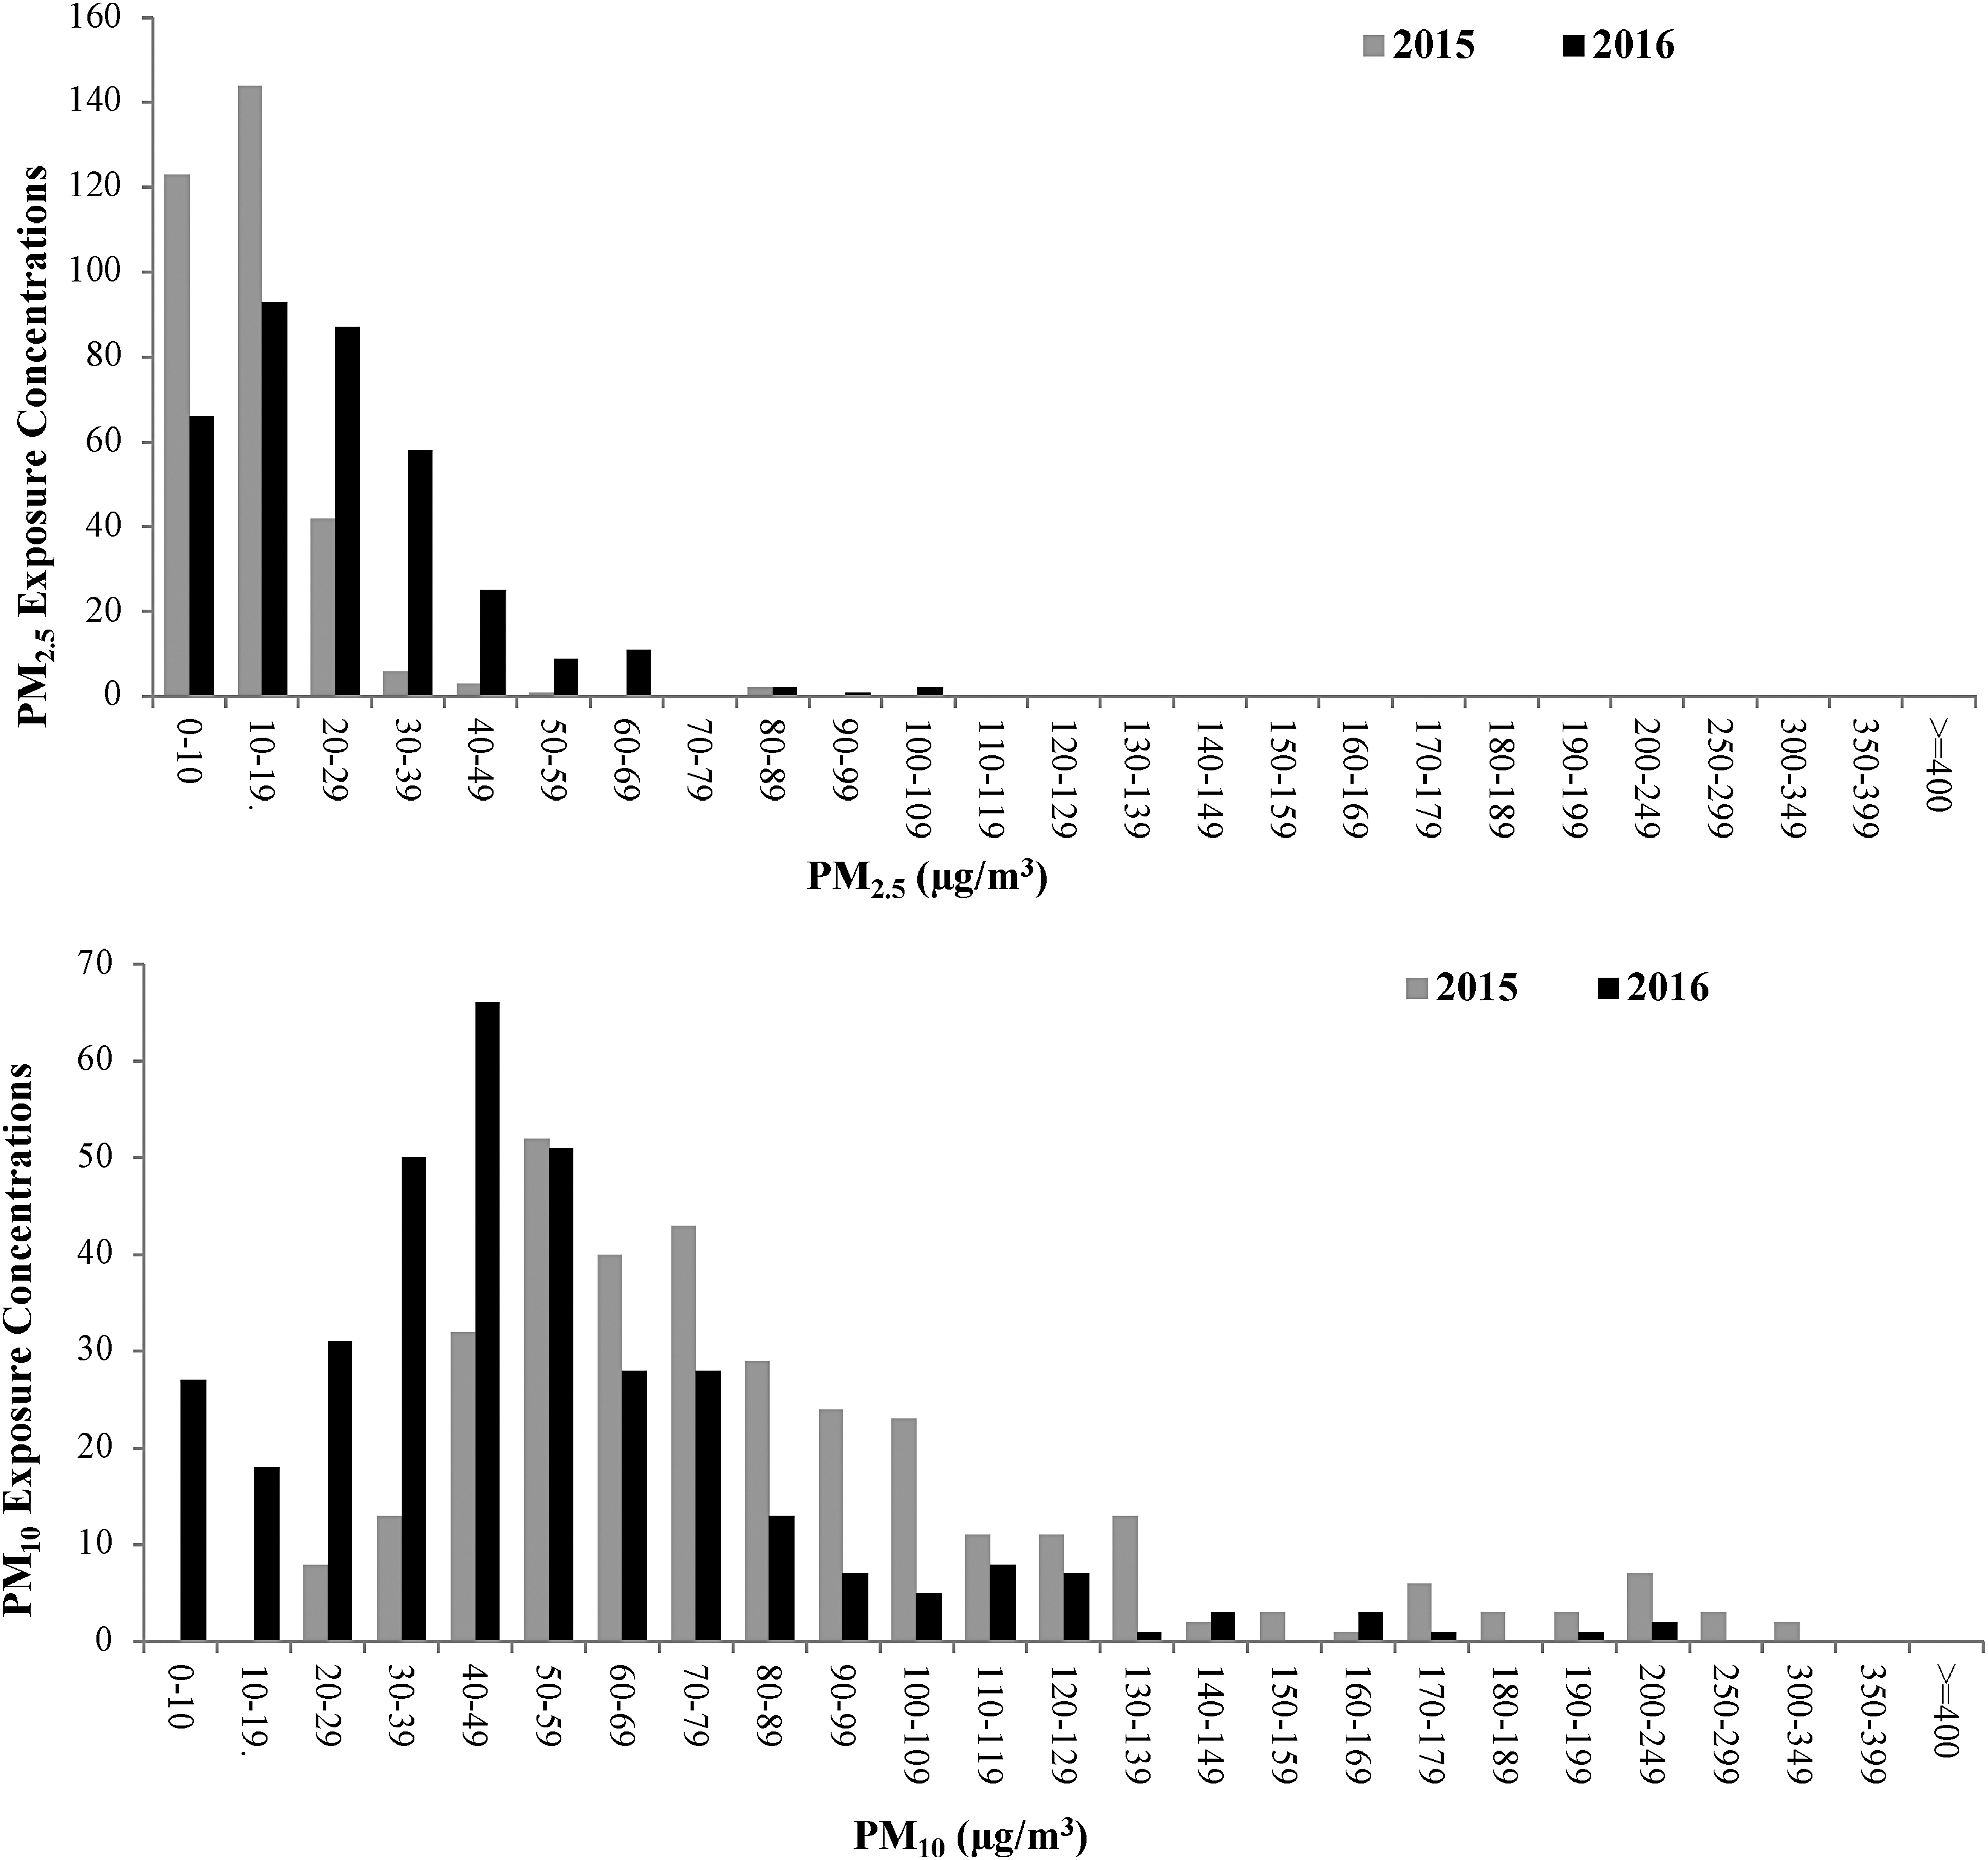
Percentage of people per day exposed to different concentration levels of PM2.5 and PM10 for the 2-year period (2015 and 2016).
Health effects of PM2.5 and PM10 exposures
The estimated AP of bronchitis and morbidities associated with exposure to ambient PM2.5 and PM10, including the number of excess cases and attributable cases per 100,000 people of the respective health endpoints are shown in Table 3. The estimated attributable ICB due to the exposure of PM10 among adult population in the city were found to be 56.9% (95% confidence interval [CI]: 25.8% to 73.2%) and 37.6% (95% CI: 15.4% to 52.2%) for 2015 and 2016, respectively. Similarly, the aforementioned trend was found similar to the PB among children population, where the risk of PB was estimated to be higher in 2015 with an AP of 44.3% (95% CI: −16.6% to 73.4%) compared with the risks experienced for 2016 (28.0% [95% CI: −9.0% to 52.2%]).
Health Impacts Estimates of Attributable Proportion, Excess Number of Cases, and Attributable Cases Per 100,000 of Exposed People in Arak City Attributed to Exposure to Ambient PM2.5 and PM10 >10 μg/m 3 from 2015 to 2016 at 95% Confidence Interval
PM10 exposure.
PM2.5 exposure.
AP, attributable proportion.
Also, our results showed that the AP for RADs among the Arak residents due to exposure to ambient PM2.5 concentrations increased from 2.5% in 2015 to 7.0% in 2016. Similar morbidity effects occurred when the AP for WDL rose from 2.4% to 6.8% in 2015 and 2016, respectively. The number of ICB and PB were both estimated to be 10 cases (at central confidence interval of 50% CI) for 2015, which then dropped to 6 cases in 2016 for both health endpoints. There was sharp increase in the number of RADs cases of 279 to 788 individuals for 2015 and 2016, respectively. Similarly, the estimated number of morbidity cases for WDL increased from 78 to 214 cases for 2015 and 2016, respectively.
Figure 4 depicts the risks of health endpoint cases due to exposure to ambient PM2.5 only since the AirQ+ exposure-response model was based on short-term estimates for RADs and WDL morbidity effects. The excess cases in these figure were estimated based on three CI levels expressed as 50%, 5%, and 95% CI, respectively, for different exposure concentration categories of the ambient PM2.5 in Arak city. In this study, no health impacts were recorded for PM2.5 exposure concentrations <10 μg/m 3 , which is the baseline concentration where no effect can be experienced.
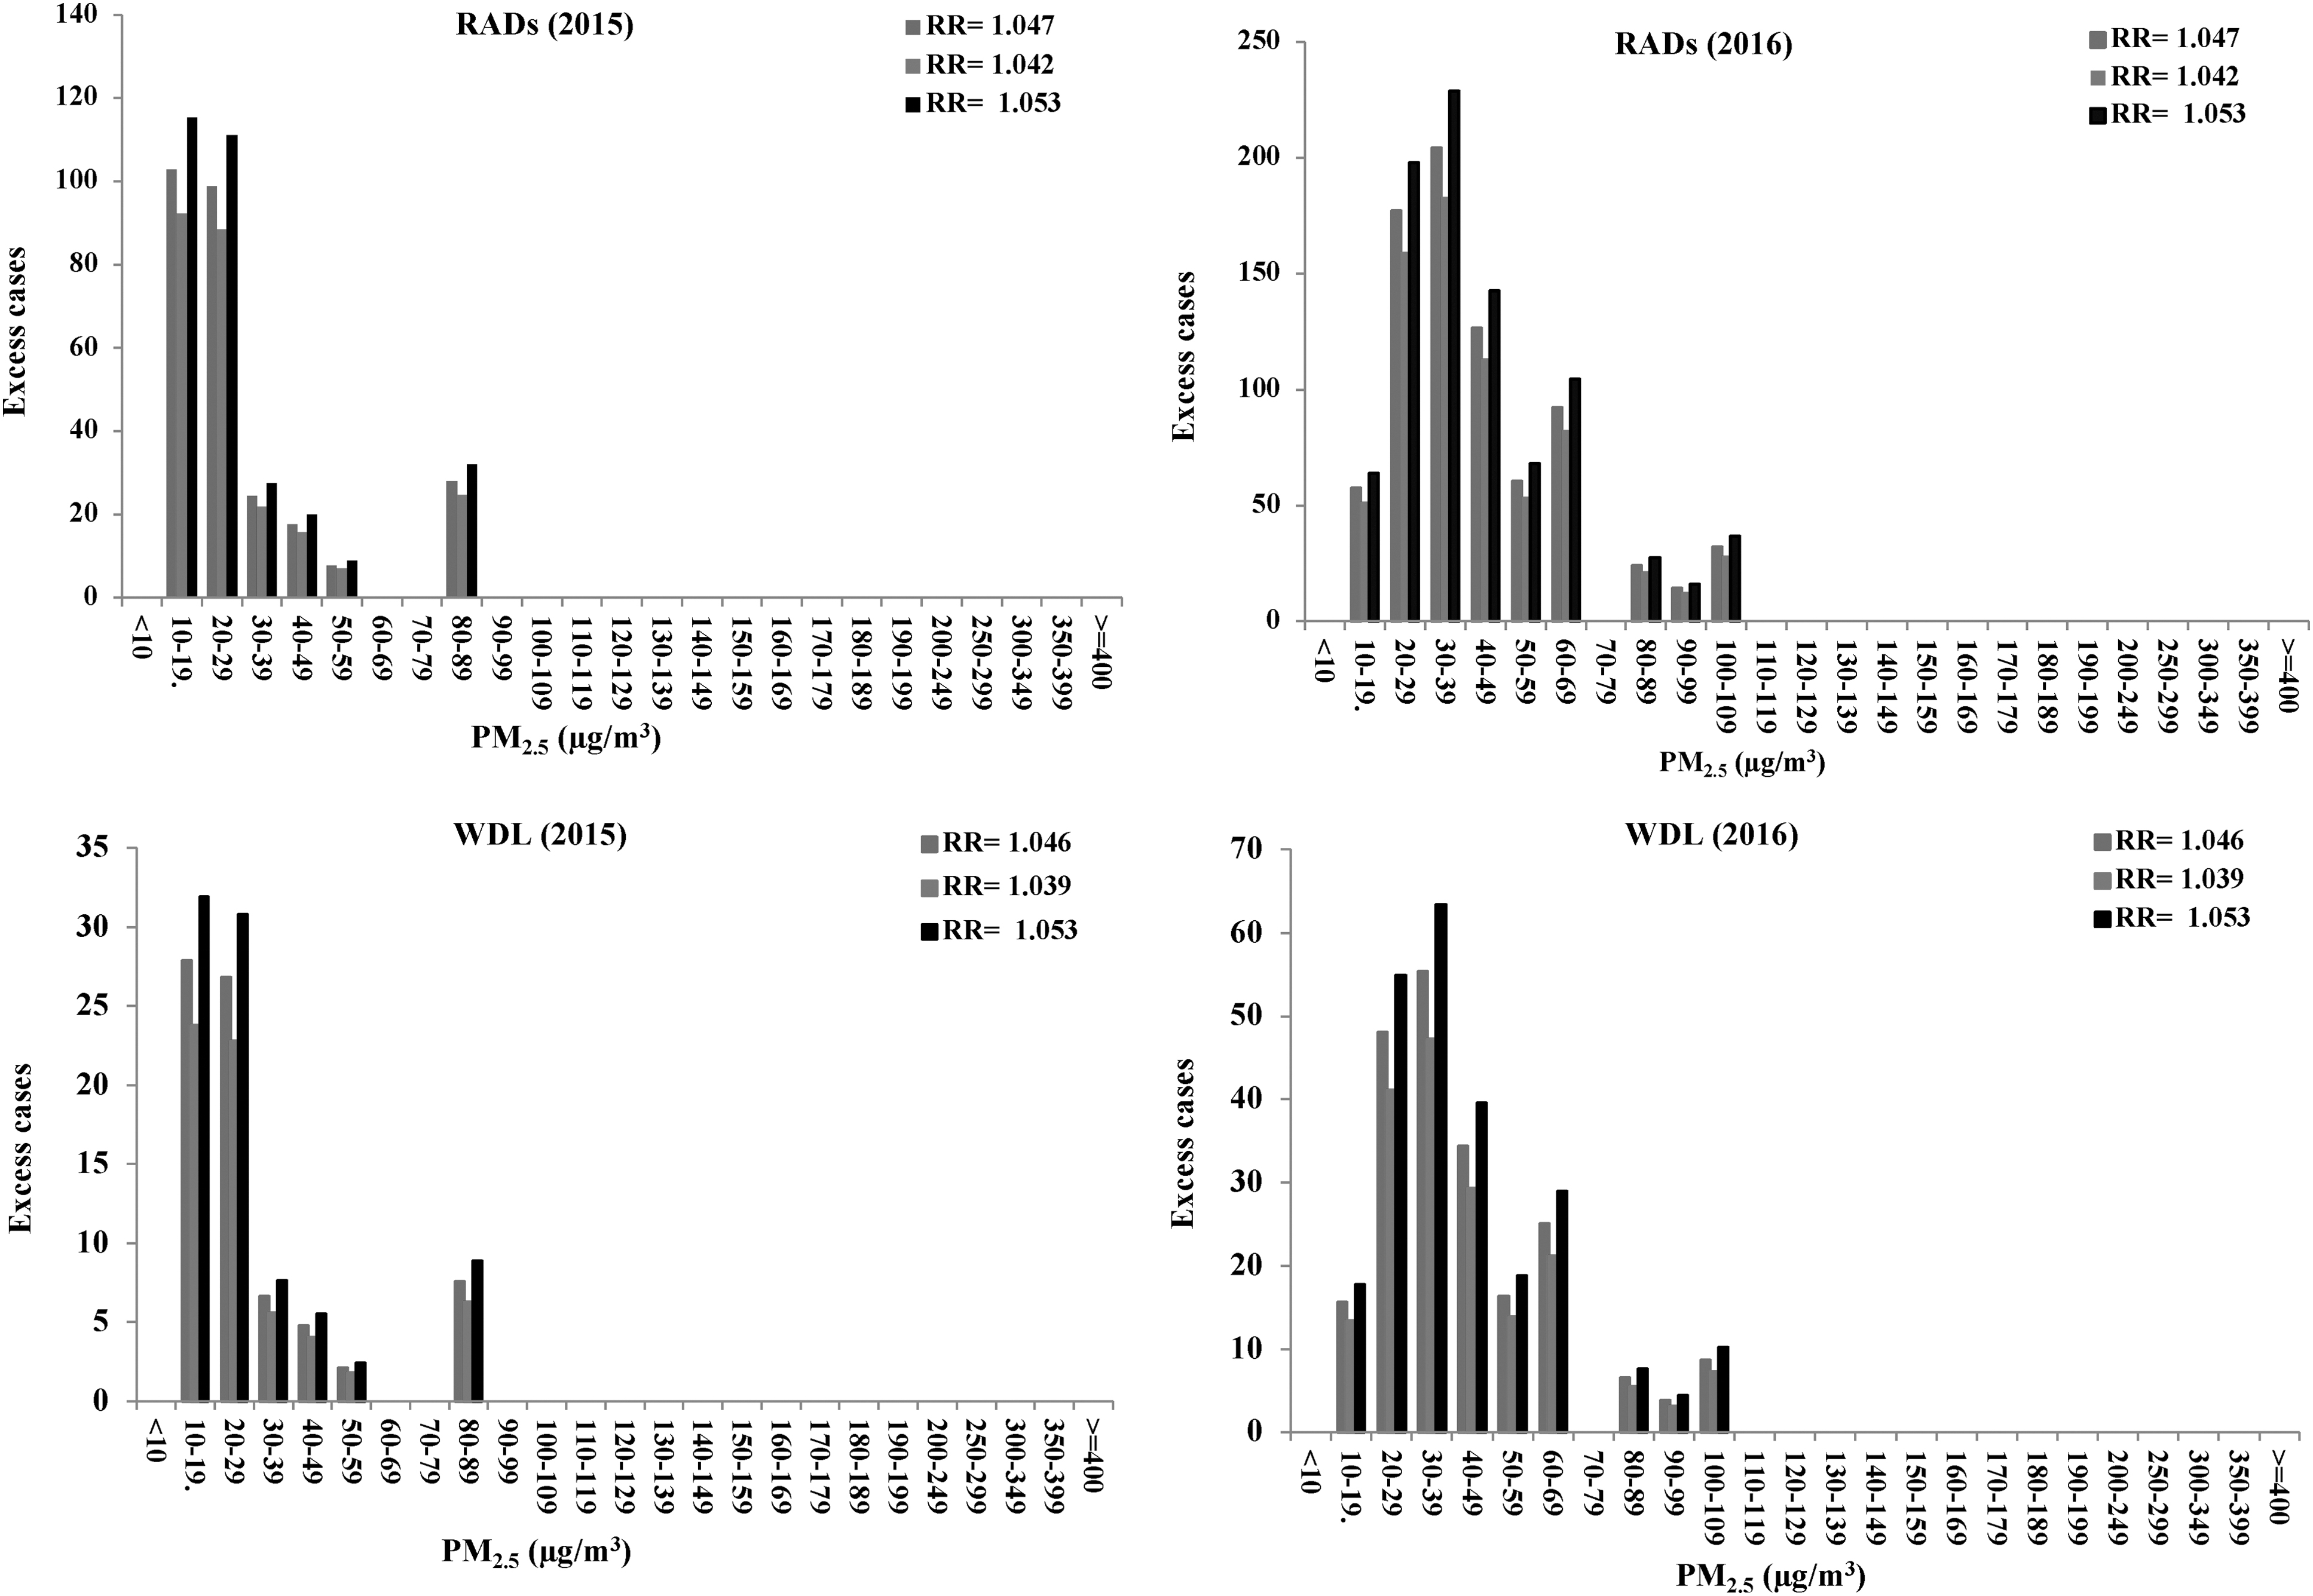
Relationships between RADs, WDL, and exposed PM2.5 concentration intervals for 2015 and 2016. RADs, restricted activity days; WDL, work days lost.
DISCUSSION
The study has found that in Arak city, the annual PM2.5 and PM10 mean concentrations far exceeded the WHO threshold limits of 10 and 20 μg/m 3 , respectively. 40 On average, these annual mean concentrations were lower compared with PM2.5 (41.0 μg/m 3 ) and PM10 (68.0 μg/m 3 ) concentration levels in Hamadan (Iran), including PM2.5 summer (47.9 μg/m 3 ) and winter (41.4 μg/m 3 ) exposure levels but were found to be >80.6 for and 64.7 μg/m 3 concentrations for summer and winter, respectively, for PM10. 41 In Kermanshah, high level of annual PM10 (85.4 μg/m 3 ) was estimated, including winter (68.4 μg/m 3 ) and summer (102.0 μg/m 3 ) seasons, which far exceeded the 2016 emissions levels of this study. 42 Although Arak is located close to central cities of Iran, but higher PM10 and PM2.5 concentrations in this city can be related to increase of industrial activities, heavy traffic, and dust storms from the neighbor countries such as Iraq and Saudi Arabia during atmospheric turbulence and resuspension of dust from the blowing sand particles of the Middle East deserts (Khaniabadi et al., 2017a).
The long-term (2006–2015) average PM2.5 concentration in Iranian capital city of Tehran was found lower than this study but failed to meet WHO and Iranian ambient standards of 10.0 and 12.0 μg/m 3 , respectively. 43
A Community Multiscale Air Quality downscaled model was applied to estimates daily PM2.5 exposure concentrations in 708 urban counties of United States. The model results showed that >90% of resident population living in urban areas of the counties were exposed to PM2.5 concentrations of 12.6 μg/m 3 . 44 These levels were far lower compared with the 10–19 μg/m 3 for 2015 emissions levels in Arak; however, only a small proportion (11.0%) of the Arak residents experienced higher daily exposure levels of 60–69 μg/m 3 . In Agglomeration Lausanne-Morges, Switzerland, lower annual PM10 levels measured from three monitoring stations were found be 24.7 and 29.7 μg/m 3 for 2005 and 2015 emissions, respectively. 45 The lower ambient PM concentrations of the aforementioned developed countries may be due to stringent air quality regulations posed to industrial and road transportation sectors.
The recently developed WHO's concentration-response model, AirQ+ have been widely in used in estimating human health impacts attributed to air pollution exposure in many cities. 46 , 47 , 48 , 49 In this study, the ICB among adults, PB in children, and RADs and WDL attributed to PM10 and PM2.5, respectively, were estimated. Our estimates based on PM10 exposure indicates that 10 and 6 case of both ICB and PB, respectively, could be avoided in 2015 and 2016 exposure concentrations if PM10 levels were reduced to 10 μg/m 3 . A more recent study in Agglomeration Lausanne-Morges, Switzerland, reported 27 and 149, cases of ICB and PB, respectively, for an exposed resident population of about ∼254,000–293,000 could be prevented if PM10 levels were to be reduced to 3.3 μg/m 3 . 50 Most studies have broadly evaluated health impacts of air pollution on COPD in most cities in other countries, including Iran. 51 , 52 , 53 , 54 , 55 However, this study was able to specifically quantified the health effects of bronchitis (ICB and PB), which forms part of COPD diseases in Arak, and these will provide better understanding about the impact of air pollution on bronchitis in Iran where information on these health endpoints are limited. In California, it was estimated that 18.5% of bronchitis symptom cases could occur among 4602 children if ambient PM10 concentrations exceeded 5.6 μg/m 3 . 56 A significant association from PM10 exposure and the risk (odds ratio 1.3 [1.0–1.6]) of chronic phlegm symptoms among children were found in European Study of Cohorts for Air Pollution Effects projects. 57
Very few studies have assessed the morbidities attributed to RADs and WDL in Iran and the world at large. Our estimates revealed that 279 and 76 cases of RAD and WDL, respectively, could be prevented if ambient standards of PM2.5 concentration levels of Arak in 2015 were to be met at 10 μg/m 3 . These number of cases for these morbidities were very high in 2016 PM2.5 emission levels compared with 2015 where there were possibilities (i.e., through air quality management programs and policies) of preventing 788 and 214 cases for RADs and WDL, respectively. Castro et al., 58 respectively, found 46,903 and 10,986 cases for RADs and WDL in Switzerland, which led to the total economic loss of ∼7 million CHF consisting of medical, immaterial, and reoccupation cost, including net loss in production. The BI rate data employed by WHO regional office for Europe 59 in estimating the RADs and WLD for North American and European countries were adapted from an old concentration-response model developed by Ostro. 60 Similarly, Wilton 61 estimated that 82,000 cases of RADs could be prevented in Christchurch, New Zealand, if threshold reduction of 30 μg/m 3 of PM10 concentrations could be prevented. To improve future estimates, more recent study needs to be conducted to developed new concentration-response models in both developing and developed counties to provide more reliable data to help mitigate the economic loss and health effects attributed to RADs and WDL.
The study used the benefits of AirQ+ model developed for populations in European countries, which are relatively different to Middle Eastern countries with totally different weather patterns. Applying this model in the case of Middle Eastern countries has some limitations. The limitation by using AirQ+ in Middle East, including Iran, is that RR values used in the model were developed with baseline health data from different European countries. In addition, the confounders such as smoking habits, body mass index, income levels, and age were assumed not significantly different compared with Middle Eastern environment. However, temperature and humidity levels confounders may vary across these two regions/continents. This discrepancy may affect the accuracy of the estimated health outcomes under this study; because of this the estimated CI cases will be focused only on averages rather than lower and upper limits.
In this study, PM2.5 and PM10 concentrations were averaged over the study area from three monitoring stations, thus we assumed that all citizens shared the same levels of PM exposure. In addition, the exposure assessment is biased due to the limited number of monitoring stations. As the spatiotemporal variability of air pollutants levels and human mobility are ignored, the people exposure estimates are erroneous. For the quantification of individual outdoor exposure, the spatial interpolation techniques are an effective way to estimate surface air pollutants levels over unmonitored areas using data measured at monitoring stations. 62 A large underestimation of estimated effects can be done by using steady-state or single-day models, that is, all effects occur in 1 day. In Ahvaz, significant relationships were reported between an increase in O3 and PM10 levels and cardiovascular deaths between 3 and 13 days' lag. 63 In this study, the potential nonlinear synergic and additive or inhibitor effects of combined PM2.5 and PM10 and confounders were not investigated. To take into account the possible effects of a mixture of common air pollutants (potential additive effects), an Aggregate Risk Index was developed from RR values. 64 , 65
CONCLUSIONS
Different ambient PMs were characterized and their exposure concentrations were determined by various air quality monitoring stations. The human health effects were estimated with WHO's recommended concentration-response model from 2015 to 2016. The results showed that PM2.5 and PM10 concentration levels were in exceedance with many local and international standards and showed agreement with many studies in Iran and rest of the world. Modeling of the health endpoints under the study using BI rates and WHO's default RR values showed similar health outcomes of 6–10 cases for ICB and PB except for RADs (279–788 cases) and WDL, which showed major impact of 214 cases in 2016 compared with 2015 (76 cases) on the overall morbidity. Although these results were in agreement with many studies. However, our estimates could be improved if city-specific BI and RR were to be employed. Also, validating the model outputs with an observed national health data could have addressed the various uncertainties of our model results. To reduce the rate of acute and chronic health effects, the actions by the government should focus on clean air, health trainings by health systems officials for the public, the control of dust storm sources, reduce the usage of fossil fuels, and extensive health guidelines.
Footnotes
AUTHORS' CONTRIBUTIONS
P.A. was involved with conceptualization, methodology, data analysis, and writing of the first draft of the article. Y.O.K. assisted in conceptualization, methodology, data analysis, provision of resources, review, and editing of the article. P.S. assisted in conceptualization, data analysis, and provision of resources. S.A.S. was involved in conceptualization, methodology, data analysis, review, and editing of the article. A.D.M. assisted in conceptualization, methodology, data analysis, and provision of resources. H.S. was involved in methodology, data analysis, review, and editing of the article.
AUTHOR DISCLOSURE STATEMENT
The authors declare no competing conflicts of interest exist.
FUNDING INFORMATION
No funding was received for this article.