




Abstract
The air quality and environmental equity benefits for the accelerated use of diesel particle filter (DPF) and selective catalytic reduction (SCR) systems on heavy-duty diesel trucks are assessed in Oakland, California. The study focuses on communities adjacent to two major freeways: Brookfield Village and Sobrante Park along I-880, heavily affected by truck traffic; and Sequoyah along I-580, where heavy-duty trucks are prohibited. Brookfield-Sobrante has a higher proportion of nonwhite, low-income residents than Sequoyah (97% vs. 76%). We modeled concentrations of nitrogen oxides (NOx), diesel particulate matter (PM), and black carbon (BC) before widespread use of diesel emission controls (2009), after universal adoption of DPFs to control PM emissions (2018), and after universal adoption of SCR to control NOx emissions (2023). Reductions in near-roadway pollutant concentrations in Brookfield-Sobrante were 59% for NOx and 42%–43% for diesel PM and BC by 2018. In Sequoyah, reductions in NOx concentrations were smaller (52%), and diesel PM and BC concentrations increased by 19% and 13%, respectively. While estimated NOx concentrations remain higher in Brookfield-Sobrante compared with Sequoyah, diesel PM and BC concentrations will be similar in both neighborhoods by 2023. Reductions in diesel emissions also led to improvements in environmental equity when quantified by the difference in mean intakes for Brookfield-Sobrante versus Sequoyah. Maintaining these air quality and equity benefits requires that diesel emission control systems remain in good working order over time.
Introduction
Freight transport is a major source of air pollution along goods movement corridors. Heavy-duty diesel trucks, the dominant mode of freight transport activity, 1 are a major source of nitrogen oxide (NOx) and diesel particulate matter (PM) emissions. 2 , 3 The majority of diesel PM mass emissions is black carbon (BC), a short-lived climate-forcing pollutant. 4 Exposures to NOx and diesel PM have been associated with adverse health effects, such as asthma incidence, impaired vascular function, cancer, and cardiovascular and respiratory mortality. 5 , 6 , 7 , 8 , 9 , 10 The air pollution and health impacts from diesel exhaust can be highly localized. 11 , 12 This is of particular concern for residents living near roadways with high truck traffic, including freeways and arterial roadways that carry the majority of goods movement-related traffic. 12 Moreover, based on location of residence, nonwhite individuals experience higher concentrations of traffic-related air pollution than white individuals. 13 , 14 , 15 For instance, one study found that average outdoor nitrogen dioxide levels are 38% higher for people of color than non-Hispanic whites. 13
Policies to control diesel truck emissions have great potential to reduce near-roadway air pollution, especially along goods movement corridors. National heavy-duty diesel engine emission standards have required that exhaust PM emissions be reduced to 0.01 g/bhp-h beginning with the 2007 model year engines and NOx emissions be reduced to 0.2 g/bhp-h beginning with 2010 engines. 16 , 17 To comply with these more stringent emission standards, exhaust after-treatment control systems have become standard equipment on new diesel engines. Diesel particle filters (DPFs) are installed for PM reduction, and selective catalytic reduction (SCR) systems are included for NOx control. Since heavy-duty vehicles have a long service life, natural fleet turnover results in the slow replacement of older trucks with newer and cleaner models over a timescale of several decades. Thus, significant near-term reductions in pollutant emissions require additional efforts to address emissions from the legacy fleet of older trucks that remain in use. In California, the Drayage Truck and Truck and Bus Regulations were adopted to accelerate the use of newer emission control technologies via retrofit or replacement of older in use diesel engines. 18 , 19 All on-road heavy-duty diesel engines were required to meet the 2007 exhaust PM emission standard by January 1, 2018, typically met using DPFs. 19 By January 1, 2023, all heavy-duty trucks must have 2010 or newer engines that are typically equipped with both DPF and SCR systems. 19
Studies evaluating the effect of accelerated adoption of control technologies on heavy-duty truck emissions in California show that emission reductions outpace what would have been achieved by natural fleet turnover. 20 , 21 , 22 , 23 , 24 , 25 While these studies quantify the emission benefits of diesel engine control strategies, they do not consider impacts on near-roadway exposures to air pollution or environmental equity implications. California regulatory agencies, including the California Air Resources Board (CARB), are required to consider the environmental equity implications of their regulatory implementation and enforcement activities, 26 , 27 , 28 , 29 including assessing the unequal distribution of environmental hazard and health risk burden among racial, ethnic, or socioeconomic groups. 30 , 31 , 32 Prior studies that quantify environmental equity and justice benefits of air pollution control strategies focus on hypothetical scenarios for power plants, 33 urban bus fleets, 34 regional emissions, 35 and diesel engines. 36
The current study builds on this emerging literature by considering the equity implications of newly implemented heavy-duty diesel truck emission control strategies and evaluating the air quality effects of the accelerated adoption of emission control systems on heavy-duty trucks in the San Francisco Bay Area. Our specific objectives are to (1) estimate the impact of the accelerated deployment of DPF and SCR systems on NOx, diesel PM, and BC emissions; (2) model the effect of emission changes on near-roadway air pollution in different neighborhoods; and, (3) evaluate the environmental equity implications of estimated emission changes.
Methods
East Oakland freight corridor
This study focuses on the East Oakland freight corridor in the San Francisco Bay Area. Two major interstate freeways traverse the corridor: I-880 and I-580. I-880 supports intraregional freight transport in the East Bay and connects to an interregional network that provides access to the Port of Oakland, the fifth largest container port in the United States, Oakland International Airport, and the rest of California and the nation. I-880 carries the highest volume of trucks in the region. 37
Conversely, trucks are prohibited along a segment of I-580 in East Oakland (Fig. 1). This prohibition began in 1951 along MacArthur Boulevard, before the construction of I-580, due to resident opposition to truck traffic. 38 In 1963, as I-580 was being constructed in the same area, an ordinance was passed by the City of Oakland prohibiting trucks with gross vehicle weight exceeding 4.5 tons from using the new freeway. That same year, the California Department of Transportation and the Federal Highway Administration approved continuation of the truck ban. In 1989, part of I-880 was closed after sustaining damage by the Loma Prieta earthquake. In response to the increased traffic congestion, the California Trucking Association advocated for the study and review of the truck prohibition on I-580, but ultimately no study was conducted due to continued opposition from local residents and elected officials. In 2000, the California Legislature codified the I-580 truck ban in the California Vehicle Code. 38 As a consequence, all heavy-duty truck traffic in Oakland, including port- and airport-related cargo movement, continues to travel exclusively on the I-880 corridor.
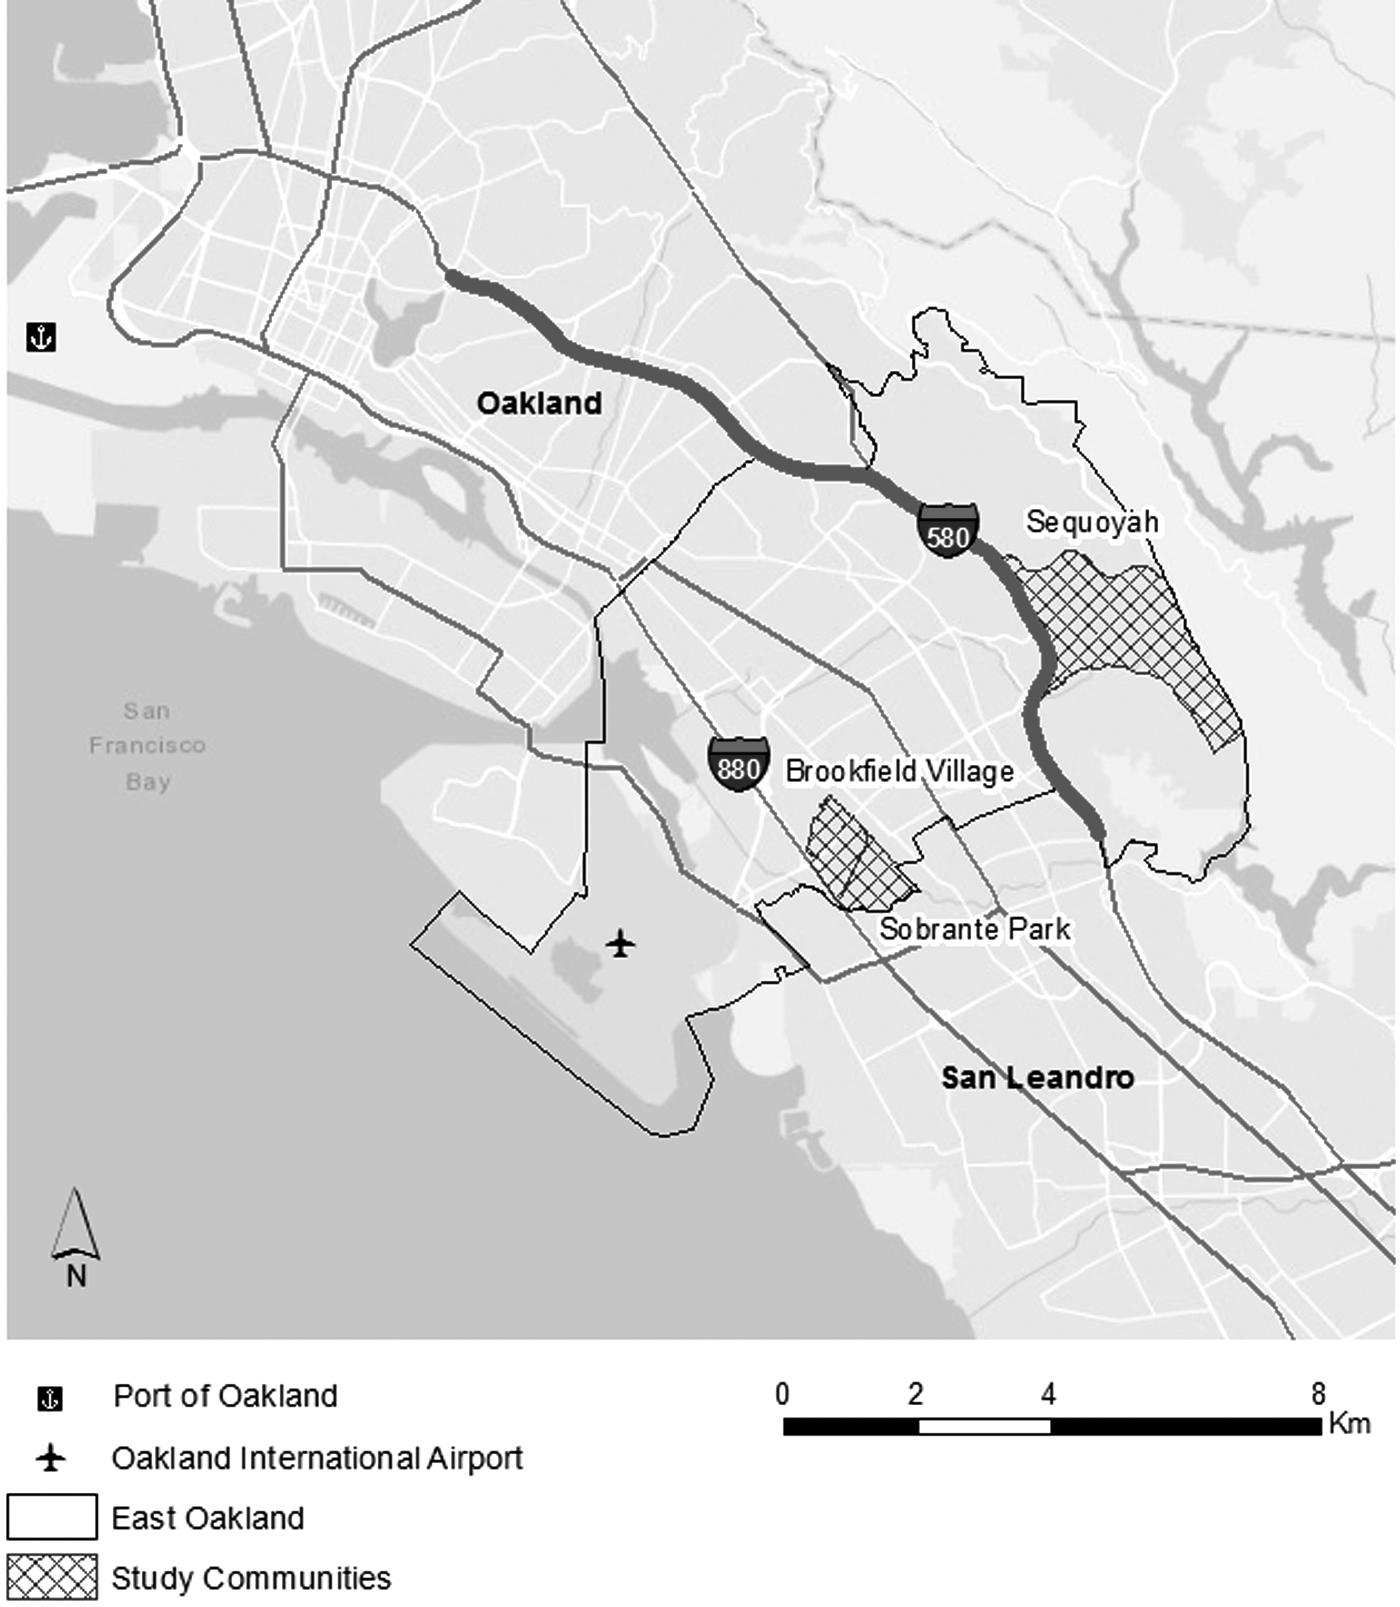
Map of Oakland, including study communities located beside major freeways. The thick line represents the segment of I-580 along which heavy-duty trucks are prohibited.
Study sites
This analysis assesses the air quality impacts and environmental equity implications of emission control regulations accelerating the deployment of DPF and SCR systems between 2009 and 2023, in two East Oakland communities that are adjacent to the I-880 and I-580 corridors: Brookfield Village and Sobrante Park along I-880 (hereafter referred to as “Brookfield-Sobrante”) and Sequoyah along I-580 (Fig. 1). Brookfield-Sobrante has been identified by government agencies as a community with high cumulative exposure burden and vulnerable populations. 39 , 40 , 41 Brookfield-Sobrante ranks among the top 5% of the most impacted census tracts in CalEnviroScreen, a mapping tool that evaluates 20 indicators of pollution burden and population vulnerability. 39 Brookfield-Sobrante has the most burdened census tracts in the San Francisco Bay Area. 39 For diesel PM, these census tracks rank in the 87th–92nd percentiles. 41 This is due to high truck traffic volumes on I-880 and arterials used to access the industrial and commercial zoned areas adjacent to Brookfield-Sobrante. The community has been concerned about air pollution exposures. 42 Community concern regarding diesel exhaust and associated health effects prompted an ongoing monitoring study at Brookfield Elementary School, located directly adjacent to I-880. 43 In contrast, the Sequoyah census tract, which is adjacent to green space, ranks much lower, in the 31st percentile, for the diesel PM indicator. Demographic and socioeconomic data for each community are presented in Table 1. 44 , 45 Brookfield-Sobrante, which experiences much greater impacts from goods movement activities, has a higher proportion of nonwhite and low-income residents than Sequoyah. This is consistent with environmental justice literature that indicates more generally that nonwhite and low-income communities tend to be more concentrated in freight-impacted neighborhoods. 46 , 47
Demographic Variables in Each Receptor Community and in Oakland as a Whole
2010 Census, 2006–2010 ACS 5-Year Estimates. Due to the small geographic area, ACS estimates may have large margins of error.
In 2010 inflation-adjusted dollars.
Percent of households with income less than twice the poverty level.
Non-Hispanic.
ACS, American Community Survey.
Our two study neighborhoods, Brookfield-Sobrante and Sequoyah, are two distinct geographies that are the legacy of historical racialized processes. Redlining, restrictive covenants, and zoning practices were used to exclude nonwhite residents from East Oakland. 48 , 49 Black residents were restricted to North and West Oakland, and a small, redlined area in the East Oakland flatlands that includes Brookfield-Sobrante. As Oakland deindustrialized after World War II, white flight from the East Oakland flatlands enabled people of color to move in. 49 Freeway construction was used as a tool to reinforce racial and economic divisions. I-580 divided the flatlands from the hills, and I-880 separated flatland residential areas from most industry. As a result of differential access to political power, trucks were prohibited on I-580 in the Oakland hills, and all truck traffic must travel along I-880 in the flatlands. 49 This pattern of not in-my-backyard campaigns driving pollution sources to be sited in economically and politically vulnerable communities of color is well documented. 50
Emissions
A bottom-up approach was used to estimate link-based emissions for the modeled roadway network. Network data, obtained from the California Department of Transportation, 51 include individual “link” (roadway segment) locations as well as link classifications. The modeled roadway segments extend ∼4 km along each of the two freeways.
Requirements for accelerated adoption of emission control systems on heavy-duty diesel trucks began to take effect in January 2010, with use of DPFs fully phased in by the end of 2017 and use of SCR to be fully phased in by the end of 2022. The years 2009, 2018, and 2023 were therefore selected to provide baseline, post-DPF policy, and post-SCR policy points of comparison, respectively. We used traffic count data from the California Department of Transportation, 51 including link-specific counts for total annual average daily traffic (AADT), proportions of trucks, and truck counts broken down by number of axles. We estimated AADT for years 2018 and 2023 by extrapolating the most recently available traffic count data for years 2014 to 2016 (Table 2). During the earlier period (2009–2013), traffic volumes declined due to the economic recession.
Changes in Traffic Volumes (Annual Average Daily Traffic) Over Time
Heavy-duty diesel truck counts are calculated to nearest whole number.
Percent changes are relative to baseline year (2009).
AADT, annual average daily traffic; DPF, diesel particle filter; SCR, selective catalytic reduction.
AADT values were allocated to Emission Factors Model (EMFAC) 52 light-duty and heavy-duty vehicle types. We first estimated total light-duty vehicles by subtracting trucks from the total vehicle count. Light-duty vehicles were disaggregated into passenger cars and light-duty trucks based on EMFAC estimates of vehicle miles traveled at the county-level. 52 The heavy-duty truck counts are grouped by axle category: two-axle/six-tire trucks and trucks with three or more axles. Two-axle/six-tire trucks include both gasoline and diesel-powered trucks that were apportioned based on fuel-specific fractions as described elsewhere. 53 Trucks with three or more axles were all assumed to be diesel-fueled. 53 For our analysis, we refer to trucks with three or more axles as “heavy-duty diesel trucks.”
Traffic volumes were adjusted to hourly estimates using month-of-year, day-of-week, and hour-of-day temporal allocation factors from McDonald et al. 53 Estimates of link-specific emission rates were calculated from hourly traffic volumes and emission factors. NOx and PM2.5 emission factors for each vehicle type were estimated using EMFAC model estimates at the county-level. BC emission factors were estimated using the EMFAC-derived exhaust PM2.5 emission factors, combined with BC fractions for PM2.5 emissions. The BC fractions used here were 18% and 61% for gasoline and diesel engine exhaust emissions, respectively. 54 , 55
Exposure modeling
We predicted near-roadway pollutant concentrations using the RLINE line-source dispersion model. 56 , 57 We previously evaluated RLINE model performance in predicting NOx and BC concentrations at near-roadway monitoring sites in the San Francisco Bay Area and found good agreement between model predictions and observations for daily-average concentrations, with more than 90% of predictions within a factor of two of measured data. 58 For the present study, model receptors were set at all census-block centroids located within 200 m of each freeway. Levels of traffic-related air pollution and their associated health impacts are reported to be elevated at distances up to about 200 m downwind of major roadways.11, 59 The meteorological inputs required for RLINE dispersion calculations were developed using the meteorological preprocessor, AERMET. 60 Meteorological data were obtained from the National Weather Service for Oakland International Airport for the baseline year 2009. We held meteorological conditions constant (i.e., same as 2009) when modeling the 2018 and 2023 emission scenarios so that meteorology could not influence predicted changes in air quality. The model was applied using unit emissions and the roadside barrier beta-option at varying release heights for light-duty vehicles (0.3 m) and heavy-duty trucks (4 m). 61 Dispersion model estimates were then combined with hourly emissions estimates to compute NOx, diesel PM, and BC concentrations.
Near-road pollutant concentrations were calculated as the sum of the modeled freeway and urban background concentrations. Observations from the Bay Area Air Quality Management District's East Oakland ambient monitoring site were used to estimate background NOx, diesel PM, and BC levels. This monitoring site provides hourly measurements of NOx and PM2.5 concentrations. Seasonal ratios from Fujita et al. 62 were used to estimate background diesel PM and BC concentrations as fractions of measured PM2.5. Hourly PM2.5 monitoring at the East Oakland site began in October 2009, so we estimated 2009 background concentrations using 2010 NOx and PM2.5 measurements. Background concentrations for the years 2018 and 2023 were estimated using 2017 measurements. To reduce the influence of local NOx emission sources at the background site 63 and characterize the urban background contribution accurately, we used the 25th percentile of the observations from the East Oakland monitor to characterize urban background levels, as recommended by Van Poppel et al. 64 Measured BC concentrations were considered representative of urban background concentrations and were used without adjustment. Background concentrations were added to near-roadway estimates of traffic-related air pollution for each location in the study domain. Daily average concentrations were computed at each receptor from predicted hourly values.
Intake
Intake is the mass of pollutant inhaled by an exposed individual or population and is a measure of exposure that provides a proxy for the health burden. The intakes, I (μg/day), of NOx, diesel PM, and BC were estimated for each census-block as follows:

where
Environmental equity metric
We used an environmental equity metric to compare exposure estimates in the two study areas and assess the spatial distribution of the exposure burden. Our metric for environmental equity is the relative percent difference (RPD) between mean intakes for residents of the two different communities we analyzed:
where
We computed this metric for the baseline (2009), post-DPF policy (2018), and post-SCR policy (2023) years, and we examined changes to evaluate the effects of diesel truck emission control regulations on equity in exposures to air pollution.
Results
Heavy-duty diesel truck emissions
Trends in heavy-duty diesel truck NOx, diesel PM, and BC emissions along each freeway are shown in Table 3. As expected, between the baseline year (2009) and the postpolicy years (2018 and 2023), there were large estimated decreases in heavy-duty diesel truck emissions. Relative to 2009, heavy-duty diesel truck volumes on I-880 increased by 7% in 2018 and by 18% in 2023 (Table 2), but emission reductions outpaced the effect of growth in diesel truck traffic. For I-880, NOx emissions decreased by 65% and diesel PM and BC emissions decreased by 83% between 2009 and 2018 as use of DPFs became universal. Particle filters have been shown to have little impact on total NOx emissions. 66 , 67 The decrease in NOx emissions is due to the replacement of older trucks with newer engines that emit NOx at lower levels. Reductions in diesel PM and BC emissions are driven by both filter retrofits on older trucks and replacement with newer engines. Further reductions in heavy-duty diesel truck emissions of all pollutants will occur by 2023, when all trucks are required to be equipped with 2010 or newer engines, typically with both DPF and SCR. Relative to the 2009 baseline, NOx emissions decreased by 82%, and diesel PM and BC emissions decreased by 95% for the 2023 case. Despite large relative decreases, heavy-duty diesel truck emissions remain much higher on I-880 than on I-580. Trucks account for 8.6% of total traffic along I-880, with 61% of trucks classified in the heavy-duty diesel truck category. In contrast, <1% of vehicles traveling on I-580 are trucks, of which only 6% are in the heavy-duty diesel truck category. Heavy-duty diesel trucks remain the dominant source of NOx, diesel PM, and BC emissions on I-880.
Average Heavy-Duty Diesel Truck Nitrogen Oxide, Diesel Particulate Matter, and Black Carbon Emissions for Baseline, Postdiesel Particle Filter, and Postselective Catalytic Reduction Scenarios
The modeled freeway segment near each study area is ∼4 km.
BC, black carbon; NOx, nitrogen oxide; PM, particulate matter.
The accuracy of predicted emission trends over time is affected by uncertainties in the underlying emission factors. In Table 4, we compare trends in the EMFAC-derived emission factors for heavy-duty diesel trucks used in this study with observed trends in emission factors from on-road studies. 68 Studies of heavy-duty diesel trucks operating in California reported fuel-based emission rates, and so, we derived fuel-based EMFAC estimates for comparison. As shown in Table 4, EMFAC has a tendency to estimate lower heavy-duty diesel truck emission factors than on-road measurements. However, the emission reductions used in this study are consistent with observed emission reductions measured from on-road engines, which is more relevant to the temporal analysis comparing baseline and postpolicy years.
Evaluation of Heavy-Duty Diesel Truck Emission Factors and Trends Over Time
Percent changes are relative to baseline year.
The baseline year is 2009 for EMFAC-derived emission factors and 2010 for on-road emission factors.
Computed from EMFAC-derived emission factors. Black carbon fraction of total exhaust PM emissions was assumed to be 61% (see text).
On-road measurements of heavy-duty diesel truck emissions at the Caldecott tunnel. 67 The post-SCR case is based on values for SCR-equipped trucks only.
EMFAC, Emission Factors Model.
Near-roadway pollutant concentrations
Figure 2 shows boxplot statistics of daily average NOx, diesel PM, and BC concentrations for the pre- and postpolicy periods. Overall, we found reductions in near-roadway concentrations of all pollutants. Reductions in NOx are seen in both study areas, but reductions are slightly larger in Brookfield-Sobrante, where NOx concentrations were reduced by 59% and 72% in 2018 and 2023 relative to baseline values for 2009. For Sequoyah, NOx concentrations were reduced by 57% and 68% in 2018 and 2023, respectively, relative to 2009. As shown in Figure 2, diesel PM and BC were reduced in Brookfield-Sobrante but increased slightly in Sequoyah. In Brookfield-Sobrante, diesel PM concentrations decreased by 42% and 50% in 2018 and 2023, with nearly identical changes in BC over the same period. Mean diesel PM and BC concentrations in Sequoyah increased by 19% and 13%, respectively, between 2009 and 2018, and these pollutant concentrations are predicted to remain at similar levels between 2018 and 2023. Emission reductions in Brookfield-Sobrante are driven by diesel truck emission controls. We observed a larger reduction there than in Sequoyah, which has a higher proportion of light-duty vehicle traffic in the mix. These results provide quantitative support for the expectation that heavily freight-impacted communities will experience larger relative air quality benefits from the accelerated adoption of DPF and SCR systems on diesel trucks. This is especially true for diesel PM and BC. However, absolute levels remain higher in Brookfield-Sobrante.
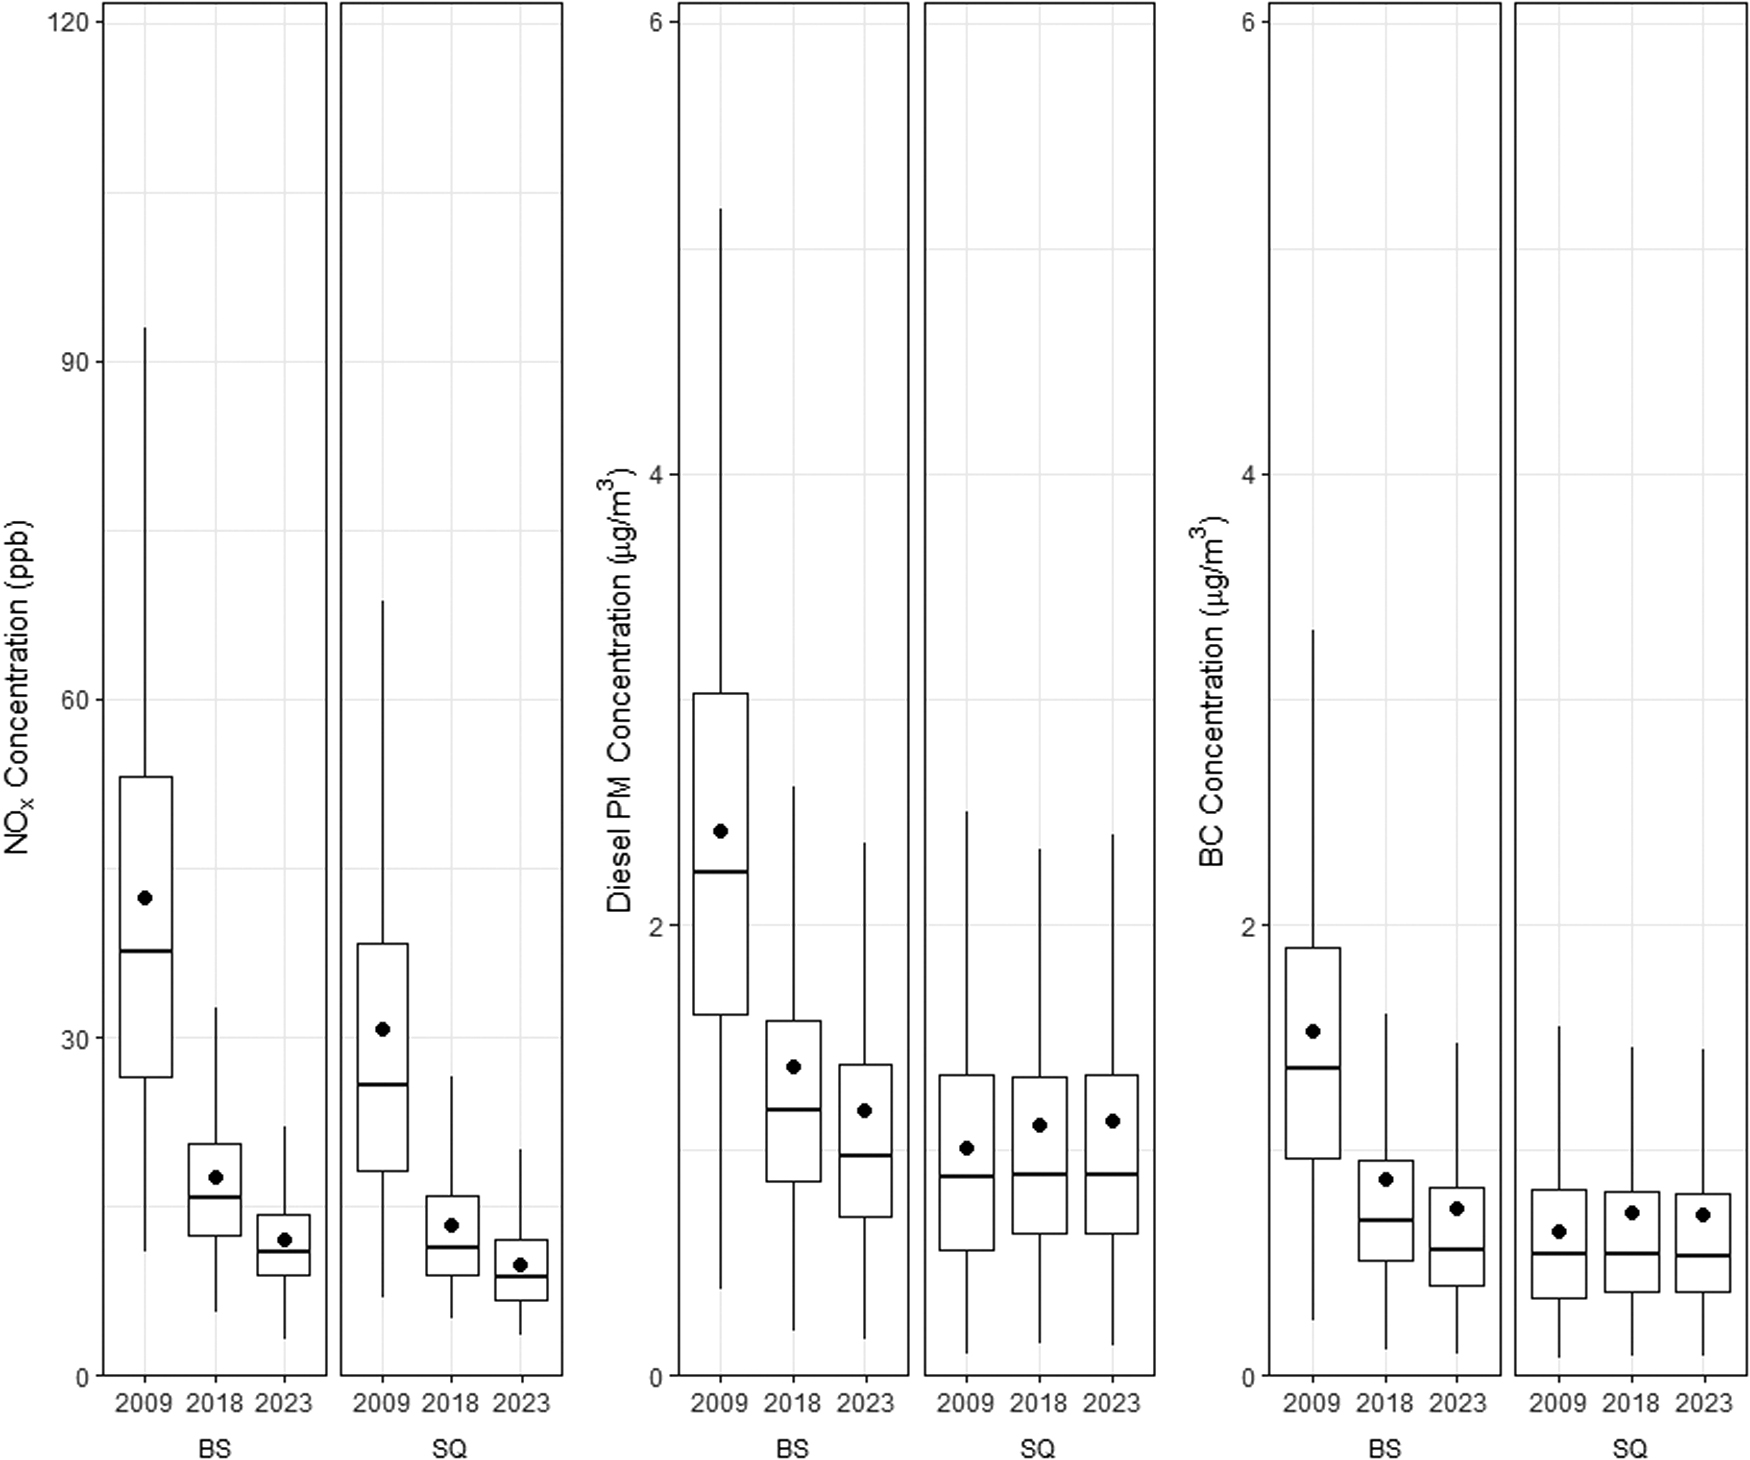
Boxplots of predicted NOx, diesel PM, and BC concentrations at census-block centroids for the baseline (2009—leftmost box in each panel) and postpolicy (right two boxes in each panel: 2018—post-DPF and 2023—post-SCR) periods. The edges of the box represent the interquartile range (25th to 75th percentile); the horizontal line represents the median; and the dot represents the annual average. BC, black carbon; BS, Brookfield-Sobrante with trucks on nearby I-880; DPF, diesel particle filter; NOx, nitrogen oxide; PM, particulate matter; SCR, selective catalytic reduction; SQ, Sequoyah without trucks on nearby I-580.
Our analysis shows that by 2023, mean NOx levels will remain slightly higher, but diesel PM and BC concentrations along I-880, where heavy-duty trucks are allowed, are expected to be similar to those along I-580, where heavy-duty trucks are prohibited. This highlights the benefits of modernizing the truck fleet to reduce near-roadway exposures to diesel PM in highly impacted areas. In the baseline year, the relative difference in concentrations was larger for diesel PM and BC than for NOx. After DPF implementation in 2018 and SCR implementation in 2023, NOx exhibits the largest relative difference between neighborhoods. An important implication of this analysis is that near-roadway measurements of NOx alone do not fully represent the diesel source, which is critical when assessing environmental burdens of air pollution on people living close to major goods movement corridors. Results highlight the utility of assessing a multipollutant suite that more completely characterizes the air pollution burden due to on-road truck emissions. Due to its usefulness as a marker for diesel exhaust emissions, 5 we recommend that BC be measured at more near-roadway monitoring sites nationwide, as is already being done in the San Francisco Bay Area.
Changes in environmental equity metric
Changes in the environmental equity metric resulting from the accelerated adoption of emission controls are presented in Table 5. Emission reductions result in decreased exposure disparities for all pollutants over time, as measured by the RPD in exposures for each year. The diesel cleanup efforts have led to a more equitable distribution of air pollution between Brookfield-Sobrante and Sequoyah. This indicates that the disproportionate air pollution burden on residents living along I-880 with high volumes of heavy-duty truck traffic is reduced. Future work should investigate changes in associated health outcomes, such as premature mortality or asthma hospitalization, in the East Oakland freight corridor for each emission control regulation. Sequoyah and other neighborhoods along the segments of I-580 where heavy-duty trucks are prohibited could also provide a useful control case for epidemiological studies, given that exposures to diesel exhaust along I-580 are low and not changing much over time.
Environmental Equity Indicator for Daily-Average Nitrogen Oxide, Diesel Particulate Matter, and Black Carbon Concentrations
The last two columns show absolute changes in the environmental equity metric relative to the baseline year (2009), with positive values indicating that the policy improved equity. For example, DPF implementation improved the equity metric by 58% for diesel PM (from 77% to 19%).
RPD, relative percent difference.
Postpolicy conditions suggest that while the widespread use of DPFs by 2018 improves outcomes, the accelerated adoption of 2010 and newer engines by 2023 is needed to further advance equity benefits of diesel pollution mitigation (Table 5). For diesel PM and BC, the intake differentials between Brookfield-Sobrante and Sequoyah are ∼20% in 2018. The intake differentials decrease to 6% for diesel PM and 4% for BC when all trucks have 2010 and newer engines. Additional controls of diesel emissions may be necessary to further improve equity in air pollution exposures, particularly for diesel NOx. In California, incentive programs are accelerating the introduction of near-zero and zero-emission technologies for freight trucks (e.g., hybrid electric engines, electric engines, and fuel cells). 69 , 70 These additional in-use emission control regulations and incentive programs can help further reduce diesel-related air pollution within urban freight corridors. Future work should consider whether implemented diesel emission controls will continue to mitigate diesel-related air pollution, given the expected continued growth in heavy-duty truck freight transport. 71 , 72
The analysis presented here presumes that DPF and SCR systems will remain in good working order over the study period. Prior studies indicate that some DPF-equipped trucks emit PM and BC at high levels.21,23,24,25 These high emissions result from deterioration or failure of control systems over time. The environmental equity benefits reported here represent a best-case scenario. The durability and maintenance of emission control systems will affect whether the benefits presented here are fully realized and endure over time. For communities in urban freight corridors to continue to benefit from diesel emission control efforts in future years, programs are needed to identify and repair high-emitting trucks. CARB currently performs smoke opacity inspections on a very limited subset of in-use heavy-duty trucks. 73 The California legislature recently passed a legislation that will institute a regular inspection and maintenance program for all operating heavy-duty trucks. 74 In addition, adequate funding mechanisms are needed to ensure proper maintenance of emission control equipment installed on trucks. After the Motor Carrier Act of 1980 deregulated the trucking industry, short-haul drivers shifted from company employees to independent owner operators, who bear the costs associated with owning a truck while earning low wages, 75 , 76 which sometimes makes routine maintenance unaffordable. As heavy-duty engines age, deterioration or failure of filters is likely to lead to increased emissions. Thus, sustaining the equity benefits of diesel truck emission control efforts relies on the ongoing proper functioning of emission control systems and/or replacement of diesel engines with alternatives.
Limitations
Simplifications to the exposure analysis in this study include not accounting for time-activity patterns, occupational and in-transit exposures, indoor–outdoor pollution relationships, and breathing-rate variability, which will affect individual daily intake rates, 77 and therefore, the estimated environmental equity benefits. Some of these factors are correlated with income, such as residential air conditioning and building and vehicle air exchange rates. For instance, older, leakier housing is more likely to be located in low-income communities. Taking these factors into account in future work would help to better characterize the magnitude and distribution of benefits caused by the accelerated use of diesel truck emission control technologies. Another limitation of our analysis is that it was restricted to diesel trucks. There are additional off-road diesel emission sources in urban freight corridors, such as ships, rail, airport services, and construction equipment. Further research is needed to assess how these additional sources and their associated control efforts affect inequities in exposure to diesel-related air pollution.
Conclusion
The local air quality and environmental equity impacts of diesel emission control regulations that accelerate deployment of DPF and SCR systems were estimated. Results indicate that the accelerated adoption of emission control systems can lead to larger relative reductions in NOx, diesel PM, and BC concentrations in communities near roadways with high truck traffic and help to reduce inequities in exposures to diesel-related air pollution. This analysis is significant because it illustrates a systematic approach for quantifying equity considerations within air quality analyses of air pollution-related policies. Several California air quality and climate laws explicitly articulate localized environmental equity goals,28,29, 78 and so, this analysis can be used to inform regulations in California and has implications for regulations elsewhere. This is especially relevant for diesel-related policies, given that nonwhite and low-income communities tend to be more concentrated in freight-impacted neighborhoods. 79 , 80 It will also be important to track and verify predicted air quality and environmental equity benefits of diesel emission control regulations. Future research can use new monitoring techniques, such as mobile monitoring with fleet vehicles 81 or deployment of dense, low-cost sensor networks, 82 to produce the fine spatial and temporal scale measurement data needed to validate intraurban model estimates of diesel regulation impacts.
Footnotes
Acknowledgments
We thank Dr. Rachel Morello-Frosch and Dr. Ashok Gadgil for their comments on the earlier versions of this article.
Authors' Contributions
Conceptualization and methodology: R.F.P. and R.A.H.; analysis: R.F.P.; writing—original draft preparation: R.F.P.; writing—review and editing: R.F.P. and R.A.H.
Disclaimer
The views expressed in this article are solely those of the authors and do not necessarily reflect the views of the project sponsors.
Author Disclosure Statement
No competing financial interests exist.
Funding Information
This study was supported by the U.S. Environmental Protection Agency under Assistance Agreement No. FP-91781801-0, and the 2018 Robert and Patricia Switzer Foundation Environmental Fellowship.