
Abstract
In 2008, the Maryland Department of Natural Resources (MDNR) developed the Maryland Park Equity Assessment Tool to visualize the socioenvironmental distribution of parks across the state and assess where resource investments would most enhance residents' access to green space. This tool, the first of its kind in Maryland (MD), represents an important advancement in environmental justice (EJ) decision making. In 2018, MDNR partnered with the authors to update the tool's rudimentary model for identifying communities with low park equity and to improve the tool's overall function and design. The updated tool scores census block groups (CBGs) in MD based on the following nine factors: population density, concentration of households <185% of the federal poverty line, concentration of children under the age of 18 years, concentration of adults 65+, concentration of non-White households, distance to public park space, distance to public transportation, and walkability, and linguistic isolation. This article provides details and rationale regarding the indicators and formula used to assign park equity scores to each CBG. The details of added user-driven functions are also described. Finally, we demonstrate the tool's utility for regional planning and decision support with a case study in a suburban EJ community. The tool can be accessed at
INTRODUCTION
Health benefits of park access
Community availability of, and access to, parks—defined here as public green spaces used for recreation—is directly correlated with increased health and well-being across all demographics. 1 , 2 , 3 According to a national study, ∼30% of physically active adults use parks as a place for regular exercise. 4 Consequently, neighborhoods with increased park space are associated with greater physical activity in children, adolescents, and the elderly as people with parks nearby tend to use them more frequently than those who live further away. 5 , 6 , 7 Exposure to green space for at least 20 minutes per day increases daily exercise in children, and recreational programs within 10 km of children's homes have inverse associations with children's body mass index by age 18 years. 8 , 9 Moreover, parks promote further healthy lifestyle choices, such as using active transport (biking or walking) over passive transport to reach park locations. 10
Mental health has also been shown to be positively impacted by interactions with green space. Studies on toxic environmental exposures and stressors have shown that levels of air pollution are lower within and around areas with ample green space. 11 , 12 , 13 , 14 , 15 , 16 , 17 , 18 This reduction in environmental stressors correlates with a reduction in allostatic load, attention fatigue, and anxiety while promoting relaxation and a sense of tranquility in individuals who spent time in nature. 19 , 20 In elderly populations, the prevalence of dementia and depression was observed to decrease as the availability of parks and green spaces increased. 21 In children, exposure to green spaces can have positive cognitive effects such as improved working memory and reduced inattentiveness. 22 By contrast, children living further than 500 m away from a green space were more likely to have behavioral problems, especially hyperactivity and attention disorders, compared with children living closer to green spaces. 23
Finally, green space plays an important role in social well-being and capital by promoting social contact and community attachment. 24 , 25 An increase in social capital has been shown to decrease the risk of obesity while increasing feelings of belonging, investment in community, and security. 26 , 27 , 28 , 29 , 30 Notably, parks facilitate intersections across physical, mental, and social health. Greater social cohesion can have positive effects on the mental health of elderly populations. 31 Improvements to social capital also increase self-confidence and self-efficacy as studies have shown that residents of neighborhoods with embedded green space (e.g., parks, wooded lots) perceive their own personal health and well-being more positively than residents of neighborhoods without green space. 32
Park equity as an environmental justice issue
It is important to note that green space access in the United States is racially and socially disparate. Historically, communities of color have had access to fewer—and lower quality, less maintained—green spaces than White communities. 33 There are more disparities in access to urban vegetation than parks, although inequities exist in all types of habitats, according to a study including data from 10 U.S. cities. 34 Understanding disparities in access to green space is more complex than measuring simple distance to parks. For instance, “green space” is not necessarily synonymous with “park space.” In Baltimore, Black residents, on average, live closer to parks than any other racial group; yet White residents have access to more park acreage and the parks in Black communities are often more congested than parks in White communities. 35 Similar findings were also observed in an analysis of park equity in Colorado, which found that although non-White and low-income populations had the highest proximity to parks, White and high-income populations had increased access to larger higher quality parks. 36 In general, though, multiple studies have observed that low-income populations tend to have less access to both parks and green spaces compared with high-income populations. 37 , 38 , 39 , 40 , 41 , 42 Poor communities also have a more difficult time maintaining and improving parks due to limited financial and social capital. 43 , 44 Furthermore, elevated public safety concerns in lower income areas prevent people in those communities from freely enjoying parks and recreational facilities. 45
All of these qualities amount to park equity (defined here as the state of having equally and meaningfully distributed park spaces and resources across all communities)—or lack thereof—being an environmental justice (EJ) issue. In addition to lacking park equity, low-income communities and communities of color are often stressed by greater environmental contamination and more overburdened by hazardous waste sites, landfills, air polluting facilities, and heavily trafficked roads and highways compared with their wealthier counterparts. 46 , 47 , 48 , 49 , 50 , 51 Cumulative pollution exposure in low-income communities is roughly three to four times higher than in wealthier communities and, therefore, outdoor activity in these communities may lead to harmful chemical exposures. 52 Consequently, low-income communities of color also experience higher rates of respiratory diseases such as asthma and bronchitis, as well as increased rates of breast cancer and leukemia. 53 Compounding this is a characteristic lack of medical services in these communities, creating a double disparity of increased risk and decreased capacity to overcome it. 54
The role of geospatial tools in addressing park equity
Several studies have employed geographic information systems (GIS) technology to map disparities in park access and use. 55 , 56 , 57 , 58 For example, ParkIndex aims to provide stakeholders with a simple measure for identifying “park deserts.” 59 ParkIndex uses four factors to determine park need: (1) distance to nearest park, (2) number of parks within 1-mile (SI: 1.61 km) street network, (3) amount of park space within 1-mile street network, and (4) average park quality determined using the Community Park Audit Tool. 60 This method placed high importance on park proximity and used a network analysis, instead of traditional buffering, to measure park access. In contrast, ParkServe, developed by The Trust for Public Land, calculates park need using only socioeconomic factors: (1) population density, (2) density of youth under age 20 years, and (3) density of low-income households. 61 Other studies using GIS to assess park equity employ a more mixed approach using both proximity and socioeconomic factors. 62
The Maryland Department of Natural Resources (MDNR) created the original Park Equity Assessment mapping tool to inform resource allocation priorities by identifying areas of high park need throughout the state. The tool's underlying model analyzed and prioritized census block groups (CBGs) in need of public park space based on four factors: (1) Euclidean distance to parks (weighted 50%), (2) population per CBG (25%), (3) households within 185% of the federal poverty level (12.5%), and (4) population of children <17 years and adults >65 years per CBG (12.5%). This model prioritized park space investments in areas that had higher concentrations of children <18 years, residents near and below the poverty line, population density, and more distance to public park space.
Considering potential gaps and limitations present in the original tool, MDNR collaborated with the authors to develop an updated Maryland (MD) Park Equity Mapper. This new version of the mapping tool better addresses barriers to public park space access that residents throughout the state of MD face. MD Park Equity Mapper v2.0 includes several relevant factors organized as nine data layers and includes multiple state-specific context layers to reveal larger inequities that may influence the use of local green spaces. This article illustrates the development process, function, and utility of the updated MD Park Equity Mapper and presents a case study for using this tool for comparing green space access across the state.
METHODS
Tool development and features
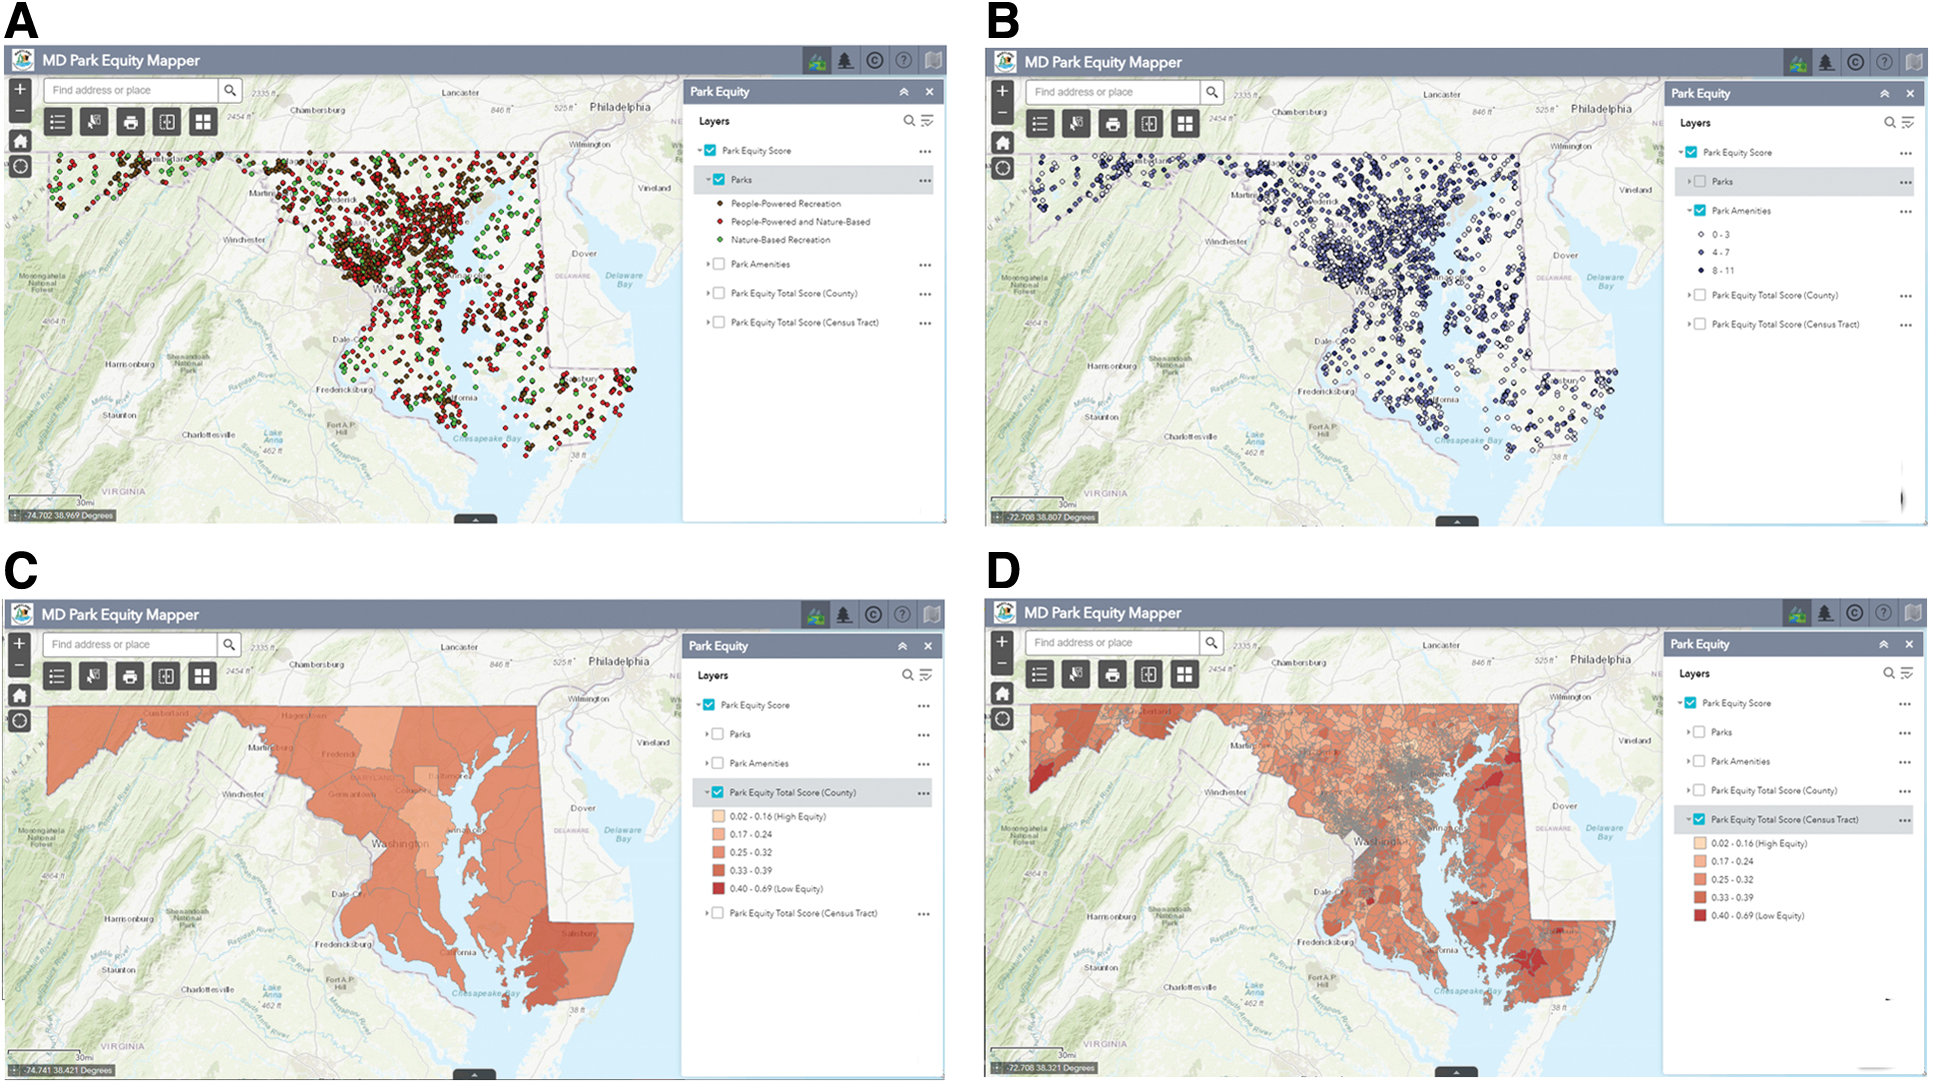
The 2019–2023 MD Land Preservation and Recreation Plan (LPRP) was used to generate a data set of county-reported park locations throughout MD. 63 A quality assurance/quality control protocol (utilizing Google Maps satellite imagery) was developed to identify duplicate, incomplete, and missing records in the LPRP, and these records were omitted from the data set. The final list included 1864 parks. Street address data for each park were transformed into a latitude and longitude point data layer (Fig. 1A). The original database included information on the presence or absence of the following amenities: (1) natural areas, (2) hunting areas, (3) fishing areas, (4) picnic areas, and (5) water recreation areas. The following amenity factors whether present or absent were added to the park data set: (1) playground areas, (2) sports facilities, (3) waste receptacles, (4) restroom facilities, and (5) fee requirement for entry. In many cases, park features were further verified using information found on county and state park websites. After data cleaning, the number of amenities per park was added to the tool as a point data layer (Fig. 1B).
MD Park Equity Mapper v2.0 (Permalink:
The authors conducted a literature review of studies related to the social and environmental variables influencing park use, access, and benefits (n = 80) to determine the relevance of these factors and assess other factors to be added to the model. Twenty-eight park equity and context factors (including the original four) were considered and organized into five broad categories: (1) demographics, (2) accessibility, (3) functionality, (4) safety, and (5) environmental hazards (Table 1).
Indicators Included in the Literature Review Organized by Category
From the total studies included in the literature review, a sample (n = 10) of the most extensive park equity studies was selected to determine which variables were most often cited as major factors affecting park equity. The majority of reviewed studies in this sample emphasized income (8 of 10 studies), population density (8 of 10), and park distance (6 of 10) as being important factors affecting access to park space, but none of the articles were conducted in a way that categorically ranked these factors. Although walkability and public transportation access were the least mentioned factors, the studies that included them found that these factors were positively associated with park space access and the associations were significant. 64 , 65 , 66 Based on this evidence, the following eight factors were selected to provide more detailed measure of park equity: (1) population density, (2) wealth status, (3) ratio of children <18 years of age, (4) ratio of adults >65 years of age, (5) ratio of non-White residents, (6) distance to the nearest park, (7) distance to the nearest public transportation access point, and (8) walkability index score. A ninth factor, linguistic isolation, was included at the request of MDNR to assist in advancing their mission to provide services and resources to underserved populations (Table 2).
Factors Used to Calculate Park Equity Total Scores in the Maryland Park Equity Mapper
The nine park equity factors were combined using a weighted model to establish the park equity total score for each CBG (Table 2). Weights were established based on the number of studies in the sample that cited each indicator as a major factor affecting park equity. Each indicator is scored on a scale of 0.00–1.00, reflecting percentiles averaged from all CBGs in the state. Scores are divided into five choropleth classes using natural breaks, with darker shades representing higher scores and, therefore, higher need for park equity (Fig. 1C, D). Note that higher walkability contributes to lower park equity because residents in more walkable areas are more likely to utilize park space. 67 As a result, areas with higher walkability scores should be prioritized for interventions.
Embedded subtools within the mapper allow for finer analysis of park equity. The “Select and Chart” tool displays a bar graph including each factor score as well as the total park equity score for a selected CBG. This visual presentation allows for an easy comparison between factors and their relative influence on the total score. The “Advanced Stats” button toggles the park equity bar chart to a clustered box-and-whisker chart, each cluster representing a different factor with grouped data from the selected CBGs, county, and state. Displayed this way, users can view the minimum and maximum values, quartile ranges, and median values associated with each factor and census block group. The “Report” button generates a separate window with these and other descriptive statistics displayed as a table and this report can be downloaded as a PDF.
Other useful tools include the “Side-by-Side Map Viewer” and “Report Generator.” The Side-by-Side Map Viewer enables the user to compare any two factors in the same location or in different locations (Fig. 2). The Report Generator tool enables users to print the map of the currently selected location(s), visible layer(s), and data generated by the Select tool. Importantly, this tool allows users to export and share their findings with peers, stakeholders, and policymakers.

Selecting the “Side-by-Side Comparison” button (not shown) provides an output page where users can select which indicators they wish to see simultaneously. The adult 65+ (left) and children <18 years (right) layers are shown above for the Southern Maryland region. Areas that appear dark in both maps indicate an overlap where populations of older adults and young children are highest. Park equity critically serves the physical activity and socialization needs for these populations. This can be seen in the towns of Indian Head, Waldorf, St. Charles, California. Color images are available online.
RESULTS
Case study: park equity in Langley Park, MD
The 0.99 mi 2 (SI: 2.56 km 2 ) town of Langley Park is located in Prince George's County, MD, and has a population of ∼19,089 residents, a vast majority of whom are non-White (98%) and many who are of low-income status (48%). 68 Langley Park is encircled by major roadways and in the direct path of the currently underconstruction Purple Line light rail corridor. 69 The authors used the MD Park Equity Mapper to visualize the landscape of green space and park access in Langley Park alongside other EJ indicators.
In MD, total scores range from 0.02 to 0.69. With a park equity total score of 0.4, Langley Park's combined seven CBGs are in the top 20th percentile—the highest class shown—for low park equity (Fig. 3). Factor scores for population density (0.56), low wealth (0.68), and linguistic isolation (0.6) are much higher for the seven selected CBGs than for the Prince George's County (0.14, 0.45, and 0.07) and State of MD (0.19, 0.46, and 0.03) averages. The youth score is similar across Langley Park (0.47), Prince George's County (0.52), and MD (0.46). The non-White score in Langley Park (0.76) is only slightly less than the Prince George's County value (0.8), but both are nearly twice the MD average for this factor (0.42). The adults 65+ score in Langley Park and Prince George's County is equal (0.05), but lower than the MD score (0.1). The public transit score for Langley Park could not be generated. The map view also shows that four of the seven CBGs are in the 20th percentile for low equity, the remaining three CBGs are in the 40th and 60th percentiles. The status quo “Equal Weights” (where each of the nine factors is the same model weight of 0.11%) and the “Different Weights” models (Table 2) provide nearly identical total score values.
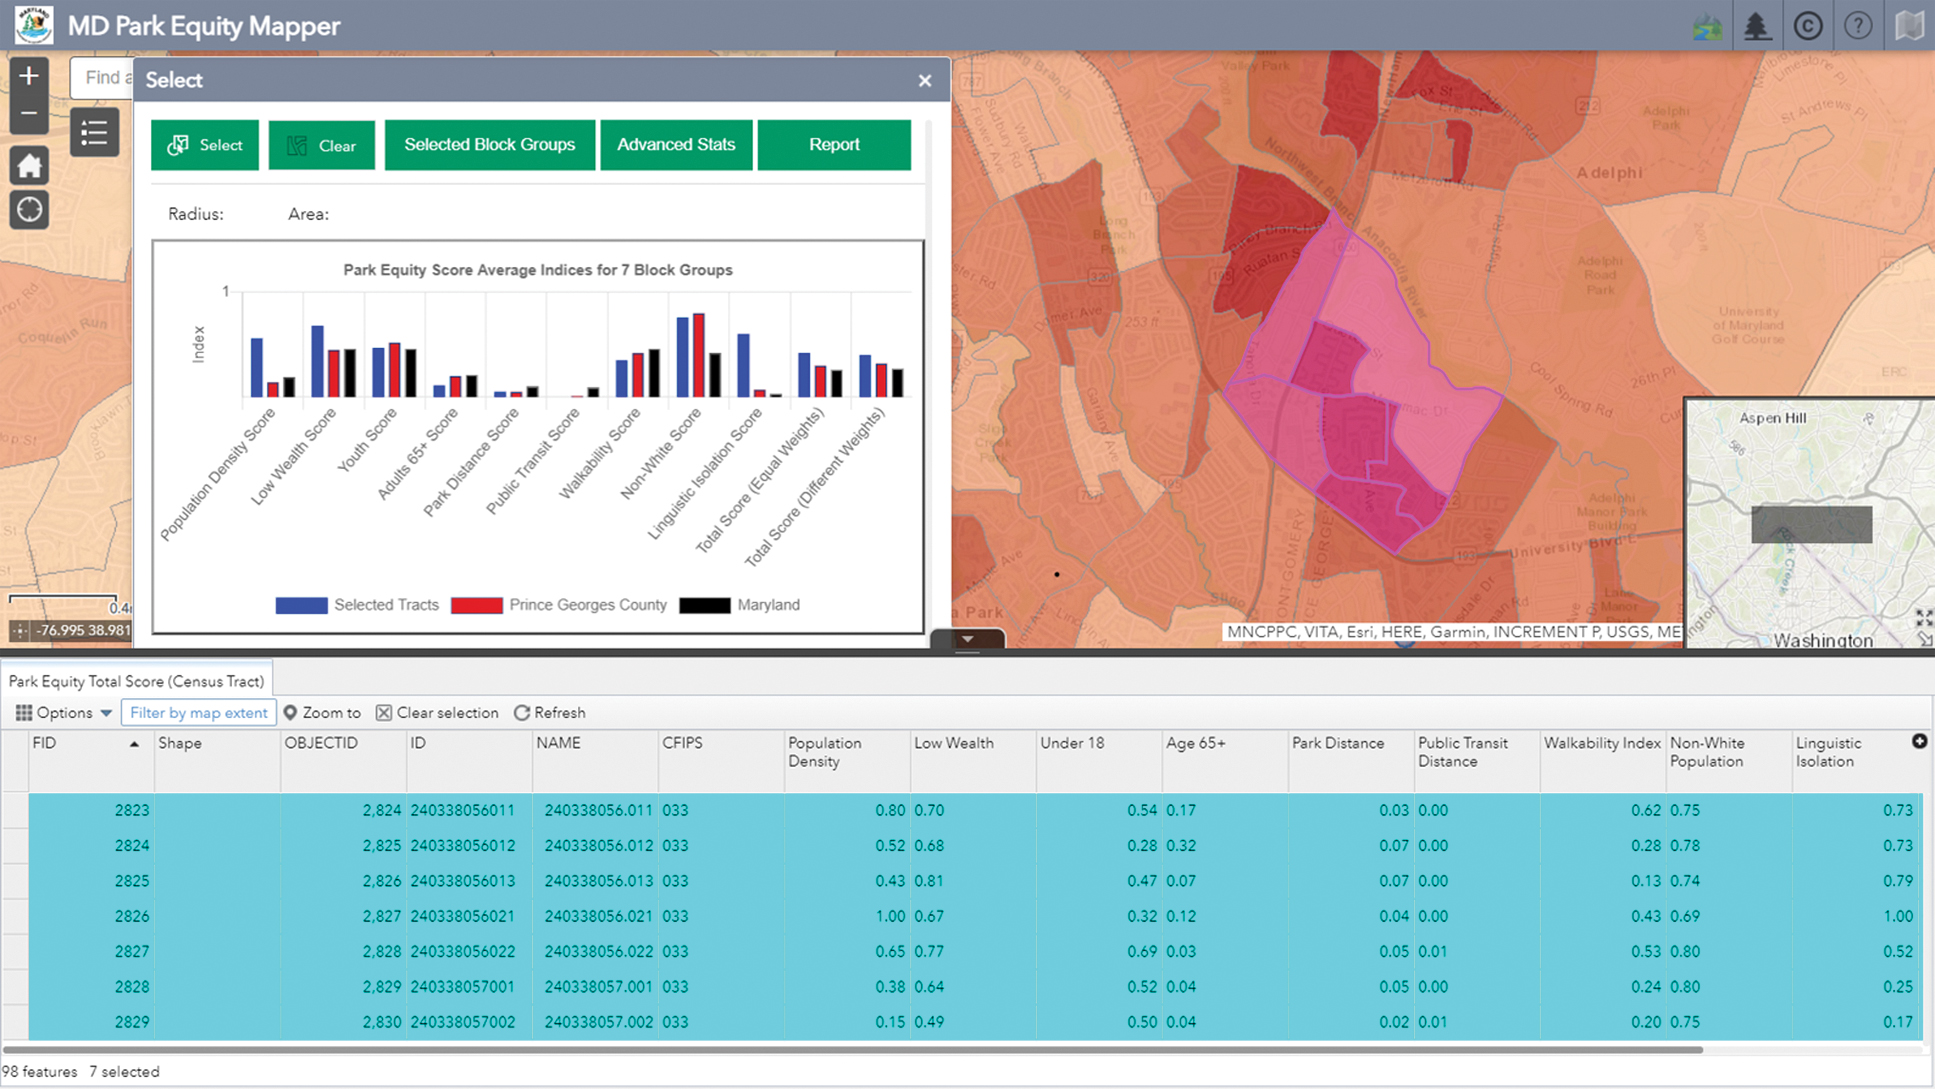
The seven CBGs comprising the town of Langley Park are highlighted using the MD Park Equity Mapper's “Select” tool. The “Select” window displays the Park Equity Factor Scores (and total score) as a bar chart. Two models are represented for the total score. The “Equal Weights” model presents the total if all factors weight with the same value (i.e., 0.9%). The “Different Weights” model weights the park distance, population density, low wealth status factors at 16.0%; non-White population at 12.0%; and the remaining five factors at 8.0%. The windowpane at the bottom of the screen displays the explicit data fields and values underlying the selected CBGs. CBGs, census block groups. Color images are available online.
The “Advanced Stats” clustered box-and-whisker chart provides for a finer analysis of the park equity data, displaying the minimum, first quartile, median, third quartile, and maximum values for each factor (Fig. 4). The median scores for Langley Park are notably higher than the county and state medians for the following factors: population density, low wealth population, and linguistically isolated population. This indicates that, even when accounting for extreme outliers, Langley Park residents occupy more dense living situations, are poorer, and are less likely to be fluent in English compared with the rest of the Prince George's County and the rest of MD. Alternatively, median values for youth score and park distance score are similar between Langley Park, Prince George's County, and the rest of MD. The median for adult 65+ score and walkability score in Langley Park is lower than the county and state values. Finally, the median non-White score for Langley Park is lower than the Prince George's County median but higher than the MD median.
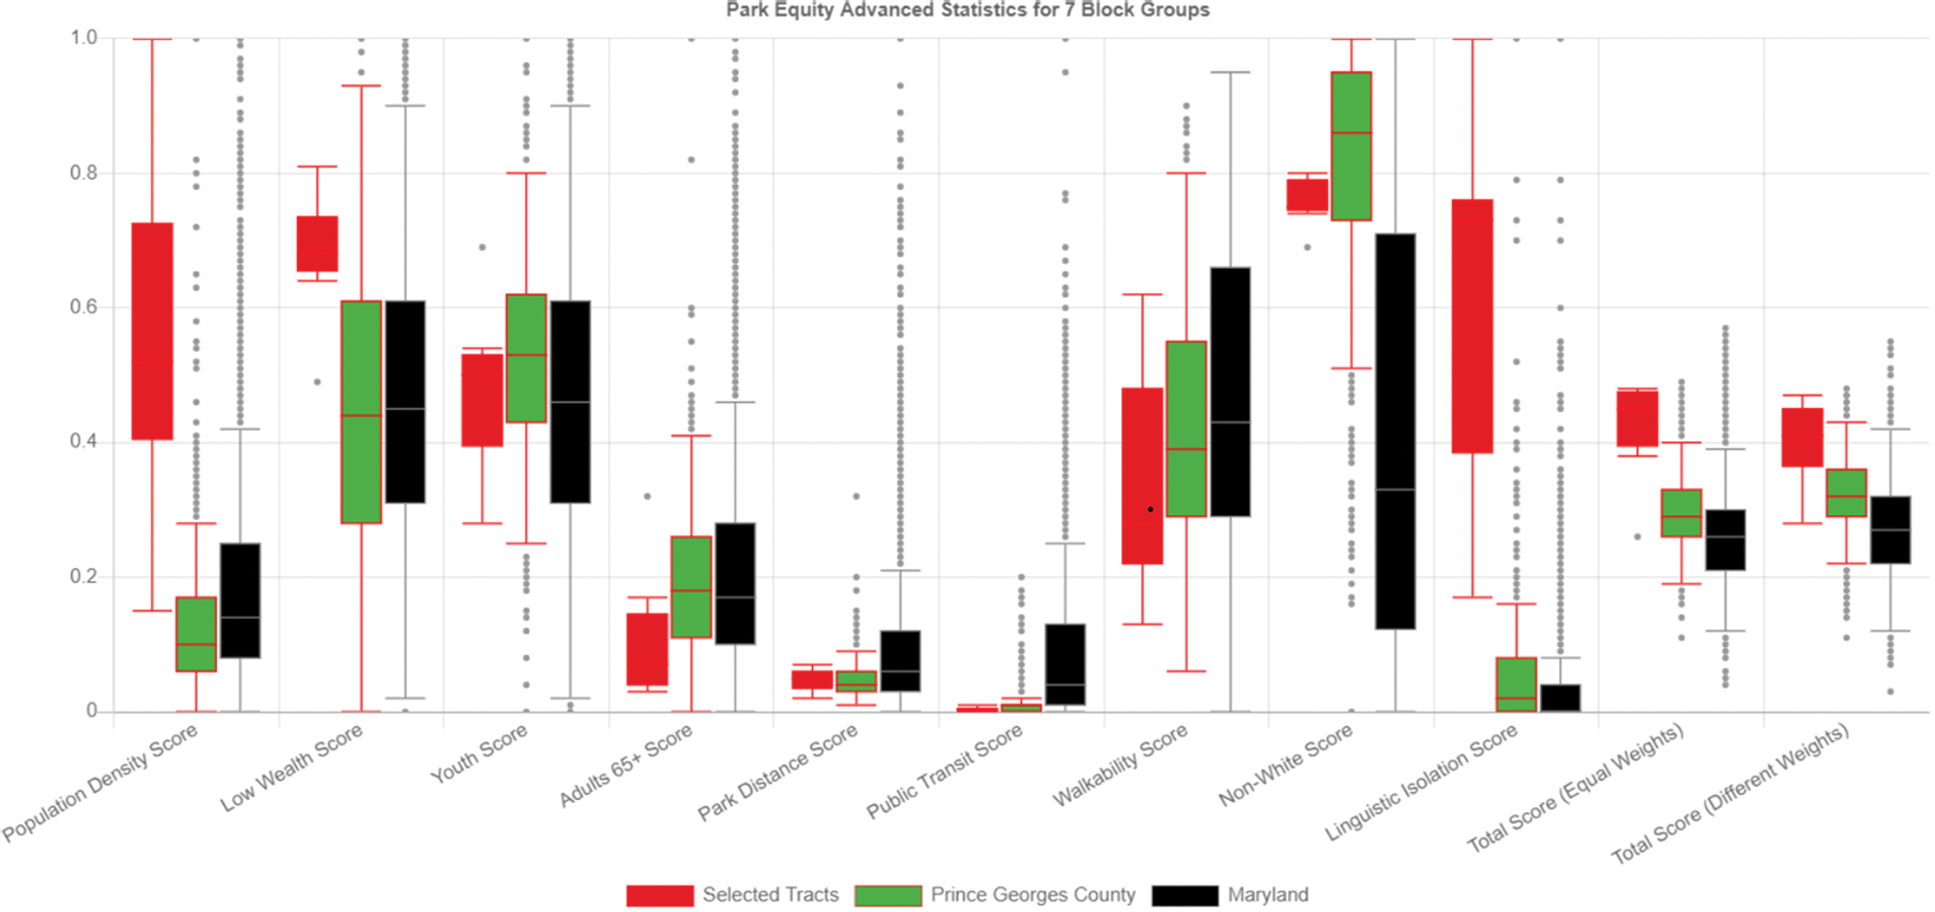
The “Advanced Stats” Button (not shown) replaces the original bar chart with a series of box-and-whisker plots, one for each indicator. This view allows users to identify the descriptive statistics (including minimum, first quartile, median, third quartile, and maximum values) associated with selected CBGs, county, and statewide average. Color images are available online.
DISCUSSION
Demonstration of Park Equity Mapper v2.0: Langley Park case study
MD Park Equity Mapper v2.0 represents a significant update to the park equity assessment tool previously developed by the MDNR. Adding to the original five park equity determining factors (population density, income, population aged 17 years and younger, population aged 65 years and older, and distance to a park), the new version includes the following factors: concentration of non-White residents, distance to public transportation, walkability, and linguistic isolation. These additions were made based on the results of a literature review (n = 10 studies) on park equity and barriers to park access, as well as conversations with MDNR. The mapper is also newly equipped with subtools to generate graphs, reports, and side-by-side comparison maps that aim to provide (1) more in-depth analysis and understanding of the park equity in MD and (2) improved interactivity and utility for users.
These new features are demonstrated here using Langley Park, Prince George's County, MD, as a case study. Although the score for distance to parks in the selected seven CBGs was comparable with the park distance scores across the county and state, results for other factors highlight overlapping disparities, with values for population density, low wealth, and linguistic isolation exceeding the county and state percentiles. Notably, the median linguistic isolation and population density scores in Langley Park were 40–50 percentile points higher than the county and state medians.
With a park equity total score of 0.4, Langley Park falls into the highest rank (0.4–0.69) for green space disparity, indicating a need for intervention. However, users should consider that the total score for Langley Park implies both limited availability of park space and notable socioeconomic barriers to park access. Therefore, interventions to improve park equity in this geographic area must strive to be more comprehensive than simply developing more park space. Initiatives should also endorse policies to minimize barriers toward park equity associated with low wealth and linguistic isolation (i.e., reducing air and water pollution and providing multilingual signage and culturally relevant park spaces) to ensure that all residents can fully utilize existing and new park spaces. Residents of Langley Park can use the results from this tool to advocate for such holistic interventions.
Limits and comparisons with other park equity tools
The factors used in the MD Park Equity Mapper's Total Park Equity Score are comparable with those used in other green space equity tools. For example, population density, children <18 years, and low wealth scores are analogous to the three factors used in ParkServe's equity tool. These factors help identify needs based on demographics—population dense areas need more parks than less dense areas, children need more exercise than adults, and low-income households could benefit more from the positive effects of green spaces compared with higher income areas. To supplement these demographic factors, we added two more: (1) adults 65 and older, because elderly residents prefer to exercise outdoors and have much to gain from the mental health benefits provided by green space, 70 , 71 and (2) non-White population, because, similar to low-income populations, non-White populations often suffer a disproportionate burden of environmental exposures compared with White populations. 72
We also used proximity and access factors in our analysis. Distance to public park space is the same factor used in ParkIndex. However, ParkIndex uses a network analysis method that measures distance to parks based on actual street distance to account for barriers such as buildings, highways, and rivers. In contrast, our tool uses a buffering method based on absolute distance instead of street network distance. We recognize that the buffer method alone is too simple to reliably measure access and have added walkability and public transportation factors to supplement this deficiency in our model.
In addition to the proximity measures, the ParkIndex model also includes a quality measure. The quality factor is an average of the scores of six quality categories that are based on the Community Park Audit Tool. The score of these six quality categories is determined by the sum of several park amenities and concerns. Park amenities that increase quality include playgrounds, basketball courts, tennis courts, skate parks, dog parks, restrooms, and artistic and historical features. The Trust for Public Land, the creator of ParkServe, has another tool called ParkScore that also counts park amenities as measures of quality in its model for park need. 73 Both tools have been used by researchers to access park access and equity. 74 , 75 Like these other tools, the MD Park Equity Mapper includes a count of the number of park amenities per park, but this measure does not influence the total park equity score. This is because park quality can be subjective, as the practical uses of various park amenities can differ across demographics and thus the value of these amenities does not remain constant. Furthermore, expensive parks with more amenities are not always desired by residents of low-income areas worried about environmental gentrification and park segregation.
Even with its updates, the present tool is not without limitations. Although studies suggest that park size is an important factor in determining park equity, 76 , 77 the MD Park Equity Mapper flattens all parks to points rather than polygon areas. As a result, proximity to park space may be underestimated for CBGs near large acreage parks and overestimated for CBGs near small parks. Future versions will seek to capture the percentage of park space within a radius of the CBG centroid. 78 Another limitation, the assumption that high scores for low wealth and non-White factors equate to environmental injustice, can be resolved in future versions by including explicit environmental health factors (e.g., particulate matter data, asthma prevalence, and emergency room visits).
Decision makers can bolster the effectiveness of the mapper by applying a mixed method (i.e., qualitative and quantitative) approach to identifying areas in need of more or better park equity. 79 Researchers can use the tool to identify areas of park need and then employ semistructured interviews 80 , 81 , 82 , 83 and Photovoice methodology 84 , 85 , 86 , 87 , 88 survey instruments or community audit tools to determine residents' specific perceptions regarding their access to green space. 89 Communities may also use other tools, such as the community block assessment tool, 90 in conjunction with mapping tools to assess the quantity and quality of the different aspects of their built and natural environments. Such information serves to ground truth the outputs of the park equity mapping tool as it is known that spatial models are inherently flawed when generalizing at the CBG level. 91 Also, the tool can be used by community scientists or in community-based participatory research as it provides users with an opportunity to visualize and interact with a variety of parameters about their own neighborhoods in a way that was previously unavailable. 92 , 93
CONCLUSION
The MD Park Equity Mapper is an important asset for policymakers, environmental health officials, and community members working to advance EJ regarding parks and other green spaces. This tool lays the foundation for park equity analysis in MD and is a model for other state-level EJ screening tools. The mapper expands the efficacy of the MDNR's first park equity tool by increasing the number of weighted factors (from five in the original version to the present nine) for modeling park equity and reweighting the importance of each factor based on relevant findings from peer-reviewed literature. The new version of the tool uses nine data layers to assess park equity and includes a suite of new utilities including functions for selecting multiple CBGs, charting park equity data in easily interpreted graph, comparing mapped factors side-by-side, and outputting a report for dissemination and inclusion in other documents. The present failings of the tools reflect a lack of available databases for key factors affecting park equity (including park area, park quality, maintenance, facilities available, and more). Efforts to improve data gaps would result in a more powerful and versatile MD Park Equity Mapper. The tool can be accessed freely by visiting the following link:
Footnotes
ACKNOWLEDGMENTS
We thank the following graduate and undergraduate interns for data processing and literature review contributions: Coline Bodenreider, Menna Kassa, Alex Wang, Summer Khan, Noah Buchsbaum, Rami Homsi, Haley Mullen, Laura Schmidt, Jewel Aleshire, Jameela Rogers, Anna Brinley, Miranda Mlilo, and Juanita Richards. We also thank Sandra Olek and Kevin Coyne at the MDNR for guidance and preliminary work on the original Park Equity Mapper tool.
AUTHORs' CONTRIBUTIONS
All authors have read and approved this study.
AUTHOR DISCLOSURE STATEMENT
The authors have no conflicts of interest to disclose.
FUNDING INFORMATION
This study was supported by funding from the MDNR and National Oceanic and Atmospheric Administration, Grant number 306-10B 14-19-2531 CZM 153. Jan-Michael Archer was supported by NRT-INFEWS: UMD Global STEWARDS (STEM Training at the Nexus of Energy, WAter Reuse and FooD Systems) that was awarded to the University of Maryland School of Public Health by the National Science Foundation National Research Traineeship Program, Grant No. 1828910.