
Abstract
Background:
Environmental racism, community stressors, and age-related susceptibility play a significant role in environmental inequality. The goal of this article was to use an inequality index (II) to assess the level of equality in environmental threats and hazards based on race, poverty, and age in Washington State.
Methods:
Using the Washington Environmental Health Disparities Map, we quantified the level of disproportionate burdens on communities with greater populations of people of color, people in poverty, children younger than 5, and people older than 65 using 3 cumulative environmental indices and 10 individual environmental indicators.
Results:
Census tracts with a higher proportion of people of color and those with people living below 185% federal poverty levels were found to be disproportionately burdened by environmental threats (II = −0.175 and II = −0.167, respectively, p < 0.001). Individual environmental indicators were found to disproportionately burden communities of color and low-income communities. Children younger than 5 were also disproportionately burdened by cumulative environmental indices (II = −0.076, p < 0.001) and individual indicators. Our analysis did not show disproportionate burden of environmental health threats based on the proportion of people older than 65 (II = 0.124, p < 0.001).
Discussion:
The disproportionate burden of the cumulative environmental threats on communities of color and low-income communities in this study corroborates similar analyses. These findings can be applied in policy and regulatory actions to correct the distributive environmental disparities.
Conclusion:
We found much higher burdens among historically marginalized communities and children who are more susceptible to environmental threats and hazards.
INTRODUCTION
Environmental racism refers to “policies, practice, or directive that differentially affects or disadvantages individuals… or communities based on race or color,” 1 , 2 , 3 Due to the institutionalized and systemic racism regarding environmental decision, race has become a key predictor of environmental health quality and health outcomes due to the unequal distribution of environmental hazards and pollutants and disparities in social, natural, and built environments, resulting in environmental health disparities. 4 , 5
Community-level vulnerabilities and individual-level susceptibilities such as poverty or biological susceptibilities have been shown to exacerbate environmental health disparities. 6 Interactions between race and socioeconomic status, differences in access to economic resources, and limitations to social mobility have all widened environmental health disparities. 7 , 8 , 9 In addition, studies have found socioeconomic stressors to contribute to both community- and individual-level vulnerabilities. 10 Individuals who are more susceptible to the adverse effects of environmental pollution, such as young children, also are more sensitive to the impacts of environmental health threats and hazards. 11 , 12 , 13
Cumulative impact assessments using environmental justice (EJ) mapping tools document environmental health disparities at the local, regional, and national levels. 14 , 15 , 16 , 17 , 18 Such assessments have been informative in identifying environmental health disparities in which communities with fewer economic and social resources experience greater environmental threats to their health across the United States. 19 , 20 , 21 , 22 Understanding how race, poverty, and age relate to cumulative impacts of environmental threats and risks in communities is essential to achieve EJ. 23
The use of formal inequality analysis methods has been increasing to better characterize the cumulative impacts of environmental hazards, extrinsic vulnerabilities, and intrinsic susceptibilities. 24 , 25 , 26 Inequality analysis helps to better identify subpopulations that are disproportionately burdened, and to suggest improvements to specific environmental indicators to best correct for the disproportionate impacts in affected communities. Despite its usefulness, there are only a limited number of studies conducting formal inequality analysis on statewide cumulative impact mapping tools. 27 , 28
The Washington Environmental Health Disparities Map was developed through a participatory process with communities in Washington State. Since its release in 2019, the tool has been included in legislative bills in Washington State related to EJ, and several state agencies in Washington have already begun using the map to inform decisions on resource allocations and prioritization. While sensitivity analyses have been performed, formal inequality analysis of the Washington Environmental Health Disparities Map is yet to be conducted and is crucial for EJ policy and decision-making. The goal of this article was to use an inequality index (II) based on the cumulative share of environmental threats to quantitatively assess the level of equality in environmental threats and hazards based on race, poverty, and age using the Washington Environmental Health Disparities Map.
MATERIALS AND METHODS
Environmental threat and exposure data
The Washington Environmental Health Disparities Map was created through a community/academic/government partnership. The details are documented in a previous publication by the authors. 29 The framework used for the Washington Environmental Health Disparities Map is similar to that of the California OEHHA CalEnviroScreen. 30 Data used in this study were downloaded from the Washington State Department of Health (DOH) Washington Tracking Network (WTN) for the topic “Environmental Health Disparities” version 1.0. IRB approval was not needed for this study because the data was publicly available at the census tract level and not individually identifiable. The map combined 19 environmental and population indicators. The individual indicators were assigned to one of the four categories: (1) Environmental Exposures (measurement of pollutants), (2) Environmental Effects (adverse environmental quality that may pose a risk to nearby communities), (3) Sensitive Populations (intrinsic biological susceptibility), and (4) Socioeconomic Factors (extrinsic vulnerabilities that modify experience to environmental hazards). Table 1 describes each of the indicators used in the Washington Environmental Health Disparities Map and its data source.
List of 19 Indicators with Abbreviated Names in Parentheses for the Washington Environmental Health Disparities Map, Version 1.0
ACS, American Community Survey; CNT, Center for Neighborhood Technology; NPL, National Priorities List; RMP, Facilities with Risk Management Plans; RSEI, Risk Screening Environmental Indicators; TSDF, hazardous waste treatment storage and disposal facilities; WDIS, wastewater discharge.
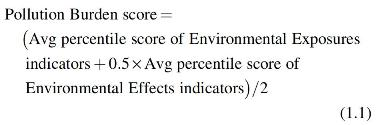
The detailed justification of the formula and selection of indicators are reported in the previous publication. 31 For each indicator, individual census tracts were assigned a percentile score, based on the rank-order of the raw values. The percentile score of the indicators was averaged to create an average percentile score for each category. The final cumulative impact score, named the environmental health disparities score, was calculated based on the following formula [Eqs. (1.1)–(1.3)] and placed into deciles as the final environmental health disparities ranking. The Environmental Effects category was weighted by half to account for uncertainties between proximity to sources of pollution and the actual exposures [Eq. (1.1)].

In the WTN's publicly available mapping interface, the different categories and indicators are displayed as a relative ranking, and put into a category as a decile, with category 1 being the least impacted and 10 being the most impacted by the environmental health disparities.
Vulnerability/susceptibility related to environmental threats and exposures
To visualize the relationship between indicators and the final cumulative impact ranking, cumulative share figures were created. The cumulative share of the population ordered by measures of vulnerability or susceptibility was plotted on the x-axis. The cumulative share of the environmental threats and hazards (final environmental health disparities ranking, environmental exposure category, and environmental effects category) and 10 of its individual indicators were plotted on the y-axis.
Measures of vulnerability and age-related susceptibility include proportion of people of color, people living in poverty, children younger than 5, and people older than 65. Estimates for people of color were obtained through the Washington State Office of Financial Management 2015 estimates to calculate the proportion of people of color for each census tract as the sum of all race/ethnicity categories that are not non-Hispanic whites. Estimates for people living in poverty (percentage of the population living below 185% of the federal poverty level [FPL]), children (percentage of the population younger than 5), and the elderly (percentage of the population older than 65) were obtained from the American Community Survey (ACS) 2012–2016 5-year estimates. Percentage of the population living below 185% of the FPL was chosen for consistency of poverty threshold across the Washington State DOH WTN tool.
In addition, we conducted analysis for race and income levels based on the Rural-Urban Commuting Area (RUCA) categories developed by the Federal Office of Rural Health and Policy. The specific RUCA codes designated as rural or urban census tract (Supplementary Data S1) are specified in DOH's guidelines for using RUCA for community health assessment. 32
We used an II, originally called the Concentration Index to measure income inequality and tax regressivity, to evaluate the distribution of cumulative environmental health disparities, environmental threats, and exposures. 33 , 34 , 35 While the II is related to the well-known Gini Index and the Lorenz curve, the II ranks census tracts by the measure of vulnerability such as income rather than by outcome. Although the Gini Index provides insight on distributional inequality of environmental outcomes, the II provides an additional statistical method to measure unequal distribution of environmental threats and hazards caused by socioeconomic factors. 36 Unlike using distance as a surrogate for environmental exposure using cumulative distribution function, 37 , 38 , 39 the II also measures distribution of the cumulative impacts of environmental threats and vulnerabilities.
The II was visualized by plotting the cumulative proportion of the population ranked by various vulnerability levels. Then, the II was calculated by twice the area between the plotted curve L(s) and the 45° diagonal line, known as the line of equality, as shown in Equation (2).
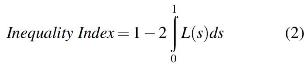
The II, ranging from −1 to 1, represents the level of inequality. When the inequality curve coincides with the line of equality (45° line), the II is equal to 0, implying equal distribution or burden of environmental threats. A negative II measures the disproportionality of distribution away from the line of equality toward census tracts less privileged, implying that the census tracts with greater disadvantage bear a greater burden of the environmental threats.
We calculated the II based on grouped level data as described in Kakwani et al. [Eqs. (3)–(6)]. 40 The equation accounts for the score of census tract t, μt, the proportion of the total population that is contributed by the tract, ft, and the relative rank of the tract, Rt. II is computed as the cumulative proportion of the population up to the midpoint of each tract, mean score across all census tracts.

There were a few assumptions of the model. The first was that environmental equality transfers the burden from the more vulnerable to the less vulnerable, regardless of the health status. We also based our analysis on the derivation of distribution-fee asymptotic standard errors for grouped data, such as ranked census tract data. 41 , 42 With the relatively large number of census tracts, we used normal distribution as an approximation of the t-distribution (Supplementary Data S2).
We tested the null hypothesis as C = 0 for each environmental indicator and estimated 95% confidence intervals using Equations (3)–(6). We considered results significant when p < 0.05. All statistical analyses were conducted in R and RStudio (version 3.6.0; RStudio Team). We coded the II calculation using Equations (2)–(6), and used packages ggplot2, dplyr, gridExtra, data.table for data management.
RESULTS
Descriptive analysis
Of 1458 census tracts, 13 census tracts were excluded due to no recorded population in the ACS 2012–2016 5-year estimate. The total sample size of 1445 census tracts was included in the analyses presented.
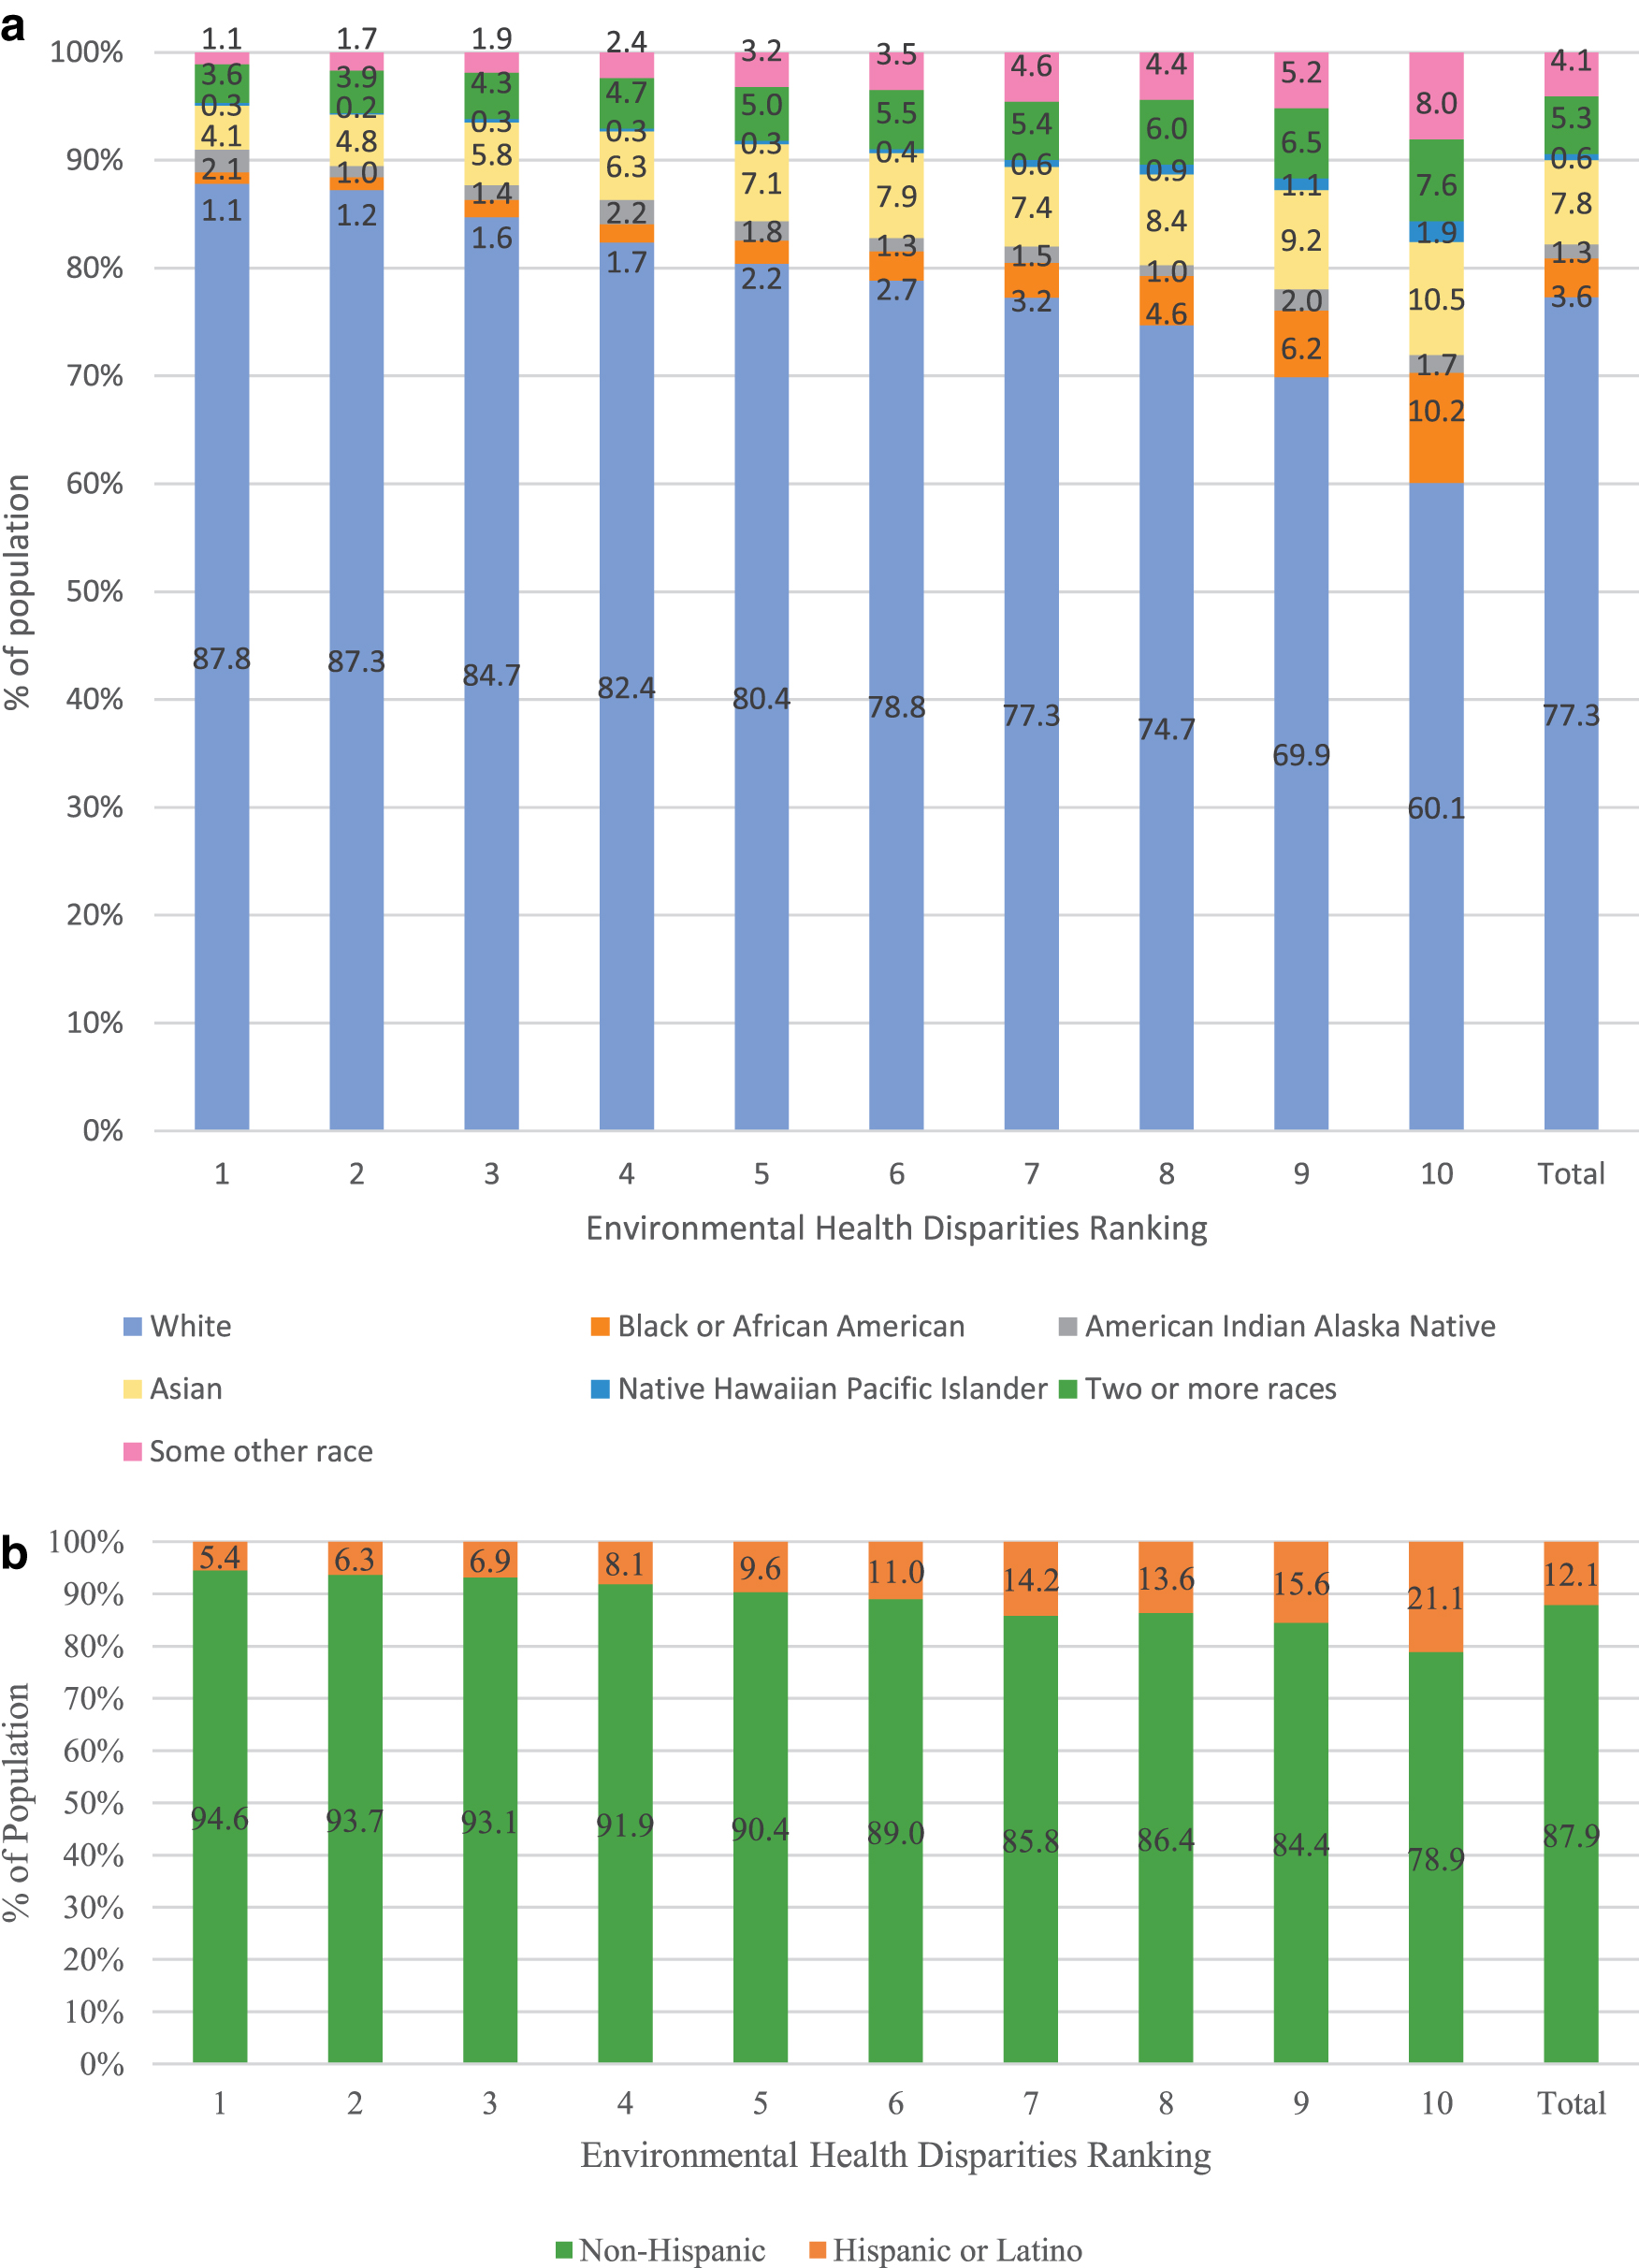
The population in Washington State was predominantly whites (77.3%), followed by Asian (7.8%), black or African American (3.6%), and American Indian Alaska Native (1.3%) (Table 2). Proportion of demographics varied between urban and rural census tracts. While the proportion of non-Hispanic whites was relatively similar between rural and urban census tracts, there was a greater proportion of Hispanic or Latino descendants and American Indian Alaska Natives who reside within rural census tracts compared with urban census tracts. There were a greater proportion of whites compared with the other racial groups in rural census tracts (83.8%) compared with urban census tracts (76.4%). Similarly, for people older than the age of 65, there was a greater proportion of elderly in rural census tracts (19.6%) compared with urban census tracts (13.7%).
Race and Ethnicity Composition of Washington State of All, Urban, and Rural Census Tracts, Based on American Community Survey 2012–2016 5-Year Estimates
We found uneven distribution of the cumulative environmental health disparities across different racial and ethnic groups (Fig. 1). More people of color lived in census tracts ranked “9” and “10” for the environmental health disparities ranking (i.e., communities most impacted by environmental health disparities 43 ) with an average of 30.1% and 39.9%, respectively, compared with the state average of 22.7%. Similar patterns were observed with people who identified as Hispanic or Latino for census tracts ranked “9” and “10,” with an average of 15.6% and 21.1%, compared with the state average of 12.1%.
Percentage:
Rural areas in the state also tend to have higher proportions of population living in poverty, but not necessarily greater levels of environmental exposure and pollution (Table 3). For example, in rural census tracts, there may be a larger proportion of people living below the 185% FPL (36.8%) in contrast to 24.8% of urban populations living below the 185% FPL. However, indicators of toxic release from facilities into air, traffic density, and average proximity to wastewater discharge had particularly wide range of raw values, with urban census tracts having higher mean values of diesel emissions, PM2.5 concentrations, toxic releases into air, and traffic density than rural areas. Yet, considering raw values of individual indicators, we observed higher mean values for lead risk in housing and wastewater discharge in rural census tracts compared with urban ones, suggesting that while there may be many environmental risks in urban areas, certain risks may be more important for rural areas.
Descriptive Statistics for the Environmental Health Disparities Map Indicators: Cumulative Rankings, Raw Values of Individual Indicators, and Demographic Vulnerability Measures for All Census Tracts, Urban Census Tracts, and Rural Census Tracts
EHD, Environmental Health Disparities; SD, standard deviation.
Inequality indices
The inequality curves above the 45° line suggested that people of color experienced disproportionate burdens of cumulative environmental health disparities, exposure, and environmental effects rankings and most individual indicators (Fig. 2 and Supplementary Data S3). The t-tests of inequality corroborated the extent of the disproportionate burdens observed (Table 4). For all census tracts in Washington State (Fig. 2a), IIs suggested that the cumulative environmental health disparities (II = −0.175, p < 0.001), exposures (II = −0.127, p < 0.001), and environmental effects (II = −0.105, p < 0.001) were all disproportionately distributed toward people of color. For individual indicators, census tracts with a greater proportion of people of color had a greater burden of pollution for all indicators, except for ozone and wastewater discharge (p < 0.001). For urban census tracts (Fig. 2b), cumulative environmental health disparities (II = −0.170, p < 0.001), exposures (II = −0.120, p < 0.001), and environmental effects (II = −0.095, p < 0.001) and individual measures of exposures and environmental effects except for ozone levels were disproportionately distributed with respect to communities of color (p < 0.05). For rural census tracts (Fig. 2c), all cumulative indices, PM2.5, ozone levels, lead risk, proximity to National Priorities List (NPL), Facilities with Risk Management Plans (RMP), and hazardous waste treatment storage and disposal facilities (TSDF) sites disproportionately burdened census tracts with a greater proportion of people of color (p < 0.01). There was no indication that ozone affects people of color disproportionately in the statewide analysis (II = 0.088, p < 0.001) and in urban census tracts (II = 0.114, p < 0.001). In rural census tracts, there was no indication that the toxic release into air indicator significantly burdened people of color (II = 0.052, p < 001).

Inequality curves for race:
Inequality Index and 95% Confidence Interval for Cumulative Rankings and Individual Indicators Based on % People of Color
A p-value >0.05 was considered to have failed to reject the null hypothesis.
With respect to poverty (Table 5), cumulative environmental health disparities (II = −0.148, p < 0.001), exposures (II = −0.018, p < 0.5), and environmental effects (II = −0.063, p < 0.001) were also disproportionately distributed toward census tracts with greater proportion of people living in poverty (Fig. 3a). For individual indicators, census tracts with a greater proportion of people living in poverty had a disproportionate burden to all indicators except for diesel emission and toxic release into air (p < 0.05). There was no evidence that the toxic release into air indicator disproportionately burdened people living in poverty (II = 0.064, p < 0.001). For urban census tracts (Fig. 3b), census tracts with a greater economic disadvantage experienced greater burden to all cumulative and individual measures excluding toxic release into air (p < 0.05). For rural census tracts (Fig. 3c), results showed significant burden of the cumulative indices, PM2.5, ozone levels, lead risk, and proximity to RMP sites on those who are economically disadvantaged (p < 0.01).

Inequality curves for poverty:
Inequality Index and 95% Confidence Interval for Cumulative Rankings and Individual Indicators, Based on % People Living in Poverty (185% Below Federal Poverty Level)
A p-value >0.05 was considered to have failed to reject the null hypothesis.
We observed disproportionate burden to environmental risks related to age (Fig. 4). We found that census tracts with a higher proportion of young children (younger than 5) experienced disproportionate burden of all three cumulative measures of environmental health disparities (II = −0.076, p < 0.001), exposure category (II = −0.041, p < 0.001), and environmental effects category (II = −0.029, p < 0.01) and individual indicators except toxic release in air, lead risk, and wastewater discharge (Table 6). Similarly, people younger than 65 experienced greater burdens for all three cumulative measures (Fig. 5), and individual indicators (PM2.5, diesel, toxic release to air, traffic, proximity to NPL, RMP, TSDF sites, and wastewater discharge) (Table 7).

Inequality curves for age-related susceptibility (children younger than 5) for all census tracts. The diagonal line (red) indicates the equality line. The solid (final cumulative EHD), dashed (cumulative exposure), and dotted lines (cumulative environmental effects) above the equality line indicate that census tracts with a greater proportion of children younger than 5 bear the greater distribution of cumulative environmental indicators. Color images are available online.

Inequality curves for age-related susceptibility (people older than 65) for all census tracts. The diagonal line (red) indicates the equality line. The solid (final cumulative EHD), dashed (cumulative exposure), and dotted lines (cumulative environmental effects) below the equality line indicate that census tracts with a lower proportion of people younger than 65 bear the greater distribution of cumulative environmental indicators. Color images are available online.
Inequality Index and 95% Confidence Interval for Cumulative Rankings and Individual Indicators for Children Younger than 5
A p-value >0.05 was considered to have failed to reject the null hypothesis.
Inequality Index and 95% Confidence Interval for Cumulative Rankings and Individual Indicators for People Older than 65
A p-value >0.05 was considered to have failed to reject the null hypothesis.
DISCUSSION
This study quantitatively assessed the level of equality in environmental threats and hazards based on race, poverty, and age using the Washington Environmental Health Disparities Map by conducting a descriptive analysis of the cumulative rankings and individual environmental indicators and by quantitatively analyzing the Washington Environmental Health Disparities Map using the IIs and inequality curves.
Statewide analysis showed census tracts with a higher proportion of people of color and people living in poverty as subpopulations with disproportionate burdens of environmental threats. Although the degree of inequality varied for specific indicators, similar disparities were found when stratified by rural and urban census tracts. Finally, census tracts with a higher proportion of children younger than 5 were found to experience a disproportionate burden of environmental threats and exposures.
The disproportionate burden of the cumulative environmental threats and hazards on communities of color and low-income communities in our study corroborates similar analyses in other states. Using CalEnviroScreen, studies found that people of color and people living in poverty experienced disproportionate burden to cumulative environmental threats and specific pollution burdens such as pesticide use, diesel emission, and solid waste sites. 44 Another study found that Hispanic/Latinos were more likely to experience greater pollution burden and live in lower levels of socioeconomic status. 45 An analysis in Michigan found that communities with more people of color, higher poverty levels, more renters, and lower levels of educational attainment experienced a disproportionate burden of air pollution and associated health risks. 46
Disparities in the proximity to single environmental hazards and single pollutants in this study were similar to those found in other regions across the United States. Particularly, disproportionate burden of air pollution on minority populations and lower income populations has persisted over decades. 47 , 48 In Maryland and southern California, cumulative health risks were found to be associated with racial/ethnic groups and socioeconomic characteristics related to National Air Toxics Assessment (NATA) and similar air pollution-related risk estimates. 49 , 50 Studies in Florida and California have found disproportionate burden on communities of color, particularly African American and Latino communities, related to exposure to air pollution and proximity to environmental degradation from Superfund sites and hazardous waste sites. 51 , 52 A different study found disparities on exposure to air pollution based on racial status, age, income, educational attainment, and poverty in the United States. 53 , 54 , 55
Our findings indicated a disproportionate burden of environmental health disparities on young children in Washington State that was similar to other studies across the nation. 56 , 57 , 58 As the exposure to environmental threats on young children mediated by levels of poverty can lead to a greater risk of adverse health outcomes during their life course, children should be considered an indicator of susceptibility to environmental threats and hazards. 59 , 60 In contrast, although old age and susceptibility to environmental pollutants such as PM2.5 is well documented, 61 our article did not find people older than 65 to be an age-related indicator that demonstrates disproportionate burden. Future analysis should further evaluate the relationship between age-related susceptibility in people older than 65 and other demographic indicators.
Our study provides unique insight on environmental burdens in rural Washington, demonstrating statistically significant burdens of pollution, including ozone, PM2.5, and RMP sites, on communities of color and people living in poverty within rural census tracts. While other studies in urban communities have yielded similar findings,19–22 few studies have evaluated specifically rural areas. 62 , 63 Additional consideration for urban and rural differences in environmental threats such as pesticide usage (not included as an indicator in the current version of the Washington map) and unique environmental characteristics of each should be accounted for in future EJ mapping.
Analysis in this study also shows the importance in monitoring differences in the absolute values of environmental and population-based indicators. While relative rankings are important to quantify the disproportionate burden on subpopulations or communities, EJ goals should strive to reduce the overall absolute numbers behind the indicators. If policies, regulatory actions, or community action ultimately results in distributive justice, both the distributional burden and absolute values (e.g., concentrations of air pollution) of environmental threats and hazards should shift over time.
Findings from this study can be applied to policies to address the environmental inequalities that are identified through EJ mapping tools. 64 , 65 EJ policies should include an in-depth analysis to better understand the impacts and consequences of the decisions relating to race, poverty, and children. 66 As policies are implemented, ongoing surveillance of the policy's impacts will be critical to address the historical harms on overburdened communities. 67 The II can be used to track improvements of EJ conditions over time, and as demographic data and environmental conditions evolve, these analyses can be repeated to monitor the change in environmental burdens among overburdened communities from policies to action. 68 , 69
EJ policies and programs can also address the drivers of the environmental disparities through meaningful community engagement. For example, an interagency EJ task force in Washington State recommended guidelines for establishing standards for EJ in state agencies and guidance on how to use the Washington Environmental Health Disparities Map in the state's decision making. A community engagement subcommittee conducted broad community outreach across the state and identified best practices and barriers to participation to increase meaningful community engagement for EJ policies and programs. The task force ultimately recommended strategies to prioritize and invest in an equitable structure for meaningful community engagement by “engaging with communities throughout the goal development, tracking, and development processes” to create accountability measures to reduce pollution and eliminate disparities. 70
There are a few limitations to this study. We did not conduct our statistical analysis of II based on specific race and ethnic groups; rather we focused our analysis on people of color as a single group. This was because of the large variability in the proportion of minority groups throughout the state. In addition, the nature of our analysis approach relied on rank-ordering of census tracts within Washington State, and did not account for actual regulatory limits or guidelines to exposure levels. Our analysis on environmental burden was also limited to the indicators in the Washington Environmental Health Disparities Map version 1.0. There may be benefits to integrating other environmental data or methods used for the EJ analysis, in addition to the II analyses conducted in this study. Finally, some studies suggest strategies for mitigating the degree of uncertainty associated with ACS data. 71 , 72 However, because DOH WTN does not adjust for measurement error in the ACS data related to the Washington Environmental Health Disparities map, we did not mitigate the measurement error in our analysis.
Despite these limitations, our study has several strengths. To our knowledge, this is the first study that quantifies the extent of environmental inequality using a cumulative impact assessment tool in Washington State based on race, poverty, and age. We also found that the extent of the disproportionate burden remains true when stratified by rural and urban census tracts, demonstrating the need to consider urbanicity and rurality in future EJ analyses. This study can offer a baseline measurement for future updates and developments for the cumulative impacts mapping in Washington State by conducting a systematic evaluation of the cumulative impacts using II.
CONCLUSION
This study demonstrated a statistically significant amount of disproportionate burden of cumulative environmental threats and hazards on people of color, those below 185% FPL, and children younger than 5 in Washington State. We found much higher burdens among historically marginalized communities and children who are more susceptible to environmental threats and hazards. Findings from this study are important to consider in an EJ strategy to address these distributive injustices.
Footnotes
AUTHORS' CONTRIBUTIONS
Conceptualization, E.M. and E.S.; methodology and formal analysis, E.M. and E.Y.W.S.; writing—original draft, E.M.; writing—review and editing, E.M., M.P., V.E.G., E.S., M.S., L.F., S.A.F., C.J.K., D.G., D.B., M.Y., and E.Y.W.S.
ACKNOWLEDGMENTS
We acknowledge the contributions of the communities who shaped the development of the Washington Environmental Health Disparities Map. Without their contribution, this work would not have been possible. This work is based, in part, on Dr. Min's research for her doctoral dissertation, which can be found at:
AUTHOR DISCLOSURE STATEMENT
No competing financial interests exist.
FUNDING INFORMATION
The University of Washington's National Institute of Environmental Health Sciences EDGE Center (5P30 ES007033) supported E.Y.W.S.'s time on this study.
Supplementary Material
Please find the following supplemental material available below.
For Open Access articles published under a Creative Commons License, all supplemental material carries the same license as the article it is associated with.
For non-Open Access articles published, all supplemental material carries a non-exclusive license, and permission requests for re-use of supplemental material or any part of supplemental material shall be sent directly to the copyright owner as specified in the copyright notice associated with the article.