
Abstract
Mapping tools that characterize environmental inequities and health disparities have shown to be an effective approach to facilitate environmental decision making at the state level. We developed the Vermont Environmental Disparity Index (VTEDI) to measure the cumulative impacts of environmental risk, social vulnerability, and health risk in the Vermont communities. In addition to exploring regions with high cumulative impacts, we conducted a Bayesian analysis, using weights of evidence, to understand the probabilistic association of poverty, populations on food stamps, race, and limited English proficiency (LEP) with exposure to multiple environmental risks. The results show that census tracts with high racial diversity and LEP residents are significantly associated with greater environmental risks, while poverty and food stamp use have weaker associations with exposure to environmental risks. The results demonstrate that environmental risks are significantly higher in communities of color and neighborhoods with more LEP residents than in lower income communities. The VTEDI is an effective tool in local environmental governance to explore cumulative environmental justice issues and to make informed decisions to redress environmental injustice.
Introduction
Spatial analysis has played a pivotal role in characterizing environmental injustice. Since the advent of the environmental justice (EJ) movement in the United States in the 1980s, numerous studies have explored the spatial distribution of pollution, environmental risks, and undesirable land use by race and income, demonstrating distinctive environmental disparities. 1 ,2 The EJ movement and related studies have since evolved to embrace spatiality that includes a broader set of intersecting social, environmental, and health burdens among different sociodemographic groups. More recent studies have combined multiple temporal and spatial scales to explore historical land-use practices with current economic, sociopolitical, and environmental inequities.3, 4 ,5,6,7 These spatial studies examining distributive inequities have been used as tools to address environmental inequities within communities and to initiate policy measures to address environmental and health disparities.
Studies conducted in the 1980s, such as the 1983 General Accounting Office study in the southeastern states 8 and the first spatial national study on toxic wastes and race, 9 laid the foundations for the EJ movement in the United States. This study established that race was the single-most defining factor in siting toxic waste facilities. The predictive power of race was stronger than poverty, land values, and homeownership. Approaches to spatial analysis have evolved over the past few decades, and different types of methods have been explored by researchers. Earlier studies identified the disproportionate distribution of hazardous sites in communities of color, with consequently differential health impacts among racial groups.1,8,9 With the expansion of the scope of EJ, spatial analysis has been applied to study other environmental risks such as air pollution, 10 ,11 noise pollution, 12 the impact of climate change, 13 toxic release during transport, 14 pedestrian safety, 15 and access to green space and recreational sites. 16
More recently, researchers have also paid attention to social vulnerability and how individuals and groups are differentially susceptible, thereby affecting their ability to cope and adapt when exposed to environmental risks. 17 ,18,19,20,21 In these cases, the social vulnerability indicators can act as “effect modifiers” and amplify the effect of the environmental risks.21, 22 ,23 For example, the lack of access to affordable healthy food and health services among socially vulnerable groups can confound the negative health impacts from environmental risks. 24 ,25 The interaction of high exposure to environmental stressors and the lower ability to cope among socially vulnerable groups leads to a so-called double jeopardy. 26
Researchers hence have been advocating for cumulative impact assessments of environmental, health, and social stressors in decision making and policy development. 27 Comprehensive mapping tools that combine socioeconomic characteristics, health factors, and environmental risks have been shown to be critical to mobilize local stakeholders and develop interventions and policies.21, 28 ,29 The Environmental Protection Agency (EPA)'s Environmental Justice Screening and Mapping Tool (EJSCREEN) provides some insights on specific environmental and social inequities at the national level.
However, EJSCREEN does not offer an option to explore interactions between a range of socioeconomic vulnerability variables and environmental risks. States such as California, 24 Washington, 30 Maryland, 31 and North Carolina 32 have developed mapping tools to identify communities with high environmental and health burdens. At least 17 states in the United States have developed mapping tools to explore cumulative impacts and to inform permitting decisions, financial allocation, and public engagement. 33
New Jersey is one of the few states that have passed a bill to address cumulative impacts, requiring the state to bar siting of polluting facilities in communities that have high environmental and health burdens. 34 Mapping hence serves as an important tool not just to identify distributive inequities but also to empower agencies and communities and inform environmental and policy decisions.
However, not all states are equally motivated to adopt EJ policies and mapping tools for various reasons.10, 35 Kim and Verweij found that high racial diversity is one of the essential preconditions for the high levels of EJ policy adoption across all the U.S. states. 33 Other critical factors include the presence of a strong environmental interest group, high-severity environmental problems, and a more liberal state government. EJ studies in the United States have also primarily been undertaken in major urban centers, while rural areas remain in the backseat of EJ efforts. 36 In this study, we fulfill the gap and explore the creation and analysis of a mapping tool in Vermont to identify EJ in the state.
Vermont is one of the few states that do not have a state-adopted EJ policy. Vermont's population is overwhelmingly white (94.2% identify as white) 37 and mostly rural based on various definitions by federal agencies and research institutions. 38 It is also often ranked as one of the least polluted states with low environmental health risks in the United States. 39 These conditions may hide the disparities of environmental burdens in the state, but it does not mean that they are not persistent. Lack of recognition of environmental injustices in the state also results in a lack of adoption of EJ policies in the state. In 2016, the Vermont Department of Environmental Conservation (VTDEC) was required to develop an EJ policy as a part of the EPA's EJ 2020 Plan and Performance Agreement Plan (2016–2020). 40
This study, as part of this initiative, serves as a useful first step in characterizing EJ and toward the development of EJ policy in Vermont.
In this study, we first constructed a Vermont Environmental Disparity Index (VTEDI) at the census tract level to identify cumulative impacts from social, health, and environmental risk factors in Vermont. Furthermore, we applied a Bayesian weight of evidence (WoE) method to explore the relative likelihood of association between social vulnerability variables (poverty, food stamp use, race, and limited English proficiency [LEP]) and environmental risks. To our knowledge, this is the first application of spatial Bayesian weight of evidence to explore the likelihood of environmental disparities. Bayesian methods offer better performance and more flexibility compared with conventional regression analysis. 41 Instead of showing a linear relationship, Bayesian methods show the probabilistic associations between categorical variables, and it is more sensitive to detect nuanced associations between categories. 44
Methods
Vermont Environmental Disparity Index
The VTEDI was constructed at the census tract level using the following three categories of indicators: social vulnerability, environmental risks, and health risk factors (Fig. 1). The social vulnerability indicators included 16 socioeconomic variables from the Vermont Department of Health (VDH)'s Social Vulnerability Index 42 and two variables related to food access (grocery store access and usage of food stamps) (Table 1). Indicators of environmental risks included traffic noise, air pollution, polluting sites (a total count of brownfields and hazardous waste sites, landfills, and Superfund sites), impaired surface waters, lead in school drinking water, flood risk, and heat vulnerability (Table 1). Environmental risks may worsen health outcomes (e.g., increased lung disease and cardiovascular disease), 43 and the preexisting health conditions may increase susceptibility to environmental risks. The health risk factors included in the analysis were obesity, lung disease, cardiovascular disease, cancer, and diabetes (Table 1). The data collection of this study was approved by the Institutional Review Board (IRB) of the University of Vermont.
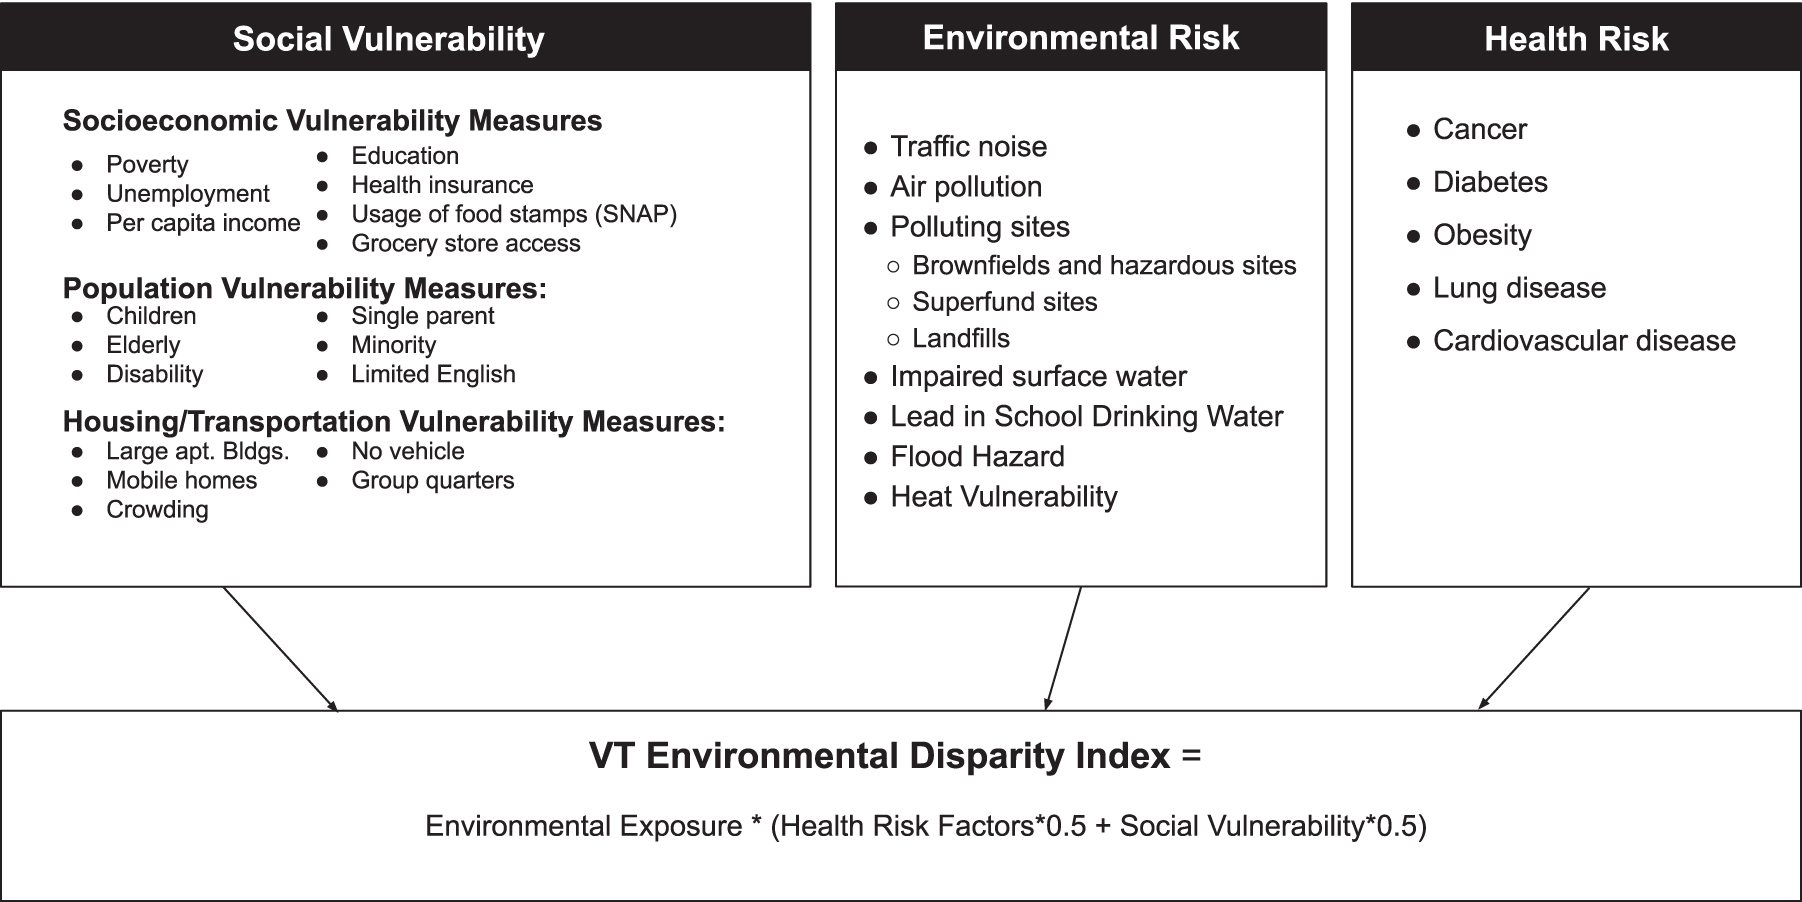
The composition of the environmental disparity index.
Variable Definitions and Data Sources of the Environmental Disparity Index
BRFSS, Behavioral Risk Factor Surveillance System; EPA, Environmental Protection Agency; NATA, National Air Toxics Assessment; FEMA, Federal Emergency Management Agency; SNAP, Supplemental Nutrition Assistance Program; SVI, social vulnerability index; VDH, Vermont Department of Health.
The environmental variables were selected largely based on data availability of the known environmental risks monitored by the federal and state agencies. We held multiple meetings with staff members from the VTDEC and VDH, where they offered assistance and consultation on identifying and acquiring the most up-to-date data.
Census tracts were the primary unit of analysis as most of the spatial data used were available at that level. Some data sources had different units or formats (e.g., town, point) and were transformed to or aggregated by the census tract. For every tract, each indicator variable was normalized using the percentile rank, and the average percentiles were calculated among multiple variables within each of the three categories of indicators (environmental risk, health risk, and social vulnerability). (We chose percentile rank as the normalization method because the goal was to show the relative index rankings of the census tracts instead of the actual severity of the accumulative risk.) The average percentiles were normalized again with percentile ranks.
To accentuate the importance of environmental risks in the final score, we adjusted the weights of social vulnerability and health risk by 50% and took a sum of the two. The final environmental disparity index value was calculated by taking the product of the normalized average percentiles of environmental risk and the weighted sum of social vulnerability and health risk (equation shown at the bottom of Fig. 1). The index scores were mapped across all the census tracts in Vermont, using a color scheme reflecting the quartiles of the index score.
There were two reasons for using a categorical color scheme instead of continuous color visualization. First, we wanted to use quartiles to help the state agencies to identify key areas of concern. Second, the weight of evidence analysis that we conducted required categorization of the index score (see the section on “Weight of Evidence calculation” below). We also weighted the final index with general population density and population density of people of color.
Data organization and calculation of the percentile ranks were conducted in MS Excel 2010. All variables and the final VTEDI were mapped in ArcGIS Pro. The final map layers were made available through a web app in ArcGIS Online. 44
Weight of evidence calculation
We explored the spatial probabilities correlating social vulnerability variables with environmental risks (Fig. 2) using a Bayesian weight of evidence (WoE) approach. 45 WoE coefficients quantify the likelihood, negative or positive, of exposure to environmental risks related to each socioeconomic variable in discrete intervals (e.g., poverty quantiles); the total likelihood of one environmental risk is the sum of all likelihoods. For example, one range of observed poverty levels may have a high likelihood of environmental risks, whereas another range may have a low likelihood. We ran the WoE analysis for the average environmental risk and for each of the environmental risks included in VTEDI.

The analysis approach for calculating weight of evidence in Dinamica-EGO. See column 3 in Table 1 for types of data (e.g., raster or vector) and processing method for the layers used in this model.
We used a free spatial modeling platform, Dinamica-EGO, following a documented methodology for WoE. 46 The Dinamica-EGO WoE method relates an event (e.g., deforestation) to spatial correlates (e.g., land cover type). We considered only one point in time, and so, we mimicked a change by assuming everywhere had a low exposure level to the environmental risks (<25th percentile) that changed in a single time step to the observed environmental risk, creating a so-called environmental risk transition map. WoE requires raster forms of discrete, categorical data (not continuous variables), and so, input data were converted from polygon to raster and categorized based on quartiles in ArcGIS Pro.
WoE calculation requires the input explanatory variables (social vulnerability variables) to be independent. 47 Cramer's coefficient is a measure of association between pairs of input variables based on χ 2 values, where 0 is no association and 1 means completely covary. Based on previous works, we created a rule to exclude explanatory variables that had a Cramer's coefficient >0.4 with other variables.49, 48 ,49 Pairwise tests among social vulnerability variables showed that per capita income was correlated (Cramer's coefficients >0.4) with several other variables, and so, this variable was excluded. The remaining four explanatory variables satisfied the assumption of spatial independence (see Supplementary Table S2 for the values of the Cramer pairs).
In a WoE analysis, the Contrast values measure the strength of association between an explanatory variable (e.g., poverty) and a given transition (e.g., environmental risk). 50 A Contrast is the range of WoE coefficient values for a single variable; all our social vulnerability variables had discrete categories (e.g., <25 percentile) and the Contrast is the total range of WoE correlation values (i.e., positive values minus negative values). 52 Calculated for each variable, the WoE Contrast indicates a positive or negative association with environmental risk and a sense of the strength of the association (e.g., greater Contrast is a stronger association).
Results
Spatial distribution of environmental risks
Figure 3 shows the average environmental risk of all census tracts in Vermont. The shades of the tracts indicate the average percentile ranks of all the environmental risk variables. The high environmental risk tracts are concentrated in several regions, including the Burlington metropolitan area (Chittenden, Franklin, and Grand Isle Counties), Washington County, and central Rutland County. High environmental risk census tracts are also found in parts of the Caledonia, Orange, and Bennington Counties, as well as along the Connecticut River Valley in Windsor and Windham Counties. The maps that show average social vulnerability and health risk are included in Supplementary Figs. S1 and S2.

Average environmental risk based on the variables included in the study.
Weight of evidence association between environmental risk and socioeconomic variables
The WoE Contrast values reveal differences in environmental risk relative to social vulnerability variables (Fig. 4). The relationship between variables was not entirely linear, but some observable patterns emerged. Areas with the fewest minority residents (Fig. 4a, leftmost bars) are negatively associated with high environmental risks or a low likelihood of exposure. With increasing minority populations, the likelihood of high environmental risks increased, particularly in the highest quartile of minority population proportion (rightmost bar in Fig. 4a). Areas with the fewest LEP residents are associated with less average environmental risk, and the increasing presence of LEP residents was positively associated with the likelihood of environmental risks.

Weight coefficients contrast of the four explanatory variables (minority population
Areas with the lowest poverty were positively associated with high environmental risks, and higher poverty levels were negatively associated with high environmental risks (Fig. 4c). The lowest usage of food stamps is positively related to high environmental risks, and the highest usage of food stamps was negatively associated with environmental risks (Fig. 4d; note third quartile not statistically significant). The patterns of high poverty and food stamp use were not associated with high environmental risks.
The associations between the explanatory population characteristics and individual types of environmental risks show varied patterns. Table 2 summarizes these patterns of associations. The corresponding bar graphs of WoE Contrast are included in Supplementary Figs. S3–S9.
Association Trends Between Explanatory Population Variables and Individual Environmental Risks
As seen in Table 2, air pollution, polluting sites, and heat vulnerability have some similar patterns with the average environmental risk. The tracts that have more minority (nonwhite) and LEP residents are more likely to have higher exposure to poor air quality (Supplementary Fig. S3a, b) and more polluting sites (Supplementary Fig. S4a, b), and are more vulnerable to rising temperatures (Supplementary Fig. S5a, b, d). Conversely, tracts with high levels of poverty and usage of food stamps (also related to low income) were negatively associated with and less likely to be exposed to air pollution (Supplementary Fig. S3c, d) and polluting sites (Supplementary Fig. S4c, d). However, tracts with high food stamp users were also significantly more vulnerable to heat. Tracts with the highest poverty levels were significantly associated with high levels of lead in school drinking water (Supplementary Fig. S6).
Contrary to the assumptions, this analysis did not show a positive association of flood risk and impaired water with poverty and food stamp use. Tracts with high poverty and food stamp use were less likely to be exposed to flooding and impaired surface water (Supplementary Figs. S7 and S8). Traffic noise did not show clear association patterns with the explanatory variables (Supplementary Fig. S9).
VTEDI: spatial distribution of cumulative impacts
Figure 5 shows the spatial distribution of cumulative impacts of environmental, social, and health risks in Vermont. As seen in the map, several areas in the state have a high range of cumulative impacts from environmental, health, and social burdens. The darkest census tracts in the map represent the fourth quartile of the VTEDI score. The Burlington metropolitan area, including western Franklin County and western and central Chittenden County, contains several high cumulative risk tracts. Four census tracts in the Caledonia County in the northeast area are in the fourth index quartile. In central Vermont, some census tracts in Washington and Orange Counties are in the highest risk group. For the southern part of the state, several census tracts in the Rutland County and southern and eastern Windsor County are among the high-risk areas.
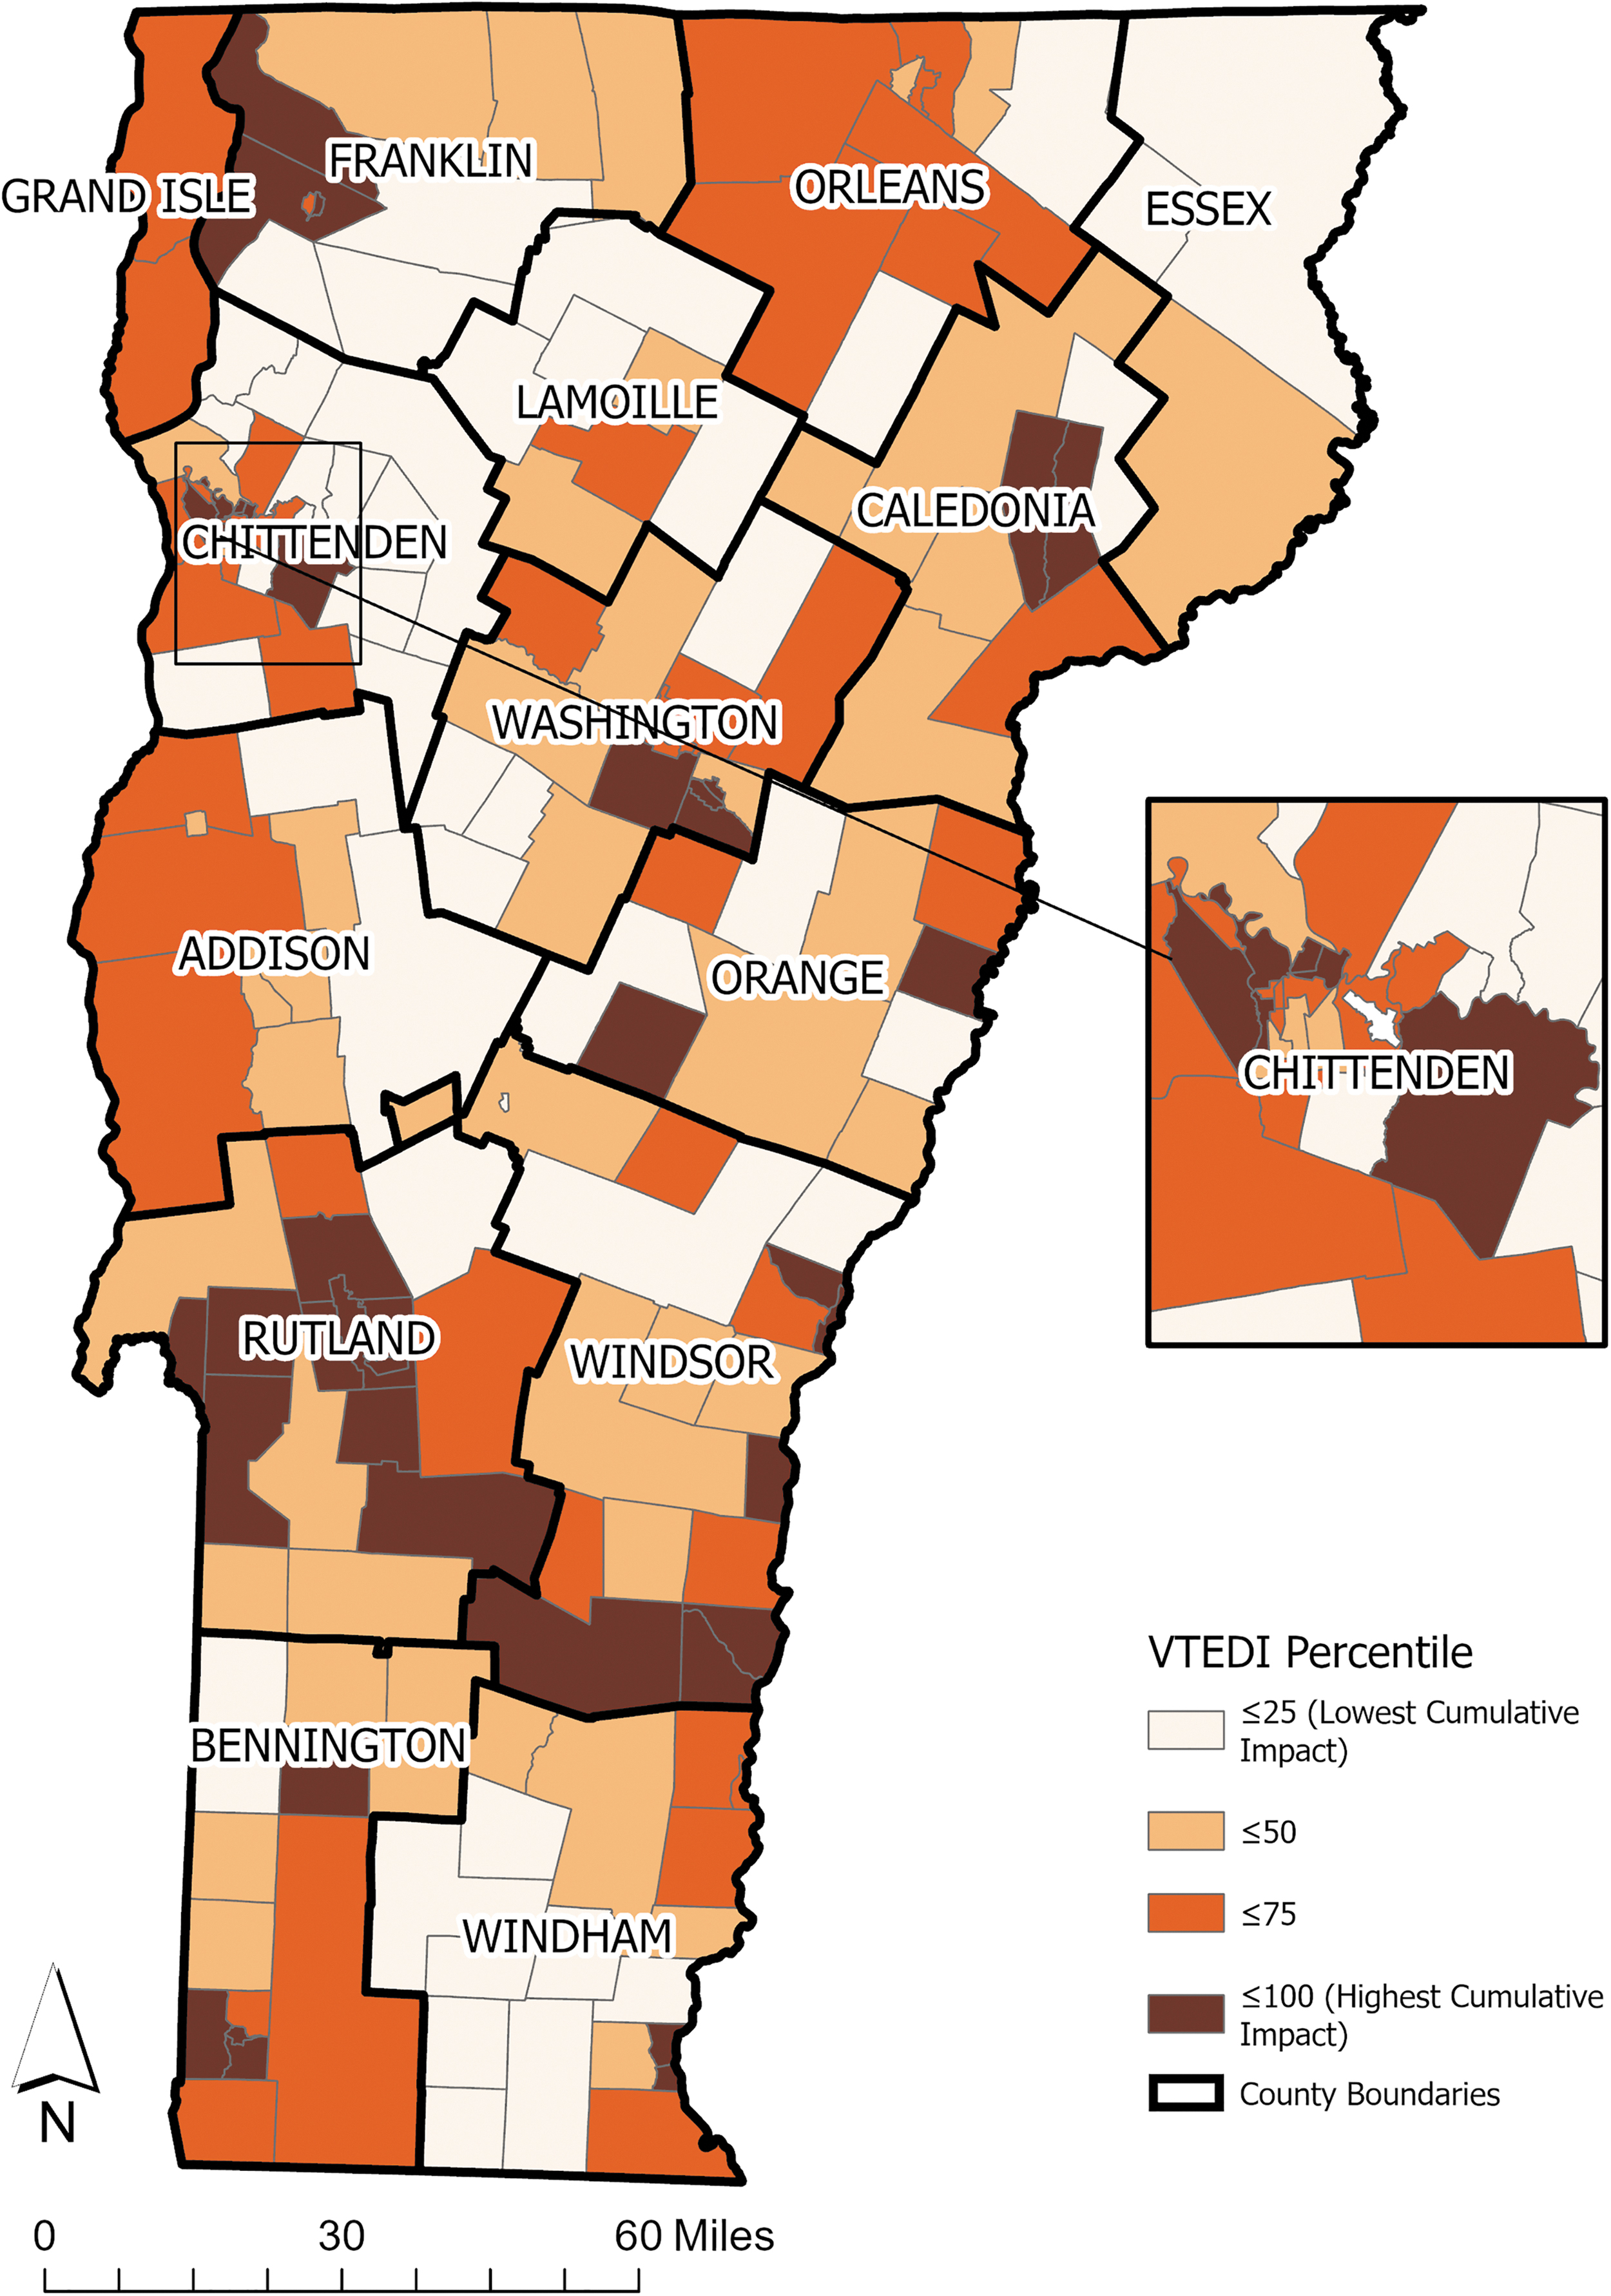
The VTEDI map. VTEDI, Vermont Environmental Disparity Index.
A small number of census tracts in southern Bennington and Windham County also have the highest cumulative impact. The spatial pattern is largely similar to the distribution of environmental risk shown in Figure 3.
Table 3 shows the normalized average percentiles of social vulnerability, health risk, and environmental risks of the tracts in these seven regions that have the highest VTEDI scores (the fourth quartile). The orange shades indicate the higher percentile ranks. As seen in the table, the burdens of the three categories varied from tract to tract in these regions. Some had higher social vulnerability (first row) and health burden (second row), whereas others had higher environmental risks. Attention should be paid to the areas that have risks running across the social, environmental, and health factors. These highest risk tracts are mostly found in Bennington and Rutland Counties.
Social Vulnerability, Health Risk, and Environmental Risk Scores of Vermont Census Tracts in the Fourth Quartile of Vermont Environmental Disparity Index
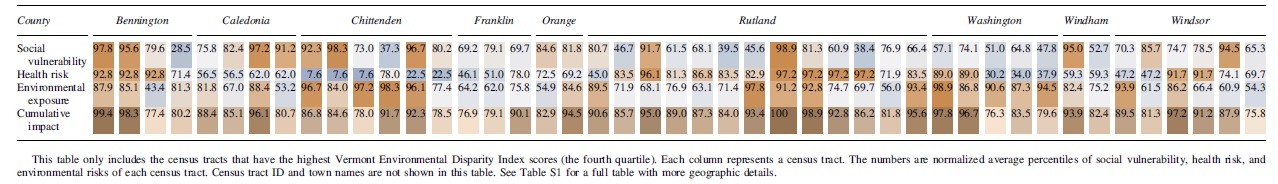
Figure 6 shows the VTEDI weighted by general population density and density of people of color. The patterns are generally similar to the original index, but the ranges of the census tracts in the highest quartile are smaller. These results will help policymakers to identify priority communities when allocating resources to benefit the maximum number of the general population or people of color.

VTEDI
Discussion
Association between demographic variables and environmental risk
Our WoE modeling results show that there is a high degree of association between populations of minority/LEP and environmental risk, especially air pollution, polluting sites, and heat vulnerability. This association is consistent with the findings from many previous spatial studies on EJ that have demonstrated disproportionate exposures to environmental risks by race.41, 51 ,52 Such a correlation has been overlooked in Vermont due to the lower proportion of minority population in the state. This study demonstrates that regardless of the stature of the state as an environmentally progressive state, the 5% of its nonwhite population in the state still bears higher environmental risks, some of which are historical environmental burdens such as long-term polluting sites. The smaller minority population in Vermont can sometimes lead to the misconception that the issues facing these communities are not prominent.
Some EJ literature has identified a positive correlation between low income/poverty and environmental vulnerability.29,41, 53 Our study, however, did not find such a general correlation. In the analysis, the overlap between high minority communities and low-income communities was also low. Several factors can likely explain this result. In Vermont, poverty is higher in rural areas where environmental risks are lower. For example, some census tracts in the rural north and northeast are in the high poverty range, where historical environmental risks stemming from polluting sites and air toxins are relatively low. However, other studies in Vermont have shown lower access to environmental benefits to the rural poor as well as the Black, Indigenous, and People of Color (BIPOC) communities in Vermont. 54 This pronounces the increased risk faced by communities of color in the state from both historic environmental risks and a lack of access to environmental benefits.
Also, tracts with higher nonwhite populations are largely concentrated in the peripheries of urban areas. While we did not find a positive correlation between race and poverty in this study, it should not be interpreted that nonwhite populations are economically better off than white populations in the state. It could be that poverty within these racially diverse tracts is not easily visible, as parts of the population within the tract have higher incomes. An analysis at a finer scale may be needed to uncover these dynamics. The data resolution is one of the limitations of this study.
The sociodemographic and environmental risks data used in the study are available at the census tract level, and the health data are available only at a subcounty level, which limits the possibilities of examining correlations between health risks and environmental/social risks. Also, data on access to environmental benefits are not available at the census tract level to enumerate distributional inequities stemming from both environmental risks and access to environmental benefits.
The implications of VTEDI
The VTEDI scores generated by this study indicate that several regions in Vermont have higher environmental risks and social/health vulnerability. Among these high-risk regions, some tracts in the Bennington and Rutland Counties have high scores across social vulnerability, health risk, and environmental risk. Higher percentile ranks in social vulnerability and environmental risk are seen in the Chittenden, Caledonia, Windham, and Orange Counties. Higher percentile ranks in health vulnerability and environmental risk are observed in several tracts of the Rutland, Bennington, Washington, and Windsor Counties. These tracts are particularly vulnerable on the environmental disparity scale due to the cumulative impacts.
In the Chittenden County, Vermont's largest population center, the social vulnerability and environmental risks are high, whereas the health risk is in the medium to low range. Some of the high index score areas have higher levels of social vulnerability and health risk and moderate levels of environmental risk (such as in some tracts of the Caledonia, Rutland, and Windsor Counties). Despite the moderate ranking of environmental risks, these areas are still sensitive to the cumulative impacts of social, health, and environmental factors.
Based on the results, it is observable that the degrees of impact of the three indicator categories of the VTEDI score, environmental risk, social vulnerability, and health risk, differ from region to region. While the VTEDI score serves as a broad measure for the combined effect of the three categories of social, health, and environmental indicators, further analysis is required to understand specific correlations between certain pairs of variables.
One approach to maximize the benefit of limited resources is to use the index results weighted by population density and density of people of color. The results in Figure 6b will help policymakers to identify priority communities when allocating resources to benefit the maximum number of the general population. Since our WoE analysis shows that people of color are more vulnerable to higher environmental risks, results in Figure 6c will be useful to identify communities that have both high percentage of people of color and high cumulative impact.
Approach to developing an EJ mapping tool
Environmental mapping tools are increasingly being used to inform state-based environmental decision making and governance.24,40,41,42 According to the research done by the Environmental Resilience Institute, around 17 states use EJ mapping tools to identify environmentally disadvantaged communities and to inform environmental decision and policy making and resource allocation. 55
This project is carried out in collaboration with VTDEC and the VDH. Staff members from these state agencies have offered assistance and consultation on data acquisition and the possible usage of the mapping tool. An environmental mapping tool such as this one can have multiple applications. We have used the preliminary results of the spatial analysis to guide efforts in conducting more focused, in-depth studies, including door-to-door surveys and interviews in specific disadvantaged regions. 56 ,57 The spatial data have also been used in some community meetings to initiate discussions on EJ. 58
The results from the project have also informed short- and long-form bills proposed to the state to establish the Green Justice zones that prioritize funding to communities suffering the most environmental and health disparities. 59 This EJ mapping tool will also be an integral component of the EJ policy bill being developed in Vermont to ensure that policies and practices of state agencies do not unfairly burden low-income communities and communities of color. More data layers and program-specific maps could be added in the future to make VTEDI more useful in facilitating the decision making of state agencies.
Through this project, we have demonstrated the functionality of such a tool in identifying communities with the most cumulative impacts from environmental, social, and health risks, interpreting specific correlations between sociodemographic variables and environmental risks, and informing the state's environmental decision making and policy making. With specific additional data layers and community-engaged mapping, it could also be used to identify the distribution of environmental risks and benefits, institute political accountability in decision making and resource allocation, and inform siting, permitting, and remediation. It could also facilitate the ongoing monitoring and analysis of pollution reduction, making the process relevant to addressing the needs of the communities.
Conclusion
In this study, we constructed a composite index, VTEDI, to measure the cumulative impacts of social vulnerability, environmental risks, and health risks in Vermont. Several regions with high vulnerability and their risk characteristics were identified. Using weight of evidence, a Bayesian method, we also explored the probabilistic associations between four explanatory sociodemographic variables and exposure to seven types of environmental risks. The results indicate that tracts with more nonwhite and LEP residents are exposed to higher environmental risks. The associations between poverty or food stamp use and environmental risks are relatively insignificant. This may indicate that food stamp use is not as prevalent in communities of color and public assistance funds are more utilized in the rural areas in the state.
VTEDI provides a foundation for building spatial tools that can be utilized to connect state agencies and policymakers so that environmental policy making can benefit and empower environmentally and socially vulnerable communities. Future possibilities include holding interagency conversations to identify methods to host and maintain the index and map, adding program-specific data to explore particular patterns of disparities that will inform decision making, and organizing community meetings and community-engaged mapping in high-risk areas to include residents' voices in mitigating risks and policy making.
Footnotes
Authors' Contributions
The authors of this article meet all of the following criteria of authorship defined by the International Committee of Medical Journal Editors: substantial contributions to the conception or design of the work; or the acquisition, analysis, or interpretation of data for the work. Drafting the work or revising it critically for important intellectual content. Final approval of the version to be published; and agreement to be accountable for all aspects of the work in ensuring that questions related to the accuracy or integrity of any part of the work are appropriately investigated and resolved.
Author Disclosure Statement
No competing financial interests exist.
Funding Information
This research is supported by the Lintilhac Foundation and James Jeffords Fund from the University of Vermont.
Supplementary Material
Please find the following supplemental material available below.
For Open Access articles published under a Creative Commons License, all supplemental material carries the same license as the article it is associated with.
For non-Open Access articles published, all supplemental material carries a non-exclusive license, and permission requests for re-use of supplemental material or any part of supplemental material shall be sent directly to the copyright owner as specified in the copyright notice associated with the article.