
Abstract
Green spaces are integral components of urban environments, as they provide numerous health benefits to people. However, urban green spaces are often inequitably distributed. Understanding the relationship between green space access and socioeconomic status is critical for identifying and eliminating environmental injustices. This study utilized Geographic Information Systems to examine the relationship between green space accessibility and racial groups in Binghamton, New York, a small city with known socioeconomic disparities and public health concerns. Using network analysis to measure distances of census blocks from green spaces, we found that most neighborhoods, regardless of overall minority composition, have equitable access to green spaces when considering all green spaces. However, when increasing the minimum threshold to 5000 m 2 green spaces, the standard used by the World Health Organization to define high-quality green space, we found that low-Asian census blocks have significantly less access to green spaces, whereas high-Hispanic blocks have relatively greater access to green space. This underscores the importance of considering each racial category separately rather than lumping people of color into a single category, which is common practice in studies of social inequity. Our results highlight disparities between access to green space across different racial groups in a small-sized American city and can be used by urban planners to inform future initiatives that value social equity.
Introduction
Interest in environmental justice stems from an understanding that environmental burdens often disproportionately affect racial minority and low-income populations. 1 , 2 Wealthier populations often gain from social privileges in the form of better access to environmental amenities and their associated benefits. 3 Of particular interest are the benefits associated with green spaces, which have demonstrated important psychological, economic, social, and cultural benefits. 4 Due to the many benefits provided by green spaces to human populations, researchers have become increasingly concerned with the social implications of inequitable access to these areas.
Urban green spaces provide valuable ecosystem services for people living in cities. Studies have shown that these areas can facilitate physical activity, provide clean air, and help increase cooling, among other benefits. 5 , 6 Urban parks specifically have demonstrated a moderate-to-high air filtration capacity 7 and have been shown to mitigate the negative effects associated with the urban heat island effect by providing shade and surface cooling. 8 Access to quality green space also contributes to better physical and mental health outcomes. For example, regular interactions with green space can reduce depression, anxiety, obesity, diabetes, and cardiovascular-related illness. 9 Green spaces have also been shown to encourage nearby residents to be more physically active, resulting in improved mental and cardiovascular health. 10 The presence of green spaces in urban environments has also been shown to encourage positive social interactions that can improve interpersonal dynamics and connectiveness among people. 11 Given the importance of green spaces for human health, urban planners and government officials should work to ensure all residents have equal access to these areas.
Inequitable access to green space has long been considered an environmental justice issue in the United States. For example, racist redlining policies of the 1930s and 1940s in the United States have resulted in less green space access in more than 100 studied urban metropolitan areas today. 12 However, the nature of the relationship between socioeconomic status and access to green space has been shown to vary depending on context (e.g., geographical region, type and quality of green space considered). 13 Several studies that have examined green space distribution in cities have found that minorities, citizens of lower socioeconomic levels, and less educated populations have limited access to green space (both in terms of quantity and quality) and their associated benefits. 14 , 15 , 16 , 17 Given that these social groups often suffer from higher rates of health issues, 18 these communities stand to benefit the most from access to these resources. 9 For example, McEachan et al. 19 found that higher residential greenness was associated with a reduced likelihood of depressive symptoms, with larger effects on disadvantaged groups—such as minority populations and individuals with less education. Additionally, Maas et al. 20 demonstrated that the percentage of green space in people's living environment has a significant relation to perceived general health of residents, with a stronger association for lower socioeconomic groups. However, two recent reviews highlight the complexity of the issue: while low-income and racial–ethnic minority people experience inequities in urban green space quantity and quality (e.g., number of amenities, maintenance, youth programs, safety levels), there are often no clear differences for urban green space proximity (distance to the closest park) based on income or race–ethnicity. 21 , 22 Furthermore, although a majority of studies demonstrate an inequity, some studies report that minorities and low-income populations actually have greater access to green space in urban environments. 23 , 24 Equity considerations are also complexified by the modifying effect that gentrification might have on the relationship between green space and health, 25 as green gentrification is known to undermine access by contributing to physical and sociocultural displacement. 26 , 27
Research in race-related environmental justice aims to explain differences in the lived experiences of dominant (White) and marginalized (non-White) groups. To develop a complete understanding of these differences, it is necessary for researchers to accurately define populations, avoiding broadly lumping people of color into “minority” categories. Correctly categorizing populations can make it possible to understand the ways in which being a non-White person impacts an individual's behavior and attitudes toward utilizing natural areas. 28 Often, studies that aim to identify environmental injustices surrounding green space access sort populations into either “white,” “minority,” or “black and minority” groups. 29 , 30 , 31 This can produce incorrect assumptions, generalizing across populations that are not similar other than in their lack of being White and failing to recognize the complexities of living as a minority in the United States. For example, several studies that assess access to green space by specific minority group have found that not all minority groups have similar access to green spaces in urban areas. 32 , 33 , 34 Different ethnic groups may face varying degrees of discrimination and violence in green space and nature, which also undermines the relationship that some minorities have with their neighborhood environment, and with parks in particular. 35 Therefore, it is imperative that current and future studies avoid broad characterizations and assess patterns for specific racial groups, which may differ in their proximity to green space based either on income level14,15,16,17 or cultural preference. 36
Research regarding green space tends to focus on metropolises or is concerned with differences in access along a rural–urban gradient. When considering differences in green space access along this gradient, small cities are often overlooked. A recent study demonstrated what one would expect regarding green space access along an urban–rural gradient: poverty levels are positively associated with distances to parks and recreation areas in urban/suburban neighborhoods. 37 Interestingly though, the study found that the opposite is true in rural areas, with poverty levels negatively associated with distance to green space. 37 However, with rising societal inequities in the United States, it is important to investigate green space access within a context that considers cultural differences between large and small cities—not just between urban and rural populations. Small cities are known to operate differently than larger ones in terms of policy and political motivation, land management, and constituent opinion/voice. 38 The limited research on green space access that considers city size comes mostly from outside the United States, 39 whereas some characterize certain small American cities as “left behind” or even “forgotten”. 40 Indeed, a recent analysis of access to green space focused only on the 500 most populated cities in the United States, cities with an average population size of ∼200,000. 41 The current literature on the effects of natural areas on human health is severely biased toward large cities; despite nearly half of the global human population living in small cities (defined as <300,000 people 42 ), only 3% of small cities have been studied, compared with 85% of large cities worldwide. 43 Working-class and minority residents of small cities may face additional hurdles to overcome in accessing green space, such as inadequate access to public transportation. 44 Furthermore, globalization has resulted in the formation of “global cities,” which serve as economic and manufacturing centers and draw in people from surrounding areas. This has resulted in the shrinkage of populations and a resulting demise of entrepreneurship, innovation, and intellectual engagement in many small American cities. 45 To be able to generalize trends in green space access based on socioeconomic status of an urban population, research in small American cities requires further investigation.
With the inconsistencies from previous studies regarding the relationship between socioeconomic status and green space access, more case studies are needed. Binghamton, located in Broome County, New York, is a city of around 45,000 inhabitants, has nearly a third of its population living below the poverty line, and residents experience relatively high rates of asthma morbidity and cardiovascular disease-related deaths in addition to higher overall rates of premature death relative to the rest of New York State (146.9 compared with 99.1 per 100,000 people). 46 , 47 In this study, we utilized Geographic Information Systems (GIS) tools to analyze the distribution of green spaces in Binghamton, New York, in relation to the socioeconomic standing of its residents. Information from this study will be critical for advising future initiatives that address disparities in quality green space access in cities with high levels of poverty and public health concerns.
Methods
Study area
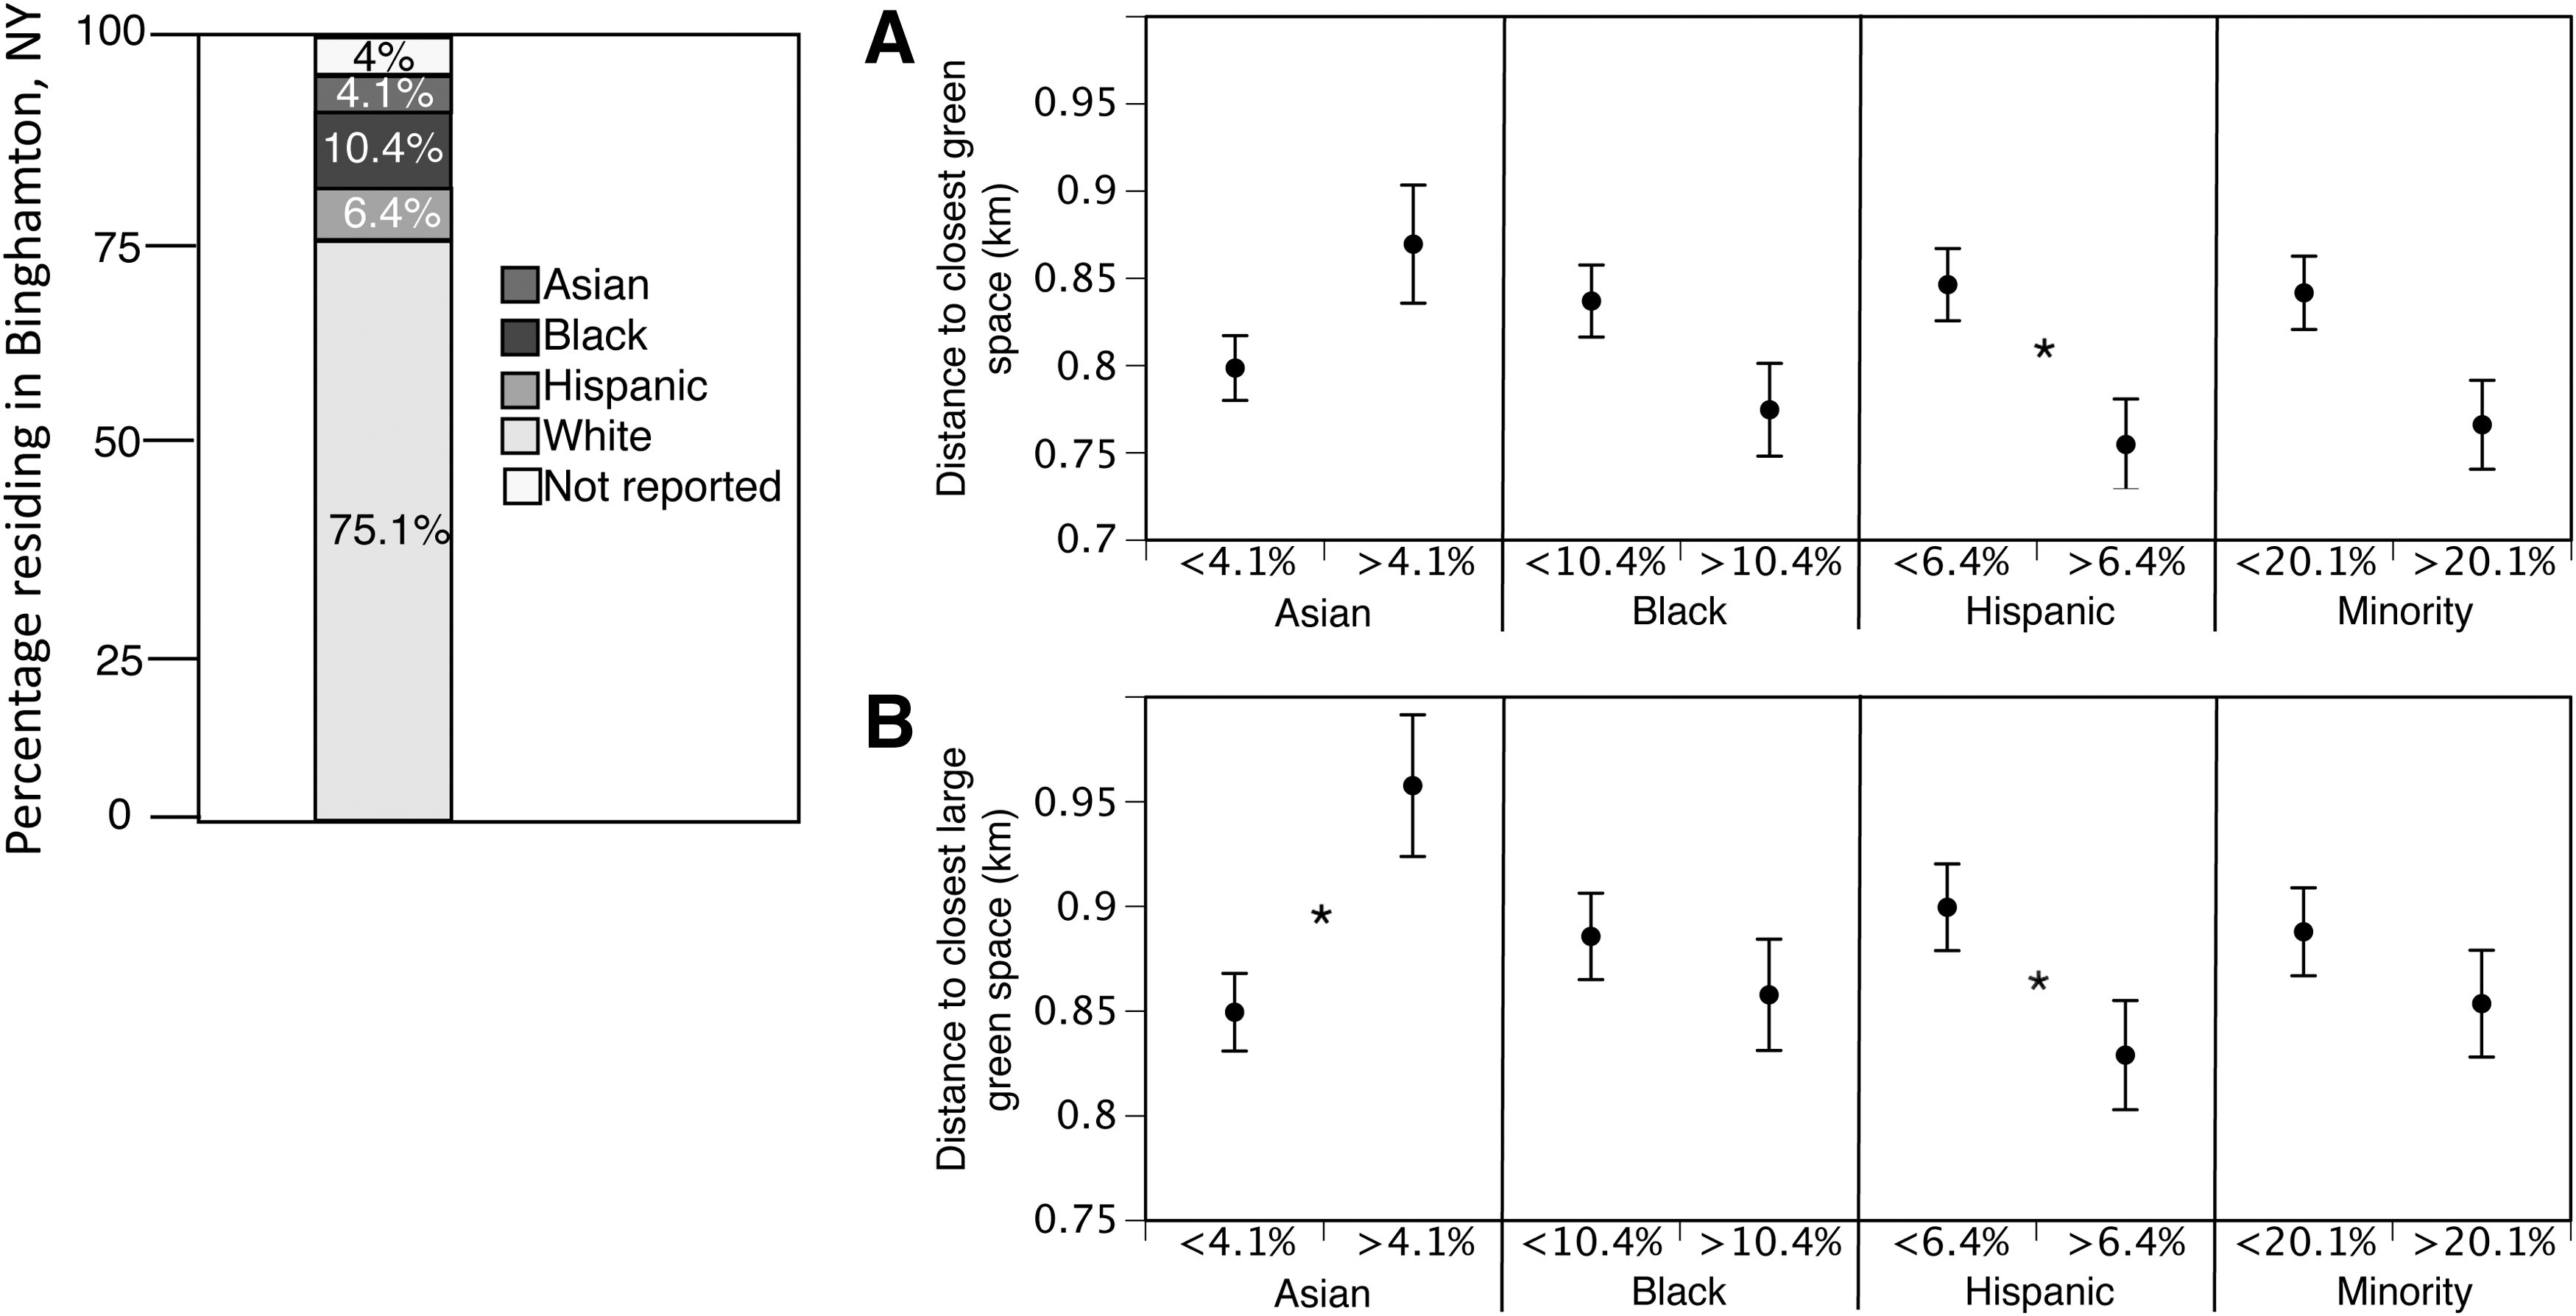
The City of Binghamton was selected as the location for this case study largely because of its demographic makeup. The area has a relatively high amount of people living below the poverty line, but concurrently has affluent areas, and thus an economic divide; neighborhoods are noticeably separated according to socioeconomic status. Moreover, Binghamton's relatively high rates of asthma and cardiovascular disease-related deaths as well as overall rates of premature death compared with the rest of New York State make this area of great interest when it comes to the health benefits of green space distribution. Additionally, as with many de-industrialized cities in the Rust Belt area of the United States, the area has lost population and has the unique potential to address any found inequities in green space distribution by targeting blighted properties. In Binghamton, 4.1%, 10.4%, and 6.4% of the population identify as Asian, Black, or Hispanic, respectively. 46
Geographic information systems
We used Broome County's GIS portal to access Binghamton's pre-existing “Parks and Recreation” data to map green space distribution in the city. We then layered the socioeconomic data over green space locations to look for disparities based on socioeconomic status. We used network analysis to determine the average driving distance from every census block to the closest park and recreation area in the City of Binghamton, categorized by varying minority concentrations.
Census data were collected from each housing unit. The smallest area (largest scale) that census data is released is at the Block level, which are geographic areas bound by physical features such as roads and water bodies. There are 934 census blocks within the City of Binghamton. The network analysis requires point locations to run accurately; since blocks needed to act as the origin of each trip, the centroid of each block was determined. This, in effect, averaged the starting point for each household in the block.
There are 21 public recreation areas in the City of Binghamton composed of green space, including 16 that are larger than 5000 m
2
. These green spaces are distributed throughout all areas of the city with one or more parks in the southside, eastside, westside, northside, and downtown. The 16 larger green spaces represent 2.5% of the total land area of the city. As with census blocks, a point location needed to be determined for each recreation area. This was accomplished by manually creating point locations using Google Earth, where pedestrians had access to enter the park. These were either road entrances or parking lots. Once the origins (census block centroids) and destinations (recreation area access points) were set up, the network analysis was run using ArcGIS Pro 2.6.2. Specifically, the closest facility solver was used. This tool measures the cost of traveling between origins and destinations and determines which are nearest to one another. The tool leverages the Dijkstra algorithm, which solves the single-source, shortest-path problem on a weighted graph. The algorithm states that to find the shortest path from a starting location
Statistical analysis
To understand how racial background influences access to green space, we first determined patterns of representation in Binghamton by calculating the total percentage of individuals identifying as Asian, Black, or Hispanic reported in the previous census. As previously stated, in Binghamton, 4.1%, 10.4%, and 6.4% of the population identify as Asian, Black, or Hispanic, respectively (Fig. 1). 46 Next, we identified and grouped neighborhood blocks into two categories: (1) Blocks where Asians, Blacks, and Hispanics are underrepre- sented relative to the percent representation in Binghamton and (2) Blocks where Asians, Blacks, and Hispanics are overrepresented relative to the percent representation in Binghamton (Fig. 2). We then compared the average (A) distance to closest green space and (B) distance to closest large green space (i.e., >5000 m 2 ) for blocks where Asians, Blacks, Hispanics, or Minorities (non-white) were overrepresented versus blocks where they were underrepresented using separate analyses of variance (ANOVA). We chose to run separate analyses for each group because the different racial categories were differentially represented in Binghamton leading to different standards for under- versus overrepresentation (Table 1). We tested all assumptions of ANOVA. To support the ANOVA, we also conducted correlation analyses to test the hypothesis that neighborhood blocks with higher percentages of White members of the community would be negatively associated with (A) distance to closest green space and (B) distance to closest large green space. Finally, we employed multiple regression analysis to control for potential mediating relationships of other important independent variables. Specifically, we used multiple regression analysis to determine whether racial composition (percent Asian, Black, Hispanic, and White) or overall percent Minority predicted a census block's (A) distance to closest green space and (B) distance to closest large green space (i.e., >5000 m 2 ), while also controlling for the percentage of homeowners in each census block. We used home ownership status in our multiple regression as a proxy for income, as income data are not readily available at the block level through the census data; renting is generally associated with lower incomes in the United States 48 , 49

Distribution of different racial groups in relation to large public green spaces in Binghamton, New York.

Location of census blocks in relation to large green spaces in Binghamton, New York, for blocks with a lower percentage of Asians, Blacks, Hispanics, or all minorities relative to overall percentage of Asians, Blacks, Hispanics, or all minorities (white) versus blocks with a greater percentage of Asians, Blacks, Hispanics, or minorities relative to overall percentage of Asians, Blacks, Hispanics, or all minorities (black).
The Number of Blocks, of 670 Occupied in Binghamton, NY, That Contained Under- Versus Overrepresentation Relative to City Averages of Different Racial Groups
NY, New York.
Results
ANOVA results
Asian population
We found a marginally significant effect of representation on distance to closest green space (F1668 = 3.6; p = 0.059; Fig. 3). Neighborhood blocks with higher percentages of Asian residents were significantly further away from green space. Similarly, this pattern was exacerbated when we consider distance to closest large green space (F1668 = 8.2; p = 0.004).
Distance to closest large green space for
Black population
We found no significant effect of representation on distance to closest green space (F1668 = 3.3; p = 0.07; Fig. 3). Similarly, there was no effect of representation when we considered distance to closest large green space (F1668 = 0.7; p = 0.42).
Hispanic population
We found a significant effect of representation on distance to closest green space (F1668 = 4.3; p = 0.04; Fig. 3). Neighborhood blocks with higher percentages of Hispanic residents were significantly closer to green space compared with blocks with lower percentages of Hispanic residents. We found a similar significant effect when we considered distance to closest large green space (F1668 = 4.1; p = 0.04).
Minority (non-white) population
We found no significant effect of representation on distance to closest green space (F1668 = 2.5; p = 0.12; Fig. 3). Similarly, there was no effect of representation when we considered distance to closest large green space (F1668 = 0.2; p = 0.7) (Fig. 2).
Correlation results
Asian population
We found a marginally significant positive relationship between the distance to closest green space and percent Asian representation (r = 0.06; p = 0.054). We found a significant positive relationship between the distance to closest large green space and percent Asian representation (r = 0.07; p = 0.03).
Black population
We found no relationship between the distance to closest green space and percent Black representation (r = −0.03; p = 0.22). We found no relationship between the distance to closest large green space and percent Black representation (r = 0.004; p = 0.46).
Hispanic population
We found a significant negative relationship between the distance to closest green space and percent Hispanic representation (r = −0.13; p < 0.001). We found a similar significant negative relationship between the distance to closest large green space and percent Hispanic representation (r = −0.114; p = 0.002).
Minority (non-white) population
We found no relationship between the distance to closest green space and percent non-white representation (r = −0.06; p = 0.064). We found no relationship between the distance to closest large green space and percent Minority representation (r = −0.02; p = 0.28).
Regression results
In all regression models, percent homeowner was a significant predictor of census block distance to green space (all p < 0.01). In our full models that included all racial categories (Asian, Black, Hispanic, and White), we found a significant positive relationship between the distance to closest green space and percent Asian representation (beta = 0.0077, p = 0.012; overall model R2 = 0.056), as well as a significant positive relationship between the distance to closest large green space and percent Asian representation (beta = 0.0062, p = 0.047; overall model R2 = 0.028); no other racial group, whether considered separately or lumped together as percent Minority, was found to significantly predict distance to green space (all p > 0.05), although Hispanic was the only racial group to exhibit a positive trend with distance to green space.
Discussion
We found that when minority groups are aggregated, there is no relationship between access to green space and minority composition by blocks in Binghamton, New York. However, when considering the individual minority groups, the pattern is not as clear; blocks with a greater percentage of Asians relative to their overall population in Binghamton live farther from green space than blocks with a below average percentage of Asians. Furthermore, blocks with a greater percentage of Hispanics relative to their overall population in Binghamton actually live closer to green space than blocks with below average percentages of Hispanics. Our study highlights the complexity of equitable access to green space in urban areas by showing variation in green space access across different racial groups.
The patterns we identified in Binghamton reflect similar trends in other studies where Asian populations tend to have less access to green space, whereas Hispanic populations tend to have greater access. For example, studies from Phoenix, Arizona 50 ; Atlanta, Georgia 32 ; Philadelphia, Pennsylvania 33 ; and Leicester, England, 34 all document Asian populations having the lowest public green space access. Despite this trend, it remains unclear exactly why Asian populations in these cities experience less access to green space. One pattern that may explain access disparities in the U.S. cities listed above is the relative size of the population to the other major minority groups (Black and Hispanic). Of these three minority populations in Binghamton, Atlanta, Philadelphia, and Phoenix, the Asian population is the smallest; low population density may simply mean that fewer individuals are likely to be found near areas of green space, particularly in suburbs where green spaces are more common and Whites are relatively more abundant. 51 Another factor that might contribute to the results is potential cultural differences in whether residents value living near green space. A study in Leicester demonstrated that Asian people avoided using public parks out of fear of racial attack. 36 This certainly explains differences in green space access, but other cultural preferences may require equity to be redefined in the context of green space access. 52 Furthermore, and similar to recent studies in several American cities, 37 we found that high-Hispanic blocks had greater access to green space compared with other ethnic groups. However, additional studies are needed to determine whether spatial access equates to “social access,” that is, whether parks are actually utilized by these groups. 53 Understanding public perception of green spaces, for example, are they considered “safe” spaces, by local residents across ethnic groups is critical toward understanding utilization and potential benefits of green space proximity. Qualitative metrics other than size may also be critical factors determining benefits of green space proximity; Moore et al., 54 for example, found that while Hispanics lived in closer proximity to green space overall, those green spaces had fewer recreational facilities and thus provided fewer benefits than those green spaces in predominantly White neighborhoods. The use of green space by Hispanic populations may be of critical importance for managing overall public health of a diverse community, as Hispanics are less likely to meet physical activity recommendations than Whites. 55 , 56 Finally, in addition to fear, societal rules and social norms can undermine the use of green space for racialized minorities; it cannot be assumed that the creation of green space, unassisted, will create more just cities. Rather, urban planners must better account for the needs, identities, and day-to-day lives of marginalized communities in the process of designing and implementing new green spaces. 27
Although consistent with the theme of inequitable distribution of green space, green space access issues for different racial populations often relate to green space quality and perception, rather than proximity. 57 , 58 , 59 In Los Angeles, minorities and low-income groups are likely to live near parks with higher potential for congestion, whereas White and affluent groups are likely to live closer to green spaces with lower potential park congestion. 58 Similarly, in Philadelphia, Black and Hispanic populations are more likely to live close to a public green space than White populations, but live in proximity to smaller, and subsequently lower quality, green spaces overall. 33 A study in Bristol, England, found that groups living in deprived areas (lower socioeconomic status) actually lived closer to green spaces than their more affluent counterparts, but reported poorer perceived safety, and less frequent use of those spaces. 59 Rigolon 22 determined that most inequality related to green space access exists for parameters of acreage and quality, not general proximity. For example, larger green spaces have been shown to more effectively reduce air temperature in urban environments, 60 , 61 providing a more comfortable environment for those with access to them. Access to relatively larger green space is also negatively correlated with feelings of anger, frustration, and aggression. 62 Larger (>5000 m 2 ) and thus higher quality green spaces are not equitably distributed in Binghamton across different racial groups and present an opportunity for local planners to address social injustice.
While there is often a disparity in the access to green space for lower income and minority groups, the literature demonstrates conflicting reports on overall equitable access to green space. What is unclear about these trends is exactly why differences in overall access to green space exist depending on the city. Some studies have found that level of education and income level have a stronger positive correlation with urban green space access than race, 63 , 64 suggesting that differences in city education budgets and wealth distribution contribute to the conflicting results presented in the literature on green space access. Additionally, recent spatial analyses of distributional green equity found that low population density may allow for more equitable distribution of urban vegetation, attributing green space access to the amount of land over which a city's population resides. 65 Another possible explanation for differences in access is paradoxical. While the creation of quality green space can make neighborhoods healthier and more attractive, it can also increase housing costs and property values, ultimately gentrifying a neighborhood and pushing out the very people it was meant to benefit. 21 Heynen et al. 66 showed that lower socioeconomic groups and minorities are often underserved in terms of receiving green space associated benefits as a result of increases in land privatization. However, the so-called “green gentrification” may be less relevant in small versus large cities, as it is generally associated with global flows of investment, resources, and branding. 26 More comprehensive studies are needed that analyze city characteristics that may contribute to inequities in green space use, such as political leadership and economic trends.
Our findings are crucial for broadly evaluating green space access based on demographics. Asians residing in Binghamton do not have equal access to these critical public goods and therefore do not benefit from access to green space to the same extent as other populations in Binghamton. Certain health problems, such as obesity, disproportionately affect lower income and minority groups. 67 Considering that green spaces have been shown to alleviate health issues in humans in various ways (e.g., promoting exercise to reduce obesity rates), 68 Binghamton's inequitable access to quality green space for its Asian populations represents a significant social justice issue. While it is important to recognize that many determinants of urban health are not remediable by landscape design and green space access, 14 improvements in this regard should be considered key components to developing a sustainable community for all residents.
Other policies to consider
Cities across the United States are implementing innovative policies to increase green space accessibility. For example, New York City, through the Community Parks Initiative, is investing in the most underresourced public parks across the city. Often these parks are situated in underprivileged communities, increasing access to quality green spaces for populations who have historically been underserved. The construction of a new park in a typically underserved neighborhood can result in positive change for the neighborhood in the short term, but a rise in the popularity of a neighborhood may increase rent prices for locals, and ultimately push them out. To combat this, project coordinators must consider the input and concerns of local leaders to create a space that safely benefits those who live in the community. By pursuing federal and state grants, along with private investments, the City of Binghamton may achieve similar successes. The Broome County Land Bank Corporation has begun this work by targeting distressed, vacant, abandoned, and foreclosed properties to foster community and economic development in Binghamton since 2013. 69 Future efforts should be placed on Binghamton's northside and first ward neighborhoods where dozens of properties remain vacant. Additionally, blighted areas and brownfields provide further opportunities to increase access to green spaces by building parks or community gardens. Other cities across the United States are leading by example; a study in Philadelphia found that minorities faced less access to overall square footage of green space within the city; to increase equity, the city is using vacant land to improve green space access. 30 These innovations and policies to address inequitable access to green space can act as references for Binghamton to use when implementing similar changes. The City of Binghamton could also improve and amend its Fair Housing and Equal Opportunity Plan, whose program goals are to assist underserved individuals in obtaining suitable housing accommodations of their choice. 70 Language could be added to this ordinance to protect minority populations from future green gentrification, such as ensuring equity evaluation for urban projects and rezoning of urban land to green space in underserved communities. 71 Furthermore, the City of Binghamton currently has no official definition or minimum standards for what is considered green space; the creation of clear expectations and standards for local green space will also help to achieve equitable access. Finally, several studies show that public education and public involvement in green space planning are integral components of successful urban planning operations. 72 , 73 , 74 To ensure the use of green space, the City of Binghamton should both survey its residents and engage in outreach efforts that ensure social access and use of green space is achieved, thus providing health benefits to all residents regardless of ethnicity.
Limitations and future opportunities
We suggest that this study can be expanded upon by analyzing other indicators of green space quality—such as type, vegetation height, plant coverage/quality, safety/accessibility of access routes, and specific recreation opportunities offered, which have demonstrated effects on play opportunities for children and urban ecosystem structure. 75 , 76 Social inequities can be observed within both disadvantaged and affluent neighborhoods when green space types are not considered, 77 highlighting the importance of future studies to consider not only green space in the broad sense but also the specific qualitative features they provide. Finally, while analyzing separate racial groups is a strength of this study, the racial groups used for U.S. census data are very broad. Specifically, there were five racial categories identified by census data: White, Black or African American, American Indian and Alaska Native, Asian, and Native Hawaiian and Other Pacific Islander. These categories are oversimplifications. For example, there are dozens of countries classified as Asian, yet most of these nations do not share common language, culture, religion, or history of immigration to the United States. 78 Therefore, additional work is needed that considers the cultural complexity, and reality, of minority community access to green space in American cities.
Conclusions
Green space is a crucial part of any urban ecosystem because of the many benefits that it provides to the environment and the communities that surround it. Regarding overall green space distribution, Binghamton lacks in opportunities for its Asian population, while providing more access to its Hispanic population relative to other minorities and Whites. Our findings suggest that city planners in Binghamton, as well as in other urban populations, have opportunities and obligations to eliminate social inequities and injustices related to green space access.
Footnotes
Authors' Contributions
All authors contributed significantly to the completion of this article. E.B.M., A.P.S., S.E.P., and G.A.M. contributed toward conception, design, analysis, and writing, while K.H. contributed toward analysis and writing.
Author Disclosure Statement
No competing financial interests exist.
Funding Information
No funding was received to support this research.