
Abstract
Background:
This study examines environmental justice (EJ) indicators in communities surrounding 165 prisons in 10 U.S. states, contributing to timely and critical discussions of both decarceration and EJ in smaller towns and rural areas of the United States.
Methods:
Environmental Protection Agency's Environmental Justice Screening and Mapping Tool (EJSCREEN) was used to characterize environmental burdens in communities surrounding state and federal prisons. Based on findings, brief case studies of five prison communities with multiple EJ concerns are presented.
Results:
Communities surrounding 40% of the prisons exceeded an 80th percentile threshold EJ Index for one indicator; nearly one-quarter exceeded this threshold for multiple EJ Indexes. The prisons tended to be in less-densely populated areas; only 4% of prisons in these 10 states were in cities. States with higher incarceration rates tended to have a greater number of elevated EJ Indexes for communities surrounding prisons.
Discussion:
Findings support the existence of many rural EJ communities, and a multitude of pollution sources may contribute to environmental conditions in communities surrounding prisons. Although EJ concerns impact a broad set of stakeholders, prison inmates represent a unique population: involuntary subjects of environmental burdens they are unable to escape during the period of their incarceration. Study findings are also discussed in the context of proposed actions under the Biden Administration's Justice40 Initiative.
Conclusion:
Intersectional approaches are needed to understand and solve complex problems. This study finds that rural communities, increasingly the sites of prisons, present EJ concerns worthy of further examination.
Introduction
In the United States, race, incarceration, and pollution are inextricably linked. The United States is in an era of heightened consciousness and public debate around mass incarceration and unequal imprisonment based on race. 1 Race is also associated with environmental pollution, itself an act of violence resulting in physical and psychological harm. 2 , 3 In addition to police violence and incarceration disproportionately directed toward people of color, 4 the siting of polluting facilities near low-income and non-white communities has been documented and studied for decades. 5
An oft-cited definition of environmental justice (EJ) comes from the U.S. Environmental Protection Agency (EPA): “Environmental justice is the fair treatment and meaningful involvement of all people regardless of race, color, national origin, or income, with respect to the development, implementation, and enforcement of environmental laws, regulations, and policies.” 6 Despite including “all people” in the definition, inmates in prisons are often “rendered invisible,” 7 left out of federal EJ policy, 8 and not meaningfully protected by state and federal environmental laws.
EJ is changing. The Biden Administration's Justice40 Initiative 9 includes actions to ensure that disadvantaged communities receive benefits of federal renewable energy investments. However, interim guidance on the Justice40 Initiative does not include prisoners or inmates in the definition of “disadvantaged communities,” 10 nor are rural communities explicitly included. Although improving environmental conditions for imprisoned people will not solve rural EJ issues, nor will improving rural EJ issues always benefit those imprisoned in rural areas, examining prison siting through an EJ lens is a useful approach to characterizing unequal environmental burdens in rural parts of the United States, as prisons are increasingly sited in rural areas, 11 , 12 , 13 particularly rural areas with marginalized populations. 14 , 15
In addition, EJ scholarship tends to focus on urban areas: a literature search in Web of Science will return 5–10 times the number of studies on urban EJ in comparison with rural EJ studies. The existence of rural communities with unequal environmental burdens is often overlooked, and EJ today is most associated with urban areas. 16
Inmates represent a uniquely affected population. Prisoners cannot escape poor environmental conditions in prisons, 17 , 18 , 19 outdoor activity occurs in areas stripped of natural resources for construction of the prison, 20 and even work opportunities such as electronic waste recycling can create dangerous conditions. 21 Even while depleted of many protections and freedoms during a prison sentence, inmates turn to jailhouse activism in an effort to protect themselves from contamination. 22 , 23
Data to study unequal environmental burdens in the United States are readily available. EPA's Environmental Justice Screening and Mapping Tool (EJSCREEN) accesses databases on environmental quality and data from the U.S. Census Bureau American Community Survey (ACS) to generate an EJ Index for a geographic area 24 :
The geographic area analyzed can range from a Census Block Group to a multi-mile radius around a facility of interest. The Demographic Index of an area is an average of the percent of the selected area comprising people of color and the percent of the area that is considered low-income population.
In addition to compiling ACS data to calculate the Demographic Index, EJSCREEN compiles data for 11 Environmental Indicators across multiple media: particulate matter (PM2.5 in μg/m 3 ), ozone (ppb), National-Scale Air Toxics Assessment (NATA) diesel PM (μg/m 3 ), NATA cancer risk (lifetime risk per million), NATA Respiratory Hazard Index, traffic proximity and volume (daily traffic count/distance to road), lead paint indicator (% pre-1960 housing), Superfund proximity (site count/km distance), Risk Management Plan (RMP) proximity (facility count/km distance), hazardous waste proximity (facility count/km distance), and wastewater discharge indicator (toxicity-weighted concentration/m distance).
These indicators are described in further detail in the EJSCREEN Technical Documentation. 25 In short, an EJ Index is intended to convey the concept of excess risk of a population to contamination in the selected area. EJ Index values are presented as a percentile that places the risk in the context of conditions across a state, EPA Region, or the United States. Output from a sample EJSCREEN report is presented in Table 1.
Excerpt of EJSCREEN Report for 3.2 km Ring Surrounding the Location of Ohio State Penitentiary
Data on environmental and demographic indicators
EJ, environmental justice; EPA, Environmental Protection Agency; NATA, National-Scale Air Toxics Assessment;
The EJ Index has also been described in several other studies that have used EJSCREEN as a tool to screen areas for potential EJ concerns. Among other uses, EJSCREEN has been integrated into a siting index for industrial facilities using solar energy, 26 used to assess EJ concerns in communities living on the border of large U.S. cities, 27 and for characterizing burdens on communities around U.S. ports. 28 EJSCREEN has also been used to study the association of air pollution with health outcomes related to rhinosinusitis 29 and COVID-19. 30
The objective of this article is to use prison siting as an anchor point to examine rural EJ issues that may affect both community members and the people incarcerated in rural prisons. This article presents the findings of a desktop EJ analysis of areas surrounding 165 prisons in 10 U.S. states spanning a range of incarceration rates. Using publicly available data in EJSCREEN, prison communities are characterized in terms of their demographic composition and environmental burdens as compared with other parts of their states.
This study contributes to the multifaceted field of green criminology and further expands EJ practice to address environmental burdens in a wider range of populations and geographies. This study presents opportunities to apply and expand on actions outlined in the Justice40 Initiative.
METHODS
Incarceration rates
Ten U.S. states with a range of incarceration rates were selected (Table 2). 31 Louisiana and Oklahoma had the highest incarceration rates, whereas Massachusetts and Maine represented states with the lowest incarceration rates. Other states were selected to represent the 50th percentile (Pennsylvania, Oregon), 25th percentile (Connecticut, Alaska), and 75th percentile (Ohio, South Dakota) of state incarceration rates.
Incarceration Rates (per 100,000 Population) in the 10 States Included in This Study
Data from the sentencing project.
AK, Alaska; CT, Connecticut; LA, Louisiana; MA, Massachusetts; ME, Maine; OH, Ohio; OK, Oklahoma; OR, Oregon; PA, Pennsylvania; SD, South Dakota.
Prison communities
A list of prisons under jurisdiction of state departments of corrections (DOCs) and the Federal Bureau of Prisons (BOP) 32 was compiled for a total of 165 prisons (Table 3). Most of the state facilities were for adult inmates. Inmate population data were also accessed through state DOC and Federal BOP reports. 33 Where state or federal data were not available, prison population was based on reports from Prison Policy Initiative. 34
Prisons Included in This Study
BOP, Bureau of Prisons; CC, Correctional Center; CF, Correctional Facility; CI, Correctional Institution; DOC, Department of Correction(s); DRC, Department of Rehabilitation and Correction; FCC, Federal Correctional Center; FCI, Federal Correctional Institute; FDC, Federal Detention Center; FMC, Federal Medical Center; FPC, Federal Prison Camp; FTC, Federal Transfer Center; SCI, State Correctional Institution; USP, U.S. Penitentiary.
Because there is variation in how states identify areas as cities and towns, 35 the degree of urbanization of the area surrounding each prison was determined using World Bank guidelines. 36 Areas were characterized as cities if population exceeded 50,000 and population density was >1500 people per km 2 (3886 per mi 2 ). The threshold for towns/semidense areas was a population >5000 and density of 300 people per km 2 (777 per mi 2 ). Rural areas had a lower population and lower population density than towns/semidense areas.
EJSCREEN data
EJSCREEN (Version 2020) reports 37 were produced for a 3.2 km radius (32.56 km 2 area) around each prison using the physical address of the facility or its coordinates. This is larger than the smallest, most accurate Census Block Group unit, 38 , 39 but larger than the standard 1.6 km radius (8.13 km 2 area) in EJSCREEN to ensure the population around the prison was included in calculation of the EJ Indexes. Other studies have similarly used a 2-mi radius. 40 , 41
Additional environmental data
Five of the 165 prisons in the study were examined in further detail; their case studies are presented in the Discussion section. Supplemental environmental data for communities surrounding these prisons was accessed through EPA's Toxics Release Inventory (TRI) (zip code level), 42 My Environment (using facility address), 43 Cleanups in My Community (using facility address), 44 and Integrated Compliance Information System (zip code level) 45 portals. Federal Emergency Management Agency (FEMA) Flood Insurance Rate Maps (FIRMettes) 46 were also created to identify flooding risk of these facilities. Google Maps were also used to identify industry and notable land uses around these five prisons.
Institutional Review Board (IRB) review was not required, as this work did not involve human subjects, personally identifiable information, or biospecimens.
RESULTS
EJSCREEN results
EJ Indexes equal to or exceeding the 80th percentile statewide were used as a screening threshold to highlight an area with potential EJ concerns. 47 If a specified geographic area has an EJ Index in the 80th percentile statewide, the environmental indicator is affecting the population in that area in a manner different than 80% of the state. Examination of the EJ Index calculation illustrates that an elevated EJ Index could be the result of high levels of pollution, demographics very different than the rest of the state, a large population in the selected area, or a combination of these factors. Therefore, an EJ Index at/above the 80th percentile statewide is an indicator that further examination of the environmental conditions and the population of the area is warranted.
Of the 165 prisons in this study, the area surrounding one prison (Goose Creek Correctional Center in Alaska) had no reported data in EJSCREEN. Of the remaining 164 prison areas with data in EJSCREEN, areas surrounding 66 of the prisons (40% of the prison communities) had single EJ Indexes at or over the 80th percentile stateside. Almost one-quarter (39/164, about 24%) of the prison communities exceeded 80th percentile EJ Indexes for a majority (6 of 11 or more) of the EJ Indexes calculated in EJSCREEN. The EJ Indexes most commonly at or over the 80th percentile statewide are NATA Diesel PM, RMP proximity, hazardous waste proximity, and PM2.5. Statewide data on prisons and exceedances of EJ Index 80th percentile values are summarized in Table 4.
Prison Counts and Number and Percent of Prison Areas with Environmental Justice Indexes Exceeding 80th Percentile
Includes three private prisons.
Includes one private prison.
Communities around prisons
For 158 of 165 prison areas studied, the population of the 12.57 mi 2 area surrounding the prison exceeded the inmate population reported by either the state DOC or the Federal BOP. This is important to confirm that the EJSCREEN results reflect a community broader than the inmate population of the prison. Although the Usual Residence Rule 48 specifies that prisoners should be counted at the prison, there appears to be variation in that practice as evidenced through the areas surrounding seven prisons (including Goose Creek, mentioned earlier) where the Census Bureau-reported populations in EJSCREEN in the selected area did not exceed the reported inmate populations.
A summary of the degree of urbanization of areas surrounding prisons in this study is presented in Table 5. Based on population density, 69% of the prisons in these 10 states were in rural areas and 4% were in cities. This shifts when total population thresholds are used instead of population density: 47% of prison areas are considered rural based on total population, but the same 4% of prisons are considered to be in cities.
Degree of Urbanization of 2-Mile Radius Around Prisons in This Study (Based on World Bank Thresholds)
DISCUSSION
This section expands upon three key findings of this study: (1) a significant number of U.S. prisons are in rural areas and smaller towns, many with EJ concerns, (2) states with higher incarceration rates are somewhat more likely to have prisons in areas with EJ concerns, and (3) a multitude of small pollution sources may contribute to environmental conditions around prisons. In addition, case studies of five prisons are included to present a more detailed look at factors contributing to disproportionate levels of pollution in communities around these facilities.
Prisons, EJ, and rural communities
EJ Indexes for the 11 environmental indicators were averaged across prison communities each of the 10 states (Fig. 1). Of the 107 resulting data points (EJSCREEN was missing 3 EJ Indexes for Alaska), 84 (79%) exceeded the 50th percentile statewide. This analysis confirms that prisons tend to be located in communities that are more polluted and/or more demographically distinct than state averages.
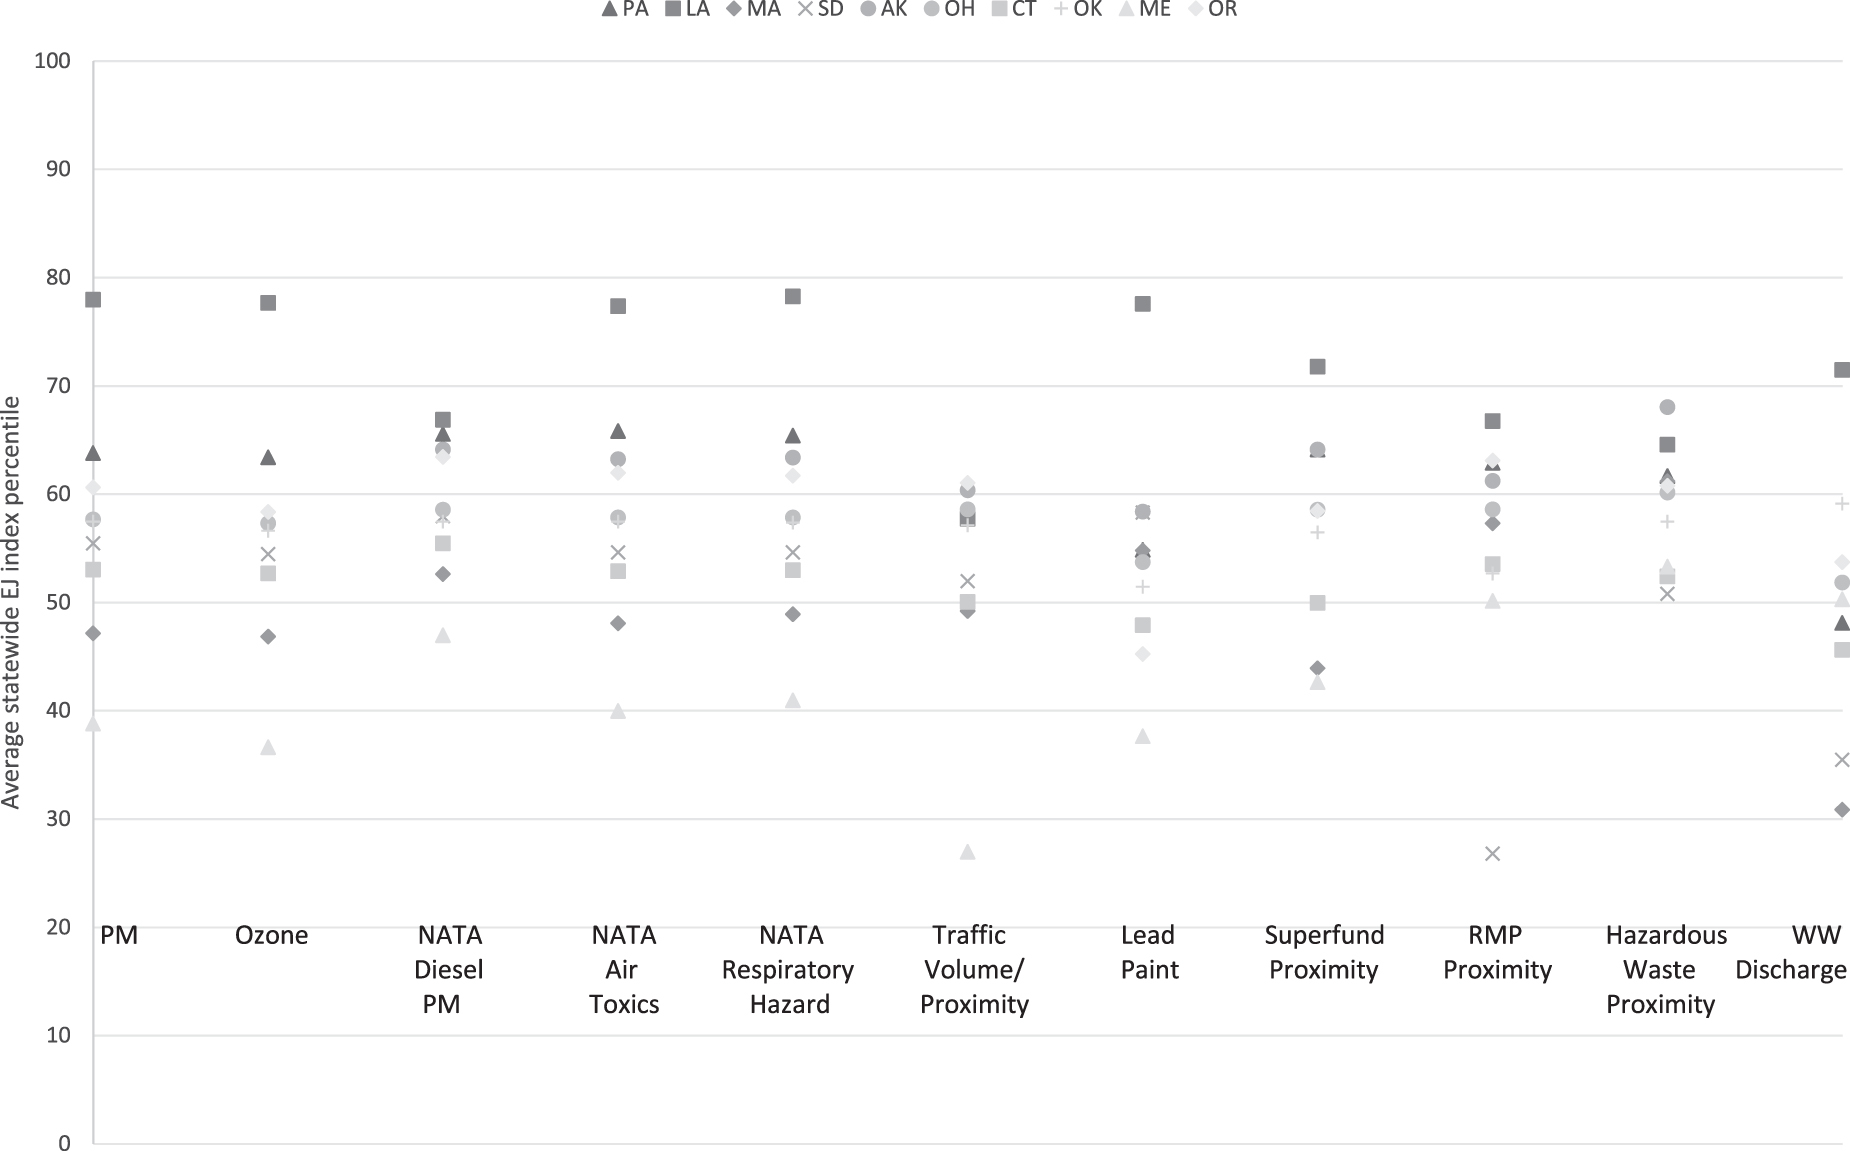
EJ index averages for 2-mi radius around prisons in each state. EJ, environmental justice.
Environmental exposures of incarcerated people will vary somewhat from exposures of unincarcerated community members; however, air pollution is a regional problem of concern to all groups, and a majority of the EJSCREEN environmental variables are directly related to air quality. Incarcerated individuals may be exposed to unhealthy levels of air pollution through time outdoors, infiltration into prison buildings, or in instances where mechanical ventilation is used. 49
This study also confirms that a significant number of U.S. prisons are located outside of U.S. cities. Approximately 40% of the areas surrounding the 165 prisons in this study also raise EJ concerns based on one EJ Index exceeding an 80th percentile statewide. But a significant number of the prison communities (almost 24%) present multiple potential EJ concerns; 39 of the prisons included in the study exceeded 80th percentile for the majority of EJ Indexes.
These are prison communities with multiple environmental concerns and markedly different conditions than other parts of the state. Rural communities do not always experience the economic promise of a new prison, with a decrease in per capita income observed in an analysis of towns around 29 prisons in Appalachia 50 ; low-income population is reflected in demographic indicators used to calculate EJ Indexes. These two measures—degree of urbanization and EJSCREEN analysis—together highlight rural EJ concerns.
More broadly, rural issues are often intertwined with race and class, 51 with the intersection of race and criminal justice noted earlier in this article. The use of rural communities to serve the needs of urban areas—for example, factory farming to feed a growing urban population—transfers environmental, health, and other impacts from urban to rural settings, 52 a “minority sacrifice to majority interest.” 53
Incarceration rates and EJ
States with higher incarceration rates tended to have more prisons in areas with EJ concerns. Siting prisons in areas with disproportionately high levels of pollution exposes inmates to potential health risks that they are unable to escape and exposes communities surrounding prisons to additional pollutants generated by prison operations. 54 The data presented in Figure 2 show a positive moderate correlation (R 2 = 0.4246) between the percent of prisons in a state exceeding the 80th percentile for a majority of EJ Indexes and incarceration rate per 100,000 population.
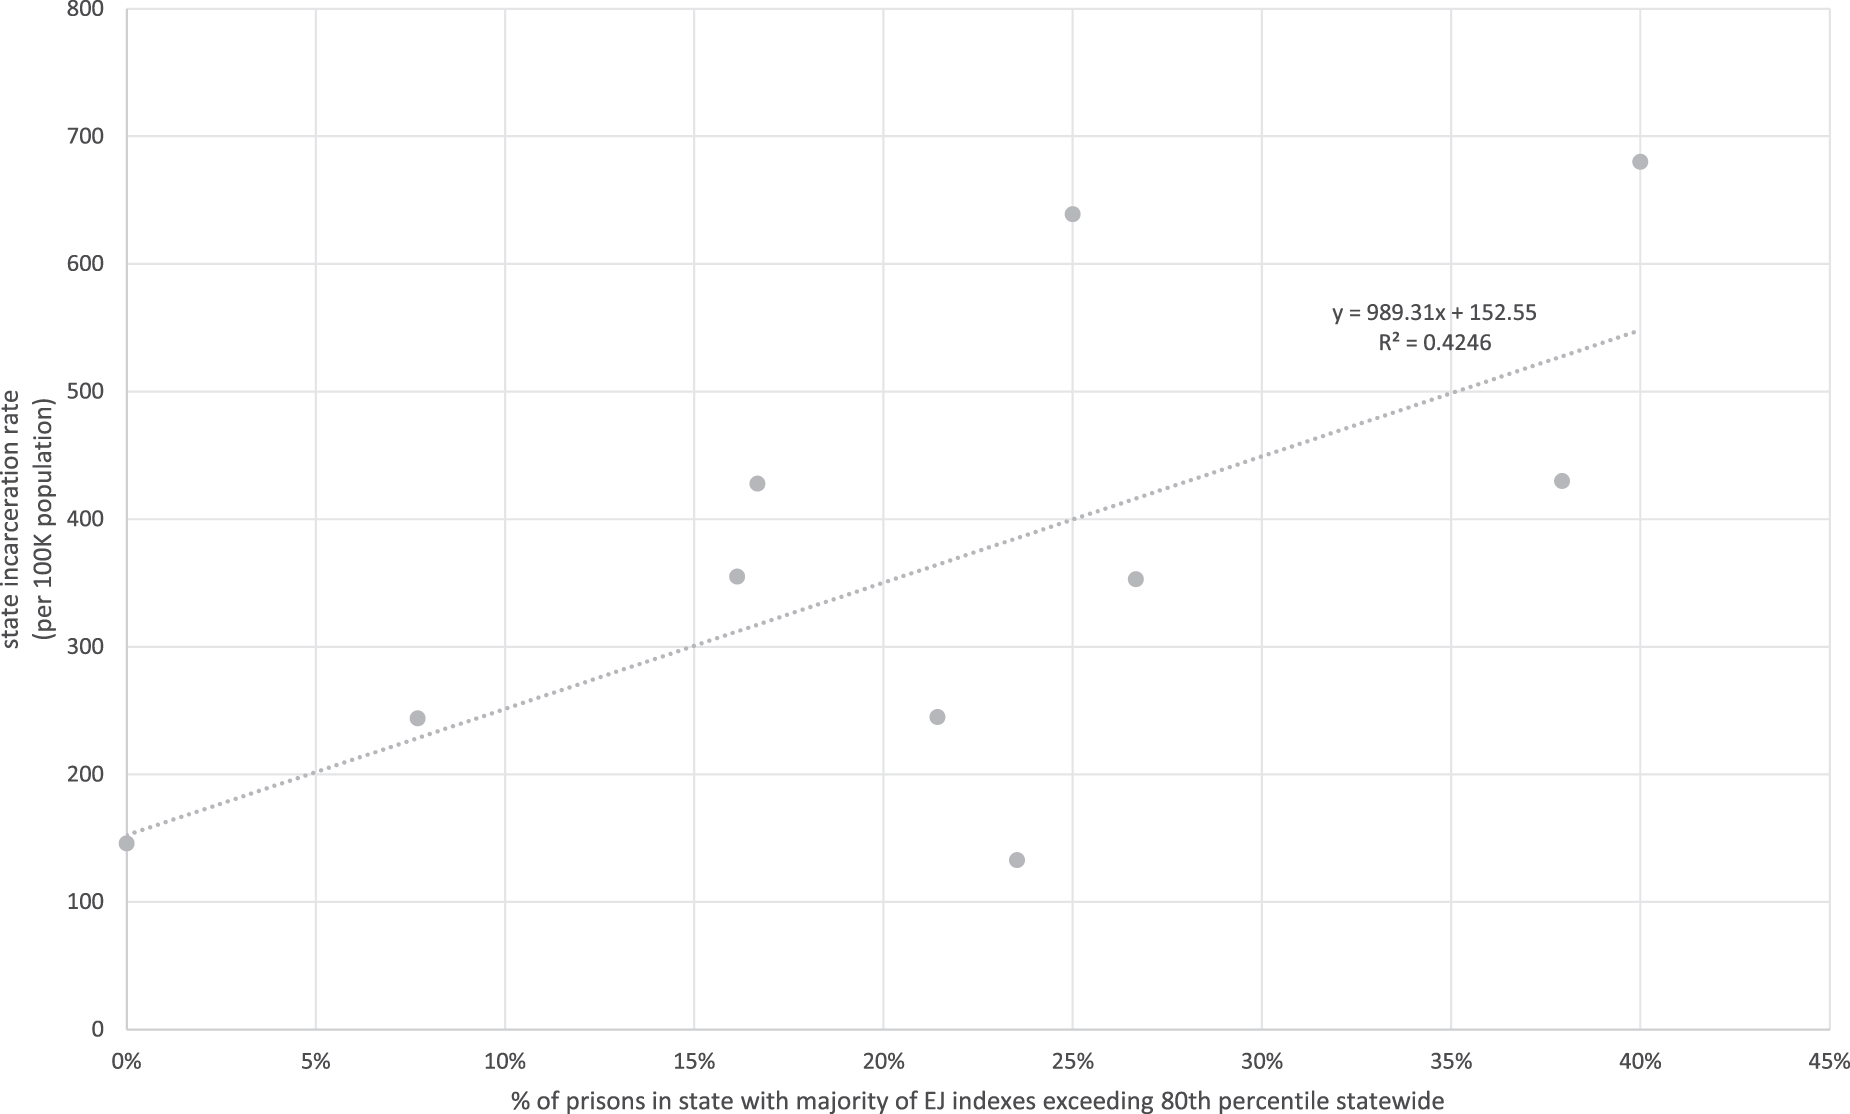
Plot of state incarceration rate and percent of prisons in state exceeding 80th percentile for a majority of the EJ indexes calculated in EJSCREEN.
Louisiana has both the highest incarceration rate (680 per 100,000) and the greatest portion (4/10, or 40%) of prison communities exceeding the 80th percentile value for a majority of EJ Indexes. Maine has the second-lowest incarceration rate (146 per 100,000); none of the prisons in Maine exceed the 80th percentile value for a majority of EJ Indexes.
Contributions of multiple pollution sources
Confirming findings of an earlier study, 55 Superfund (National Priority List) sites were found near just five of the prisons in this study: Louisiana Correctional Institute for Women near Devil's Swamp Lake; MCI-Concord near W.R. Grace & Co., Inc., Acton Plant in Massachusetts; Devens FMC near Fort Devens, a federal facility in Massachusetts; and Maine Correctional Center and Southern Maine Women's Reentry Center both near the Keddy Mill site. Although there are notable occurrences of Superfund sites affecting environmental conditions in prisons, 56 this study finds that typically many pollution sources exist—not a single site—that can contribute to air, water, or land pollution.
Of the facilities near Superfund sites, the Louisiana Correctional Institute for Women is the only one located near a Superfund site and in a community with multiple EJ Indexes exceeding 80th percentiles statewide. Multiple pollution sources and distinct demographics of communities surrounding prisons can raise EJ concerns, as described in the case studies, hereunder.
Case studies
This section presents narratives of areas surrounding five prisons that exceeded the 80th percentile statewide for every EJSCREEN EJ Index, expanding on the geographic, environmental, and population characteristics of the areas surrounding each prison. Facilities are grouped based on their degree of urbanization to demonstrate that EJ concerns are not limited to urban areas.
In addition to the data available on current conditions surrounding prison facilities, there is likely also a less visible set of factors contributing to ongoing EJ concerns. In 1844, the Oregon Territory passed a Black Exclusion Law, 57 expelling former enslaved people and banning black people from entering the territory. Fort Sill, where Apache individuals and Japanese Americans were incarcerated, 58 is a mere 3 mi from Lawton Community Corrections Center.
Youngstown, Ohio is one of many communities in the United States that was heavily redlined. 59 And residents in Chester, Pennsylvania have been fighting for EJ in the community for decades. 60 However, even today, some state governments are refusing to confront historical racism, 61 making it unlikely that addressing EJ will be a universal priority. With this as an important yet incomplete backdrop, a summary of environmental and demographic indicators and EJ Indexes is presented in Table 6.
Summary of Population Details and EJSCREEN Results for Areas Surrounding Five Prisons
“A” columns: Indicator at/over 80th Percentile (X) or 95th Percentile (XX) Statewide. “B” columns: EJ Index at/over 80th Percentile (X) or 95th Percentile (XX) Statewide. RHU, restrictive housing units.
Prisons in cities
Industrial activity near Oregon State Penitentiary (Salem, OR) includes waste collection, sheet metal, and a wine distribution center. Although no facilities in this area are listed in EPA's Envirofacts and none report to the TRI, the area around the prison exceeds the 80th percentile statewide for four environmental indicators, including NATA diesel PM and traffic proximity and volume. This is understandable, as the 97310 zip code is split by I-5, and the prison is near a large Oregon Department of Transportation facility.
There are two hazardous waste transportation/storage/disposal facilities within 2 mi of the prison, raising the RMP EJ Index. Around this prison, demographic indicators elevate all EJ Indexes over the 80th percentile statewide, with traffic and RMP proximity exceeding the 95th percentile statewide. According to FEMA flood mapping, this facility is also located in the 500-year flood plain (0.2% annual chance of flood hazard).
Prisons in towns/semidense areas
The area surrounding SCI Chester (Chester, PA) approaches characterization as a city according to World Bank guidelines. Figure 3 shows some of the facilities in the community surrounding the prison. Chester is in a nonattainment area for the 2008 ozone 8-hour standard, not surprising due to its proximity to major transportation routes, including I-95 that bisects the 19013 zip code. This also results in an environmental indicator for traffic proximity and volume in the 97th percentile statewide. Industry in the zip code includes chemical manufacturing, water and sewage processing facilities, paper mills, and metal works; 11 facilities in the zip code report to the TRI.
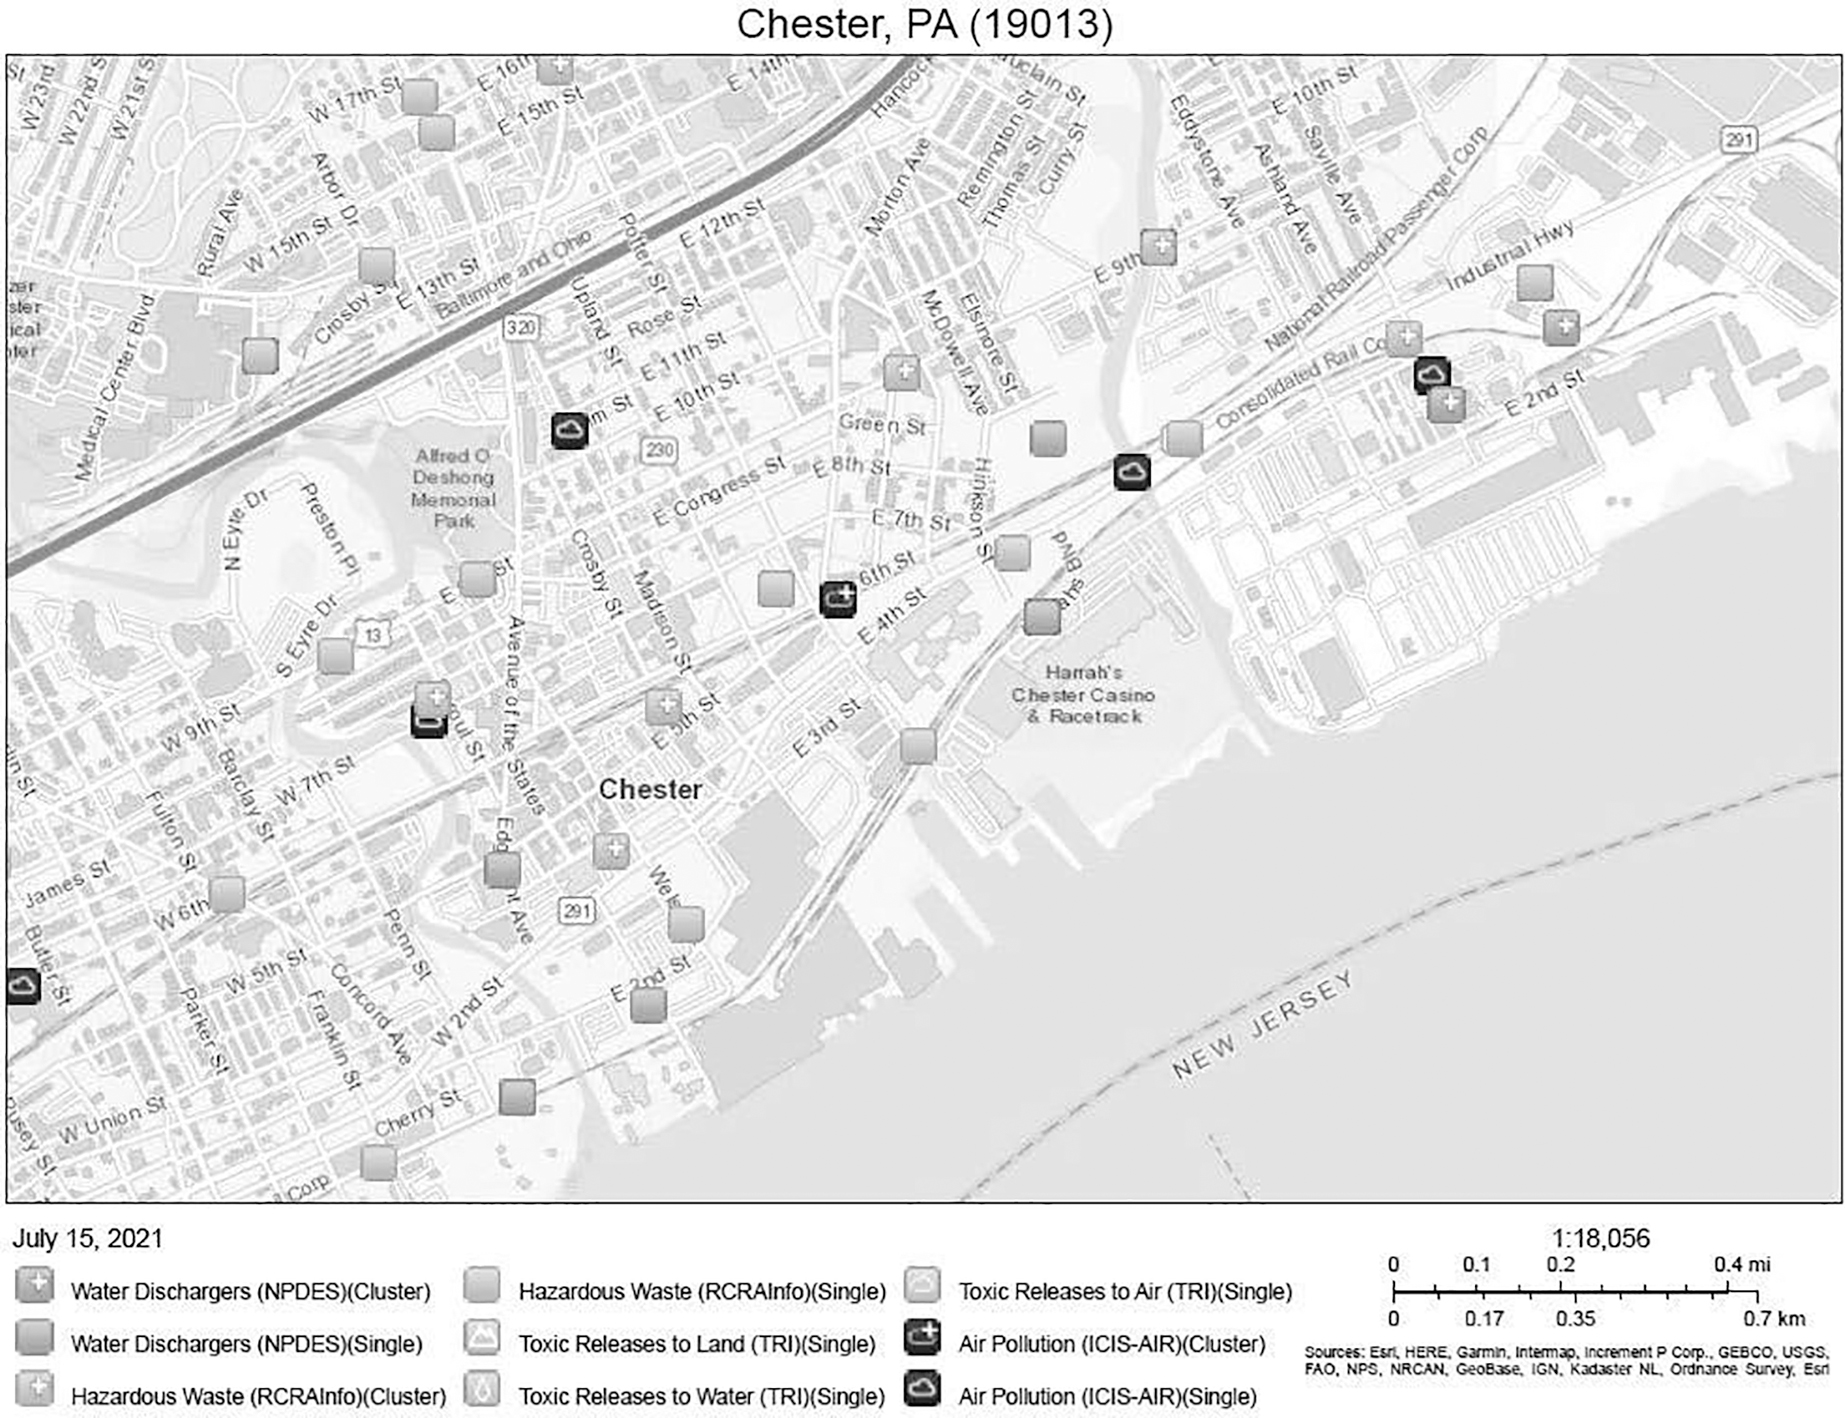
EPA My Environment map for region around SCI Chester (noted on the map by a star). EPA, Environmental Protection Agency.
Despite this, and the 22 facilities permitted as air pollution sources (including 5 majors), the area around SCI Chester does not exceed an 80th percentile threshold statewide for EJ Indexes related to air quality. The 101 facilities with reported hazardous waste activities 62 increase the percentile of the Hazardous Waste Proximity indicator. Although only a portion of the environmental indicators for the area around SCI Chester are over the 80th percentile statewide, all EJ Indexes exceed the 80th percentile statewide, with EJ Indexes for traffic and wastewater discharge exceeding the statewide 95th percentile.
In the area surrounding the South Dakota State Penitentiary and Jameson Annex (Sioux Falls, South Dakota), there are two synthetic minor permitted air pollution sources and only one facility reporting toxic releases to the TRI. However, several environmental indicators exceed the 80th and 95th percentiles statewide. The prison is near many industries and other polluting activities: Sioux Falls Regional Airport is adjacent to the facility, as are an industrial park, two major highways, and a meat processing facility. This prison is situated in an area with high levels of pollutants (particularly air toxics) and a population significantly different in demographics than the rest of the state.
Prisons in rural areas
Ohio State Penitentiary (Youngstown, OH) is within a 2-mi radius of one facility permitted as a major source of air pollution and two major wastewater dischargers. Only one environmental indicator is notable: PM2.5 exceeds the 95th percentile statewide. Despite this, the population characteristics (older, less educated, linguistically isolated, poorer, and comprising 65% people of color) elevate all EJ Indexes over the 80th percentile statewide.
Lawton Community Corrections Center (Lawton Community CC in Lawton, OK) is in the same zip code as 12 air pollution sources, including 1 permitted major, 32 hazardous waste facilities, 2 TRI facilities, water and sewage processing facilities, and is located next to the Lawton-Fort Sill Regional Airport and a turnpike.
Despite this location, none of the environmental indicators exceed the 80th percentile statewide. The population living around the prison is comprising 63% people of color and 67% of the population is considered low-income, placing the Demographic Index for the area in the 92nd percentile statewide. In other words, the pollution around this facility is not that different from other parts of the state, but the population is significantly different, causing every EJ Index to exceed a statewide 80th percentile.
Limitations
There are limitations to this study. First, and most notably, is that data are inadequate for characterizing the variety and nuance of the lived experiences of people in prison or people living in the communities included in this article; desktop analysis is not a substitute for direct engagement with communities. This study also does not attempt to answer the question of whether prisons were purposefully sited in areas that are more polluted or demographically distinct, or whether prisons contributed to environmental degradation of the surrounding area.
Rather, the focus on prisons surfaces environmental concerns for inmates and for rural areas more generally; prisons are the anchor point to apply an EJ lens to rural issues. There are inherent uncertainties in environmental and demographic data on which EJSCREEN relies. The study makes no attempt to directly assign pollutant levels to emission sources, nor health impacts to pollutants; environmental conditions should be considered a proxy for exposure. The study also did not look at correctional facilities housing juveniles, nor did it include data on drinking water quality.
The Justice40 initiative
Although the definition of disadvantaged communities in the Justice40 interim guidance 63 does not specifically include inmates, formerly incarcerated individuals, or others interacting with the U.S. criminal justice system, the definition could be broadly interpreted to include these individuals due to the racialized nature of the U.S. criminal justice system and underemployment of those released from prison. The list of covered programs does include job training and workforce development for formerly incarcerated individuals; these individuals should also be included in Justice40 Initiative stakeholder consultations.
In the context of this study, the absence of BOP as a Justice40 participating agency represents a notable gap. There are a range of possibilities for this gap, with purposeful omission at one end of the continuum and a blind spot at the other, with neither extreme likely. Perhaps it is the lack of an obvious connection between imprisoned people and action on renewable energy and climate change, although with some creativity, those connections become more apparent.
BOP can incorporate EJ in siting, renovation, and operation of prisons. Siting renewable energy and designing green stormwater infrastructure on prison grounds could provide community-wide environmental benefits, while inmates could be trained on renewable energy installation, green infrastructure maintenance, and sustainable agriculture in support of the Initiative's workforce development priority.
The Climate and Economic Justice Screening Tool proposed in the Justice40 Initiative would be a valuable complement to EJSCREEN analyses. As climate change continues, environmental conditions shift and economic impacts accrue. Air quality is affected as wildfires increase in frequency and severity. Drought will continue to push us to access lower-quality, more distant, or more expensive water sources for consumption and irrigation. Flooding not only jeopardizes health and safety of communities, and presents a significant burden in cleanup costs, it has the potential to mobilize contaminants, amplifying health and safety risks.
Incarceration also presents a barrier to climate resilience, as incarcerated people lack resources and evacuation capabilities in times of natural disasters. 64 In prisons, specifically, more frequent heat waves will contribute to already dangerously hot conditions. 65 BOP could use a climate-focused screening tool to make federal prisons climate-ready, implementing climate adaptation features to ensure the safety of the individuals in their charge and to benefit communities surrounding prisons. Adding BOP to the list of Justice40 pilot programs would provide proof of concept for state DOCs to take similar actions in prisons in their jurisdiction.
CONCLUSION
If one new to this subject were to attempt to visualize EJ today, perhaps through a Google images search for the term, one would find pictures of marches down city streets and industry on the edges of cities. You must be more purposeful in your efforts to find images of early EJ activism in rural areas, such as Warren County, NC, or the decades-long sanitation crisis in Lowndes County, AL. This article's examination of the communities surrounding 165 state, federal, and private prisons in 10 states furthers the argument that rural communities, increasingly the site of prisons, must be considered more fully in terms of EJ action.
In rural EJ communities, prisoners themselves represent a uniquely affected population: unable to move to avoid negative environmental conditions surrounding their prison. In addition, prisoners are in the control of a system that disproportionately incarcerates people of color, a process that can render them unable to select their local, state, and federal government representation, as most states strip felons of their right to vote for at least some period of time. 66 An ambitious decarceral agenda is one approach to mitigate these impacts on prisoners.
Prison abolition and the EJ movement share a humanitarian perspective: those behind bars and those in toxic neighborhoods are people, deprived of liberties. Improving conditions for people in prisons and in EJ communities may similarly share elements of restorative justice, in which offenders make efforts to acknowledge and correct the wrongs of the past in consultation with victims of crime.
Elements of restorative EJ are present in proposals to reclaim Rikers Island as a sustainability hub. 67 Short of prison abolition or national pursuit of restorative justice frameworks, this intersectional approach reveals a clear need to address EJ issues in rural areas and in communities surrounding prisons through inclusion of imprisoned and formerly imprisoned people in EJ policy; improvements to air quality and other environmental conditions in rural communities; and planning and funding for climate adaptation projects in and around prisons.
More broadly, it is evident that EJ concerns in rural parts of the United States have not been resolved, they have simply been left behind in terms of both policy and scholarship. Residents of rural areas are not immune to disproportionate environmental burdens by virtue of lower population density. EPA states that EJ is achieved when everyone has access to decision making related to environmental issues so that all people are protected from environmental hazards. 68 To achieve EJ, the diversity of rural communities and historical influences on marginalized populations in rural areas must guide efforts toward inclusion of all communities in discussion around environmental matters.
Incarceration and environmental injustice intersect in rural America, as do a variety of complex and often painful histories. Acknowledging ways in which unique rural experiences are woven together and removing the default position that EJ is an urban issue are critical to the advancement of rural EJ. Although in its early stages, the Justice40 Initiative could foster creative and inclusive action on EJ, further steps toward a more sustainable future for all.
Footnotes
AUTHOR'S CONTRIBUTIONS
The corresponding and sole author researched, wrote, and edited this article.
AUTHOR DISCLOSURE STATEMENT
No competing financial interests exist.
FUNDING INFORMATION
No funding was received for this article.