
Abstract
Background:
Tree canopy cover has mental and physical health benefits for children, yet distributional environmental injustices in tree canopy cover near schools are rarely investigated. Some evidence suggests that tree canopy coverage positively influences aggregated school-level children's academic proficiency metrics. There is a lack of research if canopy cover moderates the negative effect of particulate matter on academic proficiency.
Methods:
We linked data on schools from the National Center for Education Statistics, Utah's Student Assessment of Growth and Excellence, the National Land Cover Database, and the U.S. Environmental Protection Agency. We used generalized estimating equations, which account for non-normally distributed data and clustering, to analyze data from the 2015 to 2016 school year.
Results:
Greater school social disadvantage (higher percentages of students qualifying for free/reduced price meals and higher percentages of racial/ethnic minority students) was significantly associated with reductions in tree canopy cover within 1000 m and 500 m of the school. Greater tree canopy coverage at 1000 m and 500 m was significantly associated with a lower percentage of students testing below proficient on year-end math and language arts exams. Additional days of peak fine particulate matter were associated with higher percentages of students testing below proficient in math.
Discussion:
Socially disadvantaged primary schools in Utah were surrounded by less canopy cover. There was a protective effect of tree canopy cover on academic proficiency in math and language arts.
Conclusion:
Findings suggest targeting carefully designed tree planting efforts at socially disadvantaged schools and testing interventions involving tree planting and changes in academic proficiency.
INTRODUCTION
Tree canopy coverage, which includes overhead cover of leaves and greenery, has many potential mental and physical health benefits, particularly for children. 1 Regular access to greenspace and canopy cover can improve children's mood 2 and reduce stress. 3 This is because exposure to natural settings can replenish human capabilities to focus and rejuvenate the mind. 4 When children have access to greenspace at school, they are better able to engage in a wide variety of activities, such as unstructured active play, which can have cognitive benefits. 5
Due to its associations with health and well-being, environmental justice (EJ) researchers have examined whether there are social inequalities in access to tree canopy cover. Although findings are mixed regarding associations between minority race/ethnicity and reduced canopy cover, 6 a pattern of lower socioeconomic status (SES) and reduced tree or vegetation cover is much more consistent across the literature, 7 though there are exceptions to this trend. 8 Examining schools specifically, greener schools were located in more affluent areas of Barcelona, 9 less disadvantaged areas in Chicago, 10 and higher SES areas in Ontario, Canada, 11 demonstrating a distributional environmental injustice for children.
Researchers have also tested for linkages between greenspace and academic proficiency, and findings from the studies are mixed. Across 13 studies covered in a recent literature review, the null effect was more common than a positive effect. 12 Nonetheless, there is some evidence that exposure to greenspace, and especially tree cover, may enhance student academic performance. 13
A school-based study in Toronto, Ontario found that sixth graders received better average test scores at schools with greater tree canopy cover controlling for socioeconomics; the same was not found for grade 3. 14 More vegetation cover near schools in Massachusetts was positively associated with higher scores on state standardized tests in third grade English and math when accounting for race/ethnicity and parental income. 15 Urban California elementary schools with greater surrounding tree and shrub coverage had higher test scores for fifth grade math, science, and language arts scores than those with less vegetation coverage controlling for racial/ethnic minority status and socioeconomics. 16 In Chicago, greater tree cover was associated with better performance on standardized tests in math, and to a lesser degree reading, controlling for school social disadvantage (a measure of economic deprivation and racial/ethnic minority status). 17
More consistently across the literature, concentrations of air pollution at schools are associated with reduced academic proficiency. This has been found in several U.S. nation-wide studies, 18 in studies focused on U.S. states, such as California, Massachusetts, Michigan, Louisiana, and Texas, 19 and in specific cities as well. 20 Although most of these studies rely on chronic measures of air pollution, the study conducted in Salt Lake County, Utah, an area encompassed by this study, examined peak fine particulate air pollution exposures. 21 Peak pollution measures are relevant in Utah due to the mountainous topography, which seasonally traps pollutants in persistent cold air pools known as inversions. 22 Each additional day of peak pollution exposure was associated with an additional 1.5% and 1.8% of third-grade students testing below proficient in math and language arts on year-end standardized tests, respectively. 23
Although it is relatively well established that air pollution has a negative influence on school performance metrics, there is a notable gap in the literature with respect to whether tree canopy cover might mitigate those negative effects, as tree canopy cover can reduce local particulate matter concentrations. For example, woodland areas in England collected three times more PM10 (particulate matter <10 microns in diameter) from the atmosphere than did grasslands. 24 In London, researchers estimate that tree canopy removes 800–2100+ tons (i.e., 0.7%–1.4% of the total urban boundary layer) of PM10 annually. 25
A study conducted in Nanjing found that PM2.5 was negatively correlated with tree canopy cover. 26 Looking directly at associations between traffic pollution, school greenness, and cognitive function in Barcelona, researchers found traffic pollution explained 20%–65% of associations between school greenness and 12-month progress in cognitive functions. 27 This suggests the hypothesis that canopy cover may reduce the negative effect of PM2.5 on school-level academic proficiency, although this has not yet been investigated.
In addition to canopy cover and PM2.5, sociodemographic factors are also associated with academic proficiency. Research has found that lower SES and racial/ethnic minority status are associated with lower academic performance. 28 Although these variables are important at the individual level, they are also relevant at the school level.
Schools serving predominately sociodemographically disadvantaged students often lack access to resources and well-qualified teachers. 29 School-level studies conducted in the United States consistently find that schools with higher percentages of minority race/ethnicity and low economic status (e.g., free/reduced price meals [FRPM]) students have lower aggregated test scores. 30
Despite many benefits to well-being, little is known about distributional environmental injustices in access to tree canopy cover at schools. Although there is literature on canopy cover and academic proficiency, it is more limited than the literature on air pollution and academic proficiency. Given the modifiable nature of tree canopy cover, it is critically important to examine as a correlate of school performance metrics.
To those ends, this study had three research objectives applicable to Utah public primary schools. Our first objective was to quantify distributional environmental injustices in tree canopy cover surrounding schools. Our second objective was to assess the relationships between canopy cover and third-graders' proficiency in math and language arts, adjusting for the frequency of peak (24 hours) fine particulate matter levels and social disadvantage. Our third objective was to determine whether tree canopy cover moderates the effects of peak fine particulate matter on proficiency in math and language arts.
MATERIALS AND METHODS
Study area and unit of analysis
We conducted this study in Utah, which is home to 3.2 million residents, nearly one-third of whom are younger than 18 years of age. The largest racial/ethnic minority group is Hispanics (14% of total population), whereas almost 80% of the population is non-Hispanic White. About 9% of Utahns live in poverty and the same percent are foreign-born. 31 Two-thirds of the population live along the urbanized Wasatch Front, which includes Salt Lake City. Much of the rural population resides in tourist towns, which serve five National Parks, tribal land areas, and small towns with histories of mining and natural resource extraction. Approximately one-quarter of Utah's public schools are in rural-designated areas. 32
Our unit of analysis is public primary (elementary) schools. We excluded charter schools and included all primary schools with academic performance data from the Utah Education Association's Student Assessment of Growth and Excellence (SAGE). We chose to analyze third-grade test scores because third graders are the earliest grade for which standardized test scores are available.
We selected the earliest grade, because younger children are particularly susceptible to adverse health effects associated with environmental hazards in comparison with older children. 33 The number of schools included differs across our two academic outcomes due to missing data. There are 464 schools with data on third-grade students' math scores and 325 schools with data on third graders' language arts scores. All except four of the schools with language arts scores also report math scores. For the first research objective, which is not based on test scores, we used the schools reporting math scores to maximize the number of schools included in the analysis.
Environmental variables
For the first research objective, we use tree canopy cover as the dependent variable. It becomes an independent variable in the second and third research objectives. We derived our canopy cover variable from the National Land Cover Database's (NLCD's) 2016 U.S. Forest Service Tree Canopy Cover layer, which provides an estimate of percent tree cover for each 30 m pixel. 34 The NLCD's approach for generating the tree canopy coverage values is described in Coulston et al. 35
We calculated the mean canopy cover pixel value within 1000-m buffers around schools using ArcGIS Pro software (Fig. 1). This distance is commonly used in similar studies. 36 As it is recommended to use multiple buffer distances, 37 we also use 500-m buffers. We focus on tree canopy cover since it has been more closely linked to academic achievement in other studies than other measures of greenness. 38
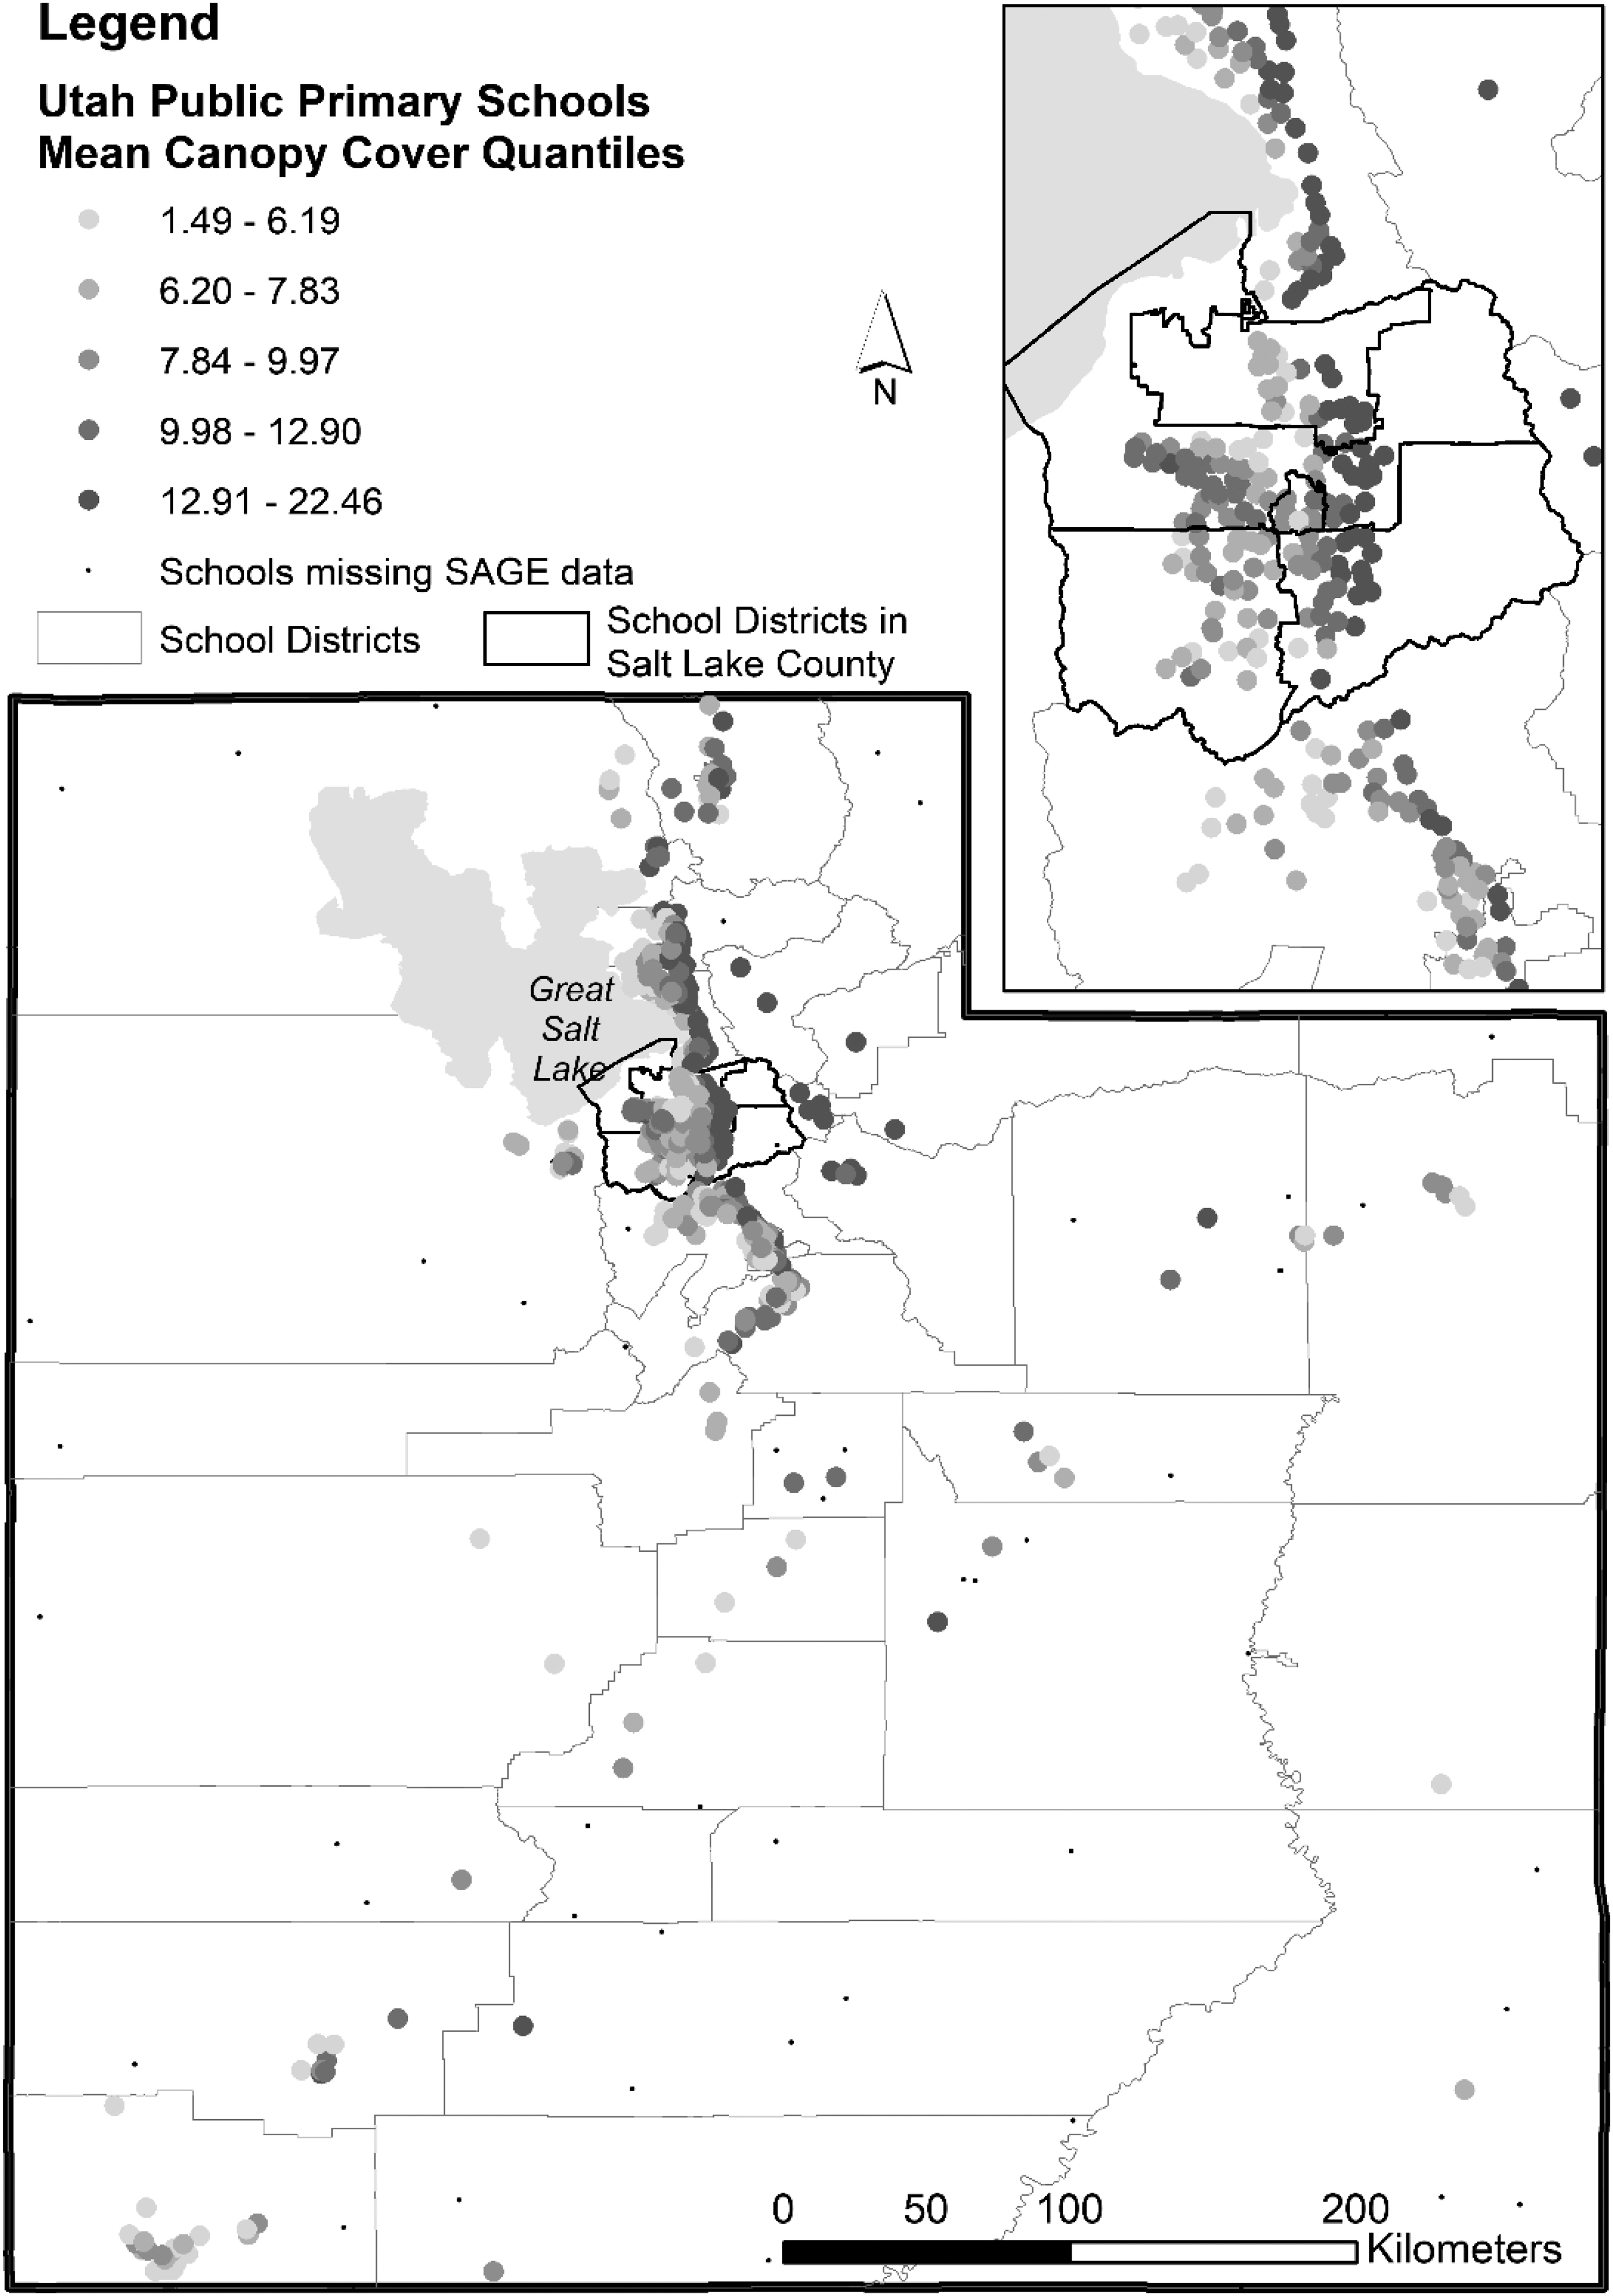
Distribution of tree canopy cover within a 1000-m radius of Utah public primary schools. SAGE, Student Assessment of Growth and Excellence.
We used U.S. Environmental Protection Agency's 2015–2016 Downscaler dataset to obtain the peak PM2.5 measure pertaining to census tracts hosting schools. Peak PM2.5 refers to the number of days, with PM2.5 concentration estimates above the 90th percentile for all tract-days in the State of Utah (i.e., >13.26 μg/m 3 ). Downscaler estimates PM2.5 concentrations using a Bayesian space-time downscaling fusion model. 39
The Downscaler method integrates data from a gridded atmospheric model (i.e., Community Multi-Scale Air Quality Model or CMAQ) and points to air pollution measurements from the National Air Monitoring Stations/State and Local Air Monitoring Stations (NAMS/SLAMS). The CMAQ estimates gridded averages with no missing values but is subject to calibration error; that error is accounted for through fusion modeling with monitoring data from NAMS/SLAMS that provide direct, accurate measurements of PM2.5 concentrations. 40 By explicitly accounting for the spatiotemporal dependence in PM2.5 concentrations, the Downscaler achieves relatively good model performance in reference to direct ground-based PM2.5 observations. 41
Sociodemographic variables
We used sociodemographic variables from the 2015 to 2016 school year as independent variables in all three research objectives. We obtained sociodemographic data on each school from the National Center for Education Statistics' (NCES) ELSi Table Generator tool. The ELSi tool provides users with access to the U.S. Department of Education's Common Core of Data, which is the primary database on public elementary and secondary schools in the United States. These data have been used in prior studies of environmental injustices at U.S. schools. 42
For each school, we downloaded total student enrollment, Title 1 eligibility, the number of students qualifying for FRPM, as well as the number of students within each racial/ethnic category: Hispanic and non-Hispanic White, Black, Hawaiian National/Pacific Islander, Asian or Asian/Pacific Islander, American Indian/Alaskan Native, and two or more races. From these NCES data, we created two variables for use in our analyses.
First, we used total enrollment at each school. Second, we combined the SES and race/ethnicity variables into a single school social disadvantage factor. For SES, we include Title 1 eligibility status, which qualifies low-income schools to receive government financial aid, and the proportion of students qualifying for FRPM at each school. For race/ethnicity, we created a proportion Hispanic variable and a proportion non-Hispanic racial/ethnic minority variable, due to small counts in the non-White non-Hispanic groups.
We combined these four variables into a school social disadvantage factor (separately for schools with math scores, and for schools with language arts scores), following Mullen et al., 43 due to high correlations between the SES and race/ethnicity variables (e.g., the proportion of Hispanic students and the proportion on FRPM had a Pearson's correlation value of 0.684). The factor had a Cronbach's alpha score indicative of internal consistency (0.69 and 0.64, respectively). Kuo et al. 44 also combined minority race/ethnicity and FRPM into a school social disadvantage factor for similar reasons.
Urban–rural gradient variables
To adjust for the urban–rural gradient across Utah schools, we use two variables. We downloaded Rural–Urban Commuting Area (RUCA) Codes from the U.S. Department of Agriculture's 2010 database, which pertain to census tracts. The RUCA codes describe urbanization and commuting patterns in tracts (U.S. Department of Agriculture, 2020). 45 We recoded the RUCA codes into urban-core (RUCA code = 1) and non-urban core (RUCA codes = 2–10), and we assigned schools their RUCA code based on their host census tract. We also assigned population density values to each school based on their host census tract.
As a final step, we standardized our continuous variables (i.e., school social disadvantage factor, total enrollment, and population density) before using them in the models. We created two versions of each standardized variable, as there are different numbers of schools in each model based on the availability of schools with language arts (n = 325) versus math (n = 464) test data. Descriptive statistics for all variables are presented in Table 1.
Descriptive Statistics for Variables Included in Analyses of Utah Public Primary Schools
Factor comprised of: Title 1 school eligibility, percentage with FRPM, percentage Hispanic students, and percentage non-Hispanic minority students.
FRPM, free/reduced price meals; Max, maximum; Min, minimum; PM, particulate matter; SD, standard deviation.
Academic proficiency variables
Our two dependent variables for the second and third research objective are the percentage of third-grade students who tested below proficient in standardized computer adaptive year-end math and language arts exams 46 pertaining to the 2015–2016 school year. These SAGE exams were developed by Utah educators and were given to Utah students in 3rd to 11th grades between 2014 and 2018. The Utah State Board of Education provides SAGE scores as the percentage of students at a school who tested “below proficient,” “approaching proficient,” “proficient,” and “highly proficient.”
We selected “below proficient” percentages for our analysis, which are in reference to grade-level expectations. Figures 2 and 3 depict the geographic distributions of schools, based on the percentages of students who tested below proficient in math or language arts, respectively.

Distribution of the percentages of third-grade students testing below proficient in math for the 2015–2016 school year in Utah public primary schools (n = 464).

Distribution of the percentages of third-grade students testing below proficient in language arts for the 2015–2016 school year in Utah public primary schools (n = 325).
Analysis methods
We used generalized estimating equations (GEEs) 47 to address our three research objectives. The GEEs provide a general method for the analyses of clustered continuous, ordinal, dichotomous, polychotomous, and event-count response variables and relax several assumptions of traditional regression models. The GEEs enable us to answer our research questions when we have non-normally distributed dependent variables, while accounting for geographic clustering. 48
For our purposes, GEEs are preferable to other modeling approaches that account for nonindependence of data (e.g., generalized linear mixed models with random effects). This is because GEEs estimate unbiased population-averaged (i.e., marginal) regression coefficients, even with misspecification of the correlation structure when using a robust variance estimator, 49 which is appropriate for analyses of general patterns of inequality across subpopulations. 50 Mixed models with random effects, in contrast, generate cluster-specific (i.e., conditional, subject-specific) results, which would not elucidate average responses over subpopulations or provide as solid an inferential basis for making comparisons across groups or subpopulations in this analysis. 51
In addition, due to our focus is on predicting conditions at a school, but not school-level effects, GEEs are appropriate because the intracluster correlation estimates are adjusted for as nuisance parameters and not modeled (as in multilevel modeling approaches). 52
The GEEs require the use of clustering variables, and we used two clustering variables: school district by median age of housing stock in the school's host tract. We obtained school district data from the SAGE report (n = 41). School districts are appropriate as a clustering variable because schools in the same school district share similar funding and policy structures, which influence test scores. 53 We downloaded the median age of housing stock data from the American Community Survey. We divided the housing stock clustering variable into 5 median year-of-construction categories (i.e., pre-1969, 1970–1979, 1980–1989, 1990–1999, 2000+).
Clustering by housing stock provides an understanding of a school's locational context. Year-of-construction has been used as a cluster variable in multiple EJ studies to account for historical-geographic context. 54 In our GEE predicting math, there were 1–26 schools in each cluster with a total of 100 clusters. In the GEE predicting language arts, there were 1–20 schools in each cluster with a total of 84 clusters.
To address the first objective, we ran a GEE model, predicting canopy cover at schools (n = 464) (primary variable assessed at 1000 m, secondary variable assessed at 500 m) using school social disadvantage, total enrollment, urban core, and population density. To select the best fitting model specification, we tested unstructured, independent, and exchangeable working correlation matrices.
We tested Normal, Gamma, and Inverse Gaussian distributions with identity and log link functions. We determined goodness-of-fit via quasi-likelihood under independence model criterion values. The best-fitting specification was an inverse Gaussian distribution with an identity link function and an exchangeable working correlation matrix.
To address the second objective, we ran GEE models, predicting math proficiency and then language arts proficiency using the two environment, two sociodemographic, and the two urban–rural gradient variables. We also calculated estimated marginal means to illustrate how the association between canopy cover and proficiency changes across the range of canopy cover values. We ran the models twice, using canopy cover at 1000 m and at 500 m.
To select the best fitting model specifications, we followed the same steps as the first objective. The best-fitting specification for the models was normal distribution with an identity link function and an unstructured working correlation matrix. For the third objective, we then added interaction effects to the same models that we ran for the second objective to assess whether canopy cover modified associations between peak PM2.5 and academic proficiency. We used SPSS version 28 to conduct the GEE analyses.
We also conducted several sensitivity analyses (tables not shown). First, we ran each model separately in urban versus rural schools. Second, we ran each model substituting county for school district as one of the clustering variables. Third, as part of research objective 3, we substituted school disadvantage for peak PM2.5 in the interaction with canopy cover.
RESULTS
Research objective 1
Table 2 presents results from the GEE predicting tree canopy coverage surrounding primary schools in Utah. Every one-standard deviation increase in school social disadvantage was significantly associated with a 1.42% decrease in mean canopy cover at 1000 m and a 1.27 U decrease in mean tree canopy coverage at 500 m (p < 0.001).
Generalized Estimating Equation Results Predicting Mean Tree Canopy Cover at (A) 1000 m and (B) 500 m Surrounding Utah Public Primary Schools (n = 464)
Model used an exchangeable working correlation matrix with an inverse Gaussian distribution and an identity link function and accounted for clustering with median age of housing stock and school district. All continuous variables were standardized.
Factor comprised: Title 1 school eligibility, percentage with FRPM, percentage Hispanic students, and percentage non-Hispanic minority students.
p < 0.05, **p < 0.01, ***p < 0.001.
CI, confidence interval.
In terms of the control variables, each one standard deviation increase in total student enrollment was significantly associated with a 0.68 U decrease in mean canopy cover at 1000 m and a 0.81 U decrease in mean tree canopy coverage at 500 m (p < 0.001). A one standard deviation increase in population density in the school's host tract was associated with a 0.41 U increase in mean tree canopy coverage at 500 m (p < 0.01); this finding was not significant when canopy cover was assessed at 1000 m.
Urban–rural sensitivity analysis
Greater school disadvantage was associated with reduced canopy cover (1000 and 500 m) in all schools (n = 464; Table 2) and urban schools (n = 181) (p < 0.001). The finding was positive and significant at 500 m (p < 0.05), but not significant at 1000 m (p = 0.092) in rural schools (n = 83). Schools serving larger numbers of students had reduced canopy cover (1000 m) (p < 0.05) in all schools (Table 2), urban schools, and rural schools.
County clustering sensitivity analysis
As in the model presented in Table 2, school disadvantage was a positive and significant predictor of canopy cover at 500 and 1000 m, as was total enrollment (all at p < 0.001) when using county (n = 25) as the clustering variable. Unlike results in Table 2, population density became a positive and significant predictor (p = 0.008) of canopy cover at 500 m when using county clusters.
Research objective 2
Table 3 presents results from the GEEs predicting the percentage of students testing below proficient in math and language arts. Each one standard deviation increase in mean tree canopy coverage at 1000 m was significantly associated with a 0.016% decrease in the percentage of students testing below proficient in math (p < 0.001, Table 3-A1), and a 0.012% drop in the percentage of students testing below proficient in language arts (p < 0.05, Table 3-B1).
Generalized Estimating Equation Results Predicting Percentage of Third-Grade Students Testing Below Proficient in (A) Math and (B) Language Arts in Utah Public Primary Schools (n = 464, n = 325, Respectively) During the 2015–2016 School Year
Both models used an unstructured working correlation matrix with a normal distribution and an identity link function and accounted for clustering with median age of housing stock and school district. All continuous variables were standardized.
Factor comprised: Title 1 school eligibility, percentage with FRPM, percentage Hispanic students, and percentage non-Hispanic minority students.
p < 0.05, **p < 0.01, ***p < 0.001.
Figure 4 shows the estimated marginal means for below proficient in math and language arts at each decile of canopy cover (1000 m). When assessed at 500 m, the effect of a standard deviation increase in canopy cover was nearly equivalent at a 0.016% (p < 0.001) decrease in math and a 0.011% (p < 0.05) decrease in language arts.
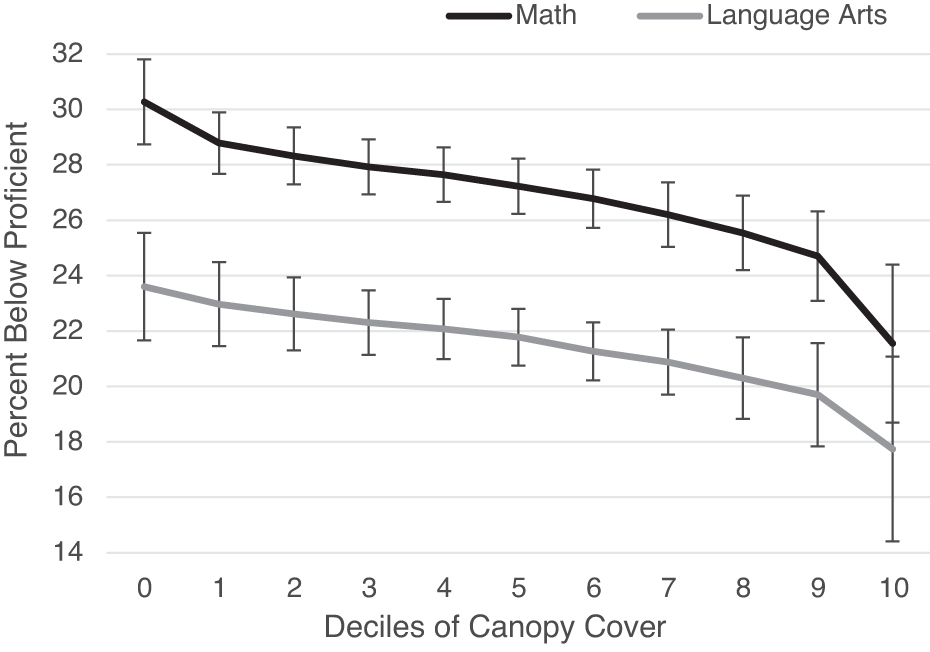
Graph of estimated marginal means and their 95% confidence intervals for below proficient in math and language arts per decile of canopy cover (1000 m) derived from model results in Table 2.
In the model including canopy cover at 1000 m, a one standard deviation increase in school social disadvantage was significantly associated with a 0.83% increase in the percent of students testing below proficient in math (p < 0.001, Table 3-A1), as well as a 0.54% increase in the percentage below proficient in language arts (p < 0.001, Table 3-B1). Each one standard deviation increase in peak PM2.5 was significantly associated with a 0.016% increase in the percentage of students testing below proficient in math (p < 0.05); peak PM2.5 was not significantly associated with language arts proficiency (p = 0.47). Those findings were nearly identical in the model incorporating canopy cover at 500 m, as shown in Table 3 (A2 and B2).
Urban–rural sensitivity analysis
As in the full model using all schools (n = 464 [math], n = 325 [language arts]; Table 3), school disadvantage (p < 0.05) was positively associated, and canopy cover (1000 m) (p < 0.05) was negatively associated, with reduced proficiency in math in both urban (n = 381) and rural schools (n = 83); this was also the case when canopy was assessed 500 m with the exception of math proficiency (p = 0.11).
When looking at language arts, school disadvantage (p < 0.05) was positively associated, and canopy cover (500 and 1000 m) (p < 0.05) was negatively associated with reduced proficiency in language arts in urban (n = 275) and rural (n = 50) schools as it was in all schools. Although peak PM2.5 (p < 0.05) was positively related to reduced proficiency in math in rural schools and all schools, it lost significance for urban schools.
County clustering sensitivity analysis
As in the full model using school district clusters (Table 3), increasing school disadvantage was positively associated with reduced proficiency in math (p < 0.001) and language arts (p < 0.001), and canopy cover (at 500 and 1000 m) was negatively associated with reduced proficiency in math (p < 0.05) and language arts (p < 0.05) when considering county clustering (n = 25 counties when predicting math and n = 22 counties when predicting language arts). Unlike results shown in Table 3 (A1-A2), peak PM2.5 was not a significant predictor of math proficiency (positive coefficient, p < 0.30) when accounting for clustering by county.
Research objective 3
Interactions between canopy cover at 1000 m and peak PM2.5 were not statistically significant in the model predicting math (p = 0.143) nor in the model predicting language arts (p = 0.235). The interactions were also not significant when using 500 m (p = 0.099 for math and p = 0.218 for language arts) (tables not shown). Results suggested that the effects of peak PM2.5 on reduced proficiency were stronger when canopy cover was low versus high, but not significantly.
Urban–rural sensitivity analysis
The interaction between peak PM2.5 and canopy cover (1000 m) was not significant for all schools (n = 464), rural schools (n = 83), or urban schools (n = 381) when predicting math. Though not significant in all schools (n = 325) or rural schools (n = 50), the interaction between peak PM2.5 and canopy cover was significant (p = 0.03) in urban schools (n = 278) for language arts. The finding showed that when schools have high peak pollution, those with high canopy cover have lower percentages of students below proficient in language arts than those with low canopy cover.
Though not significant for all schools or urban schools (at 1000 m or 500 m), the interaction between peak PM2.5 and canopy was significant for math proficiency in rural schools when canopy was assessed at 500 m (p < 0.01), but not 1000 m. The finding followed the same pattern as noted for language arts described earlier.
County clustering sensitivity analysis
As in the analysis using school district clustering, none of the interaction terms between peak PM2.5 and canopy cover (500 m or 1000 m) were statistically significant (p > 0.05) when predicting math or language arts proficiency.
Interaction with school disadvantage sensitivity analysis
Interactions between school disadvantage and canopy cover (500 and 1000 m) were not statistically significant when predicting proficiency in math or language arts (p > 0.05) as per the same model specifications used in the Table 3 results.
DISCUSSION
For our first research objective, we found evidence of an environmental injustice with respect to canopy cover as greater school social disadvantage was significantly associated with reduced canopy cover in this Utah-based, state-wide study. We found the same significant pattern in urban and rural schools, with the exception of rural schools when canopy was assessed at 1000 m, and under an alternative clustering definition. One of the only studies to examine a similar measure of school social disadvantage also found a negative and significant bivariate correlation between school social disadvantage and trees around the school in Chicago. 55
We found a similar relationship in a multivariable model applied in a state-wide analysis. This finding demonstrates a clear pattern of distributive environmental injustice, especially considering the myriad of benefits of greener schools including health benefits, 56 mood enhancement, 57 and reduced stress among children. 58
We also found that Utah primary schools with larger enrollments had significantly less canopy cover. This is likely because schools serving larger student bodies have bigger parking lots and larger playing fields, which reduce the canopy cover near the school. The school enrollment coefficient is larger in the model predicting canopy cover at 500 than 1000 m, lending credence to this explanation as those areas would occupy a larger percentage of a smaller buffer.
As per our second research objective, we found that greater canopy cover was associated with lower percentages of students testing “below proficient” in math and in language arts. Findings were robust to urban versus rural context (with the exception of canopy cover (500 m) for math in urban schools) and clustering definition. Kweon et al. 59 also found positive significant effects of tree cover on math and language arts proficiency in their study in Washington, DC when accounting for economic deprivation, although others have found significance for one subject and not the other, 60 or no effects. 61 For math specifically, the magnitude of the protective effect of a standard deviation in canopy cover (assessed at 1000 m or 500 m) was equivalent to the magnitude of the risk effect of a standard deviation increase in peak PM2.5.
In terms of why canopy cover might be associated with small boosts in student performance, the Attention Restoration Theory (ARA) 62 and Stress Recovery Theory (SRT) 63 suggest potential mechanisms. The ARA posits that exposure to nature initiates an “effortless” attention response and provides the brain with a respite to recover from deliberate attention efforts. 64
The SRT suggests a similar pathway of exposure to nature providing a rejuvenating, not just nondepleting, experience that reduces levels of stress. 65 Research has demonstrated that classrooms with views of greenery improve students' concentration levels and reduce stress. 66 Better concentration, longer attention spans, and reduced stress are associated with better academic performance, 67 and thus might be important mechanisms linking exposure to greenspace and improved academic performance.
School social disadvantage had a larger effect on academic proficiency than either environmental predictor. However, the negative association between school disadvantage and canopy cover was indicative of environmental injustice. Clearly, the interrelationships between school disadvantage, canopy cover, and academic outcomes are complex and reflect the intertwined nature of racial, economic, and environmental injustice.
When accounting for environmental and social inequalities—rather than demonstrating that one factor is important and others are not—results from such analyses highlight the multiple forms of jeopardy that affect communities. 68 For example, Pearce et al. 69 concluded their study about environmental injustice and mortality in the United Kingdom by asserting that, to address geographic inequalities in health, efforts should first be directed toward redressing social disparities as opposed to unequal environmental conditions. Our findings also speak to the importance of addressing socioeconomic and racial/ethnic disparities in educational opportunities and outcomes.
In terms of the third objective, canopy cover at schools did not significantly moderate the negative effects of peak PM2.5 on academic proficiency at Utah schools. Instead, greater canopy cover was associated with reduced percentages of children testing below proficient, regardless of the level of PM2.5. Exceptions to this emerge in the urban–rural sensitivity analysis, as the interaction is significant for language arts in urban schools and for math in rural schools (only with canopy cover assessed at 500 m).
These inconsistent interaction findings may be due to some of the complexities associated with how trees are implicated in cleaner air. 70 One important issue is that the removal of particulate matter by trees can simultaneously enhance air quality at a regional scale, but reduce air quality at a local scale. This is because treed areas near particulate matter sources such as roadways can reduce local air quality by trapping particulates. 71
Other studies have shown that the amount of air pollution that trees remove from the air is relatively small. In Greater London, the urban canopy removes ∼1% of PM10 72 and in Strasbourg, it is estimated at 7%. 73 The null finding in this study may reflect the heterogeneity across the statewide study area such that trees were trapping PM2.5 near some schools and reducing PM2.5 near other schools, and/or that the moderating effect was too small to capture in this ecological study.
Limitations
Although our statewide scope is a strength, it means that school-level standardized testing measures are the best metric for assessing academic proficiency. However, there are issues with utilizing standardized tests as a measure of students' academic capacities. 74 Future research with greater access to in-field resources may aim at mitigating the deficiencies in standardized testing measures by gathering and assessing data on other, more nuanced measures of mental fitness (e.g., kinetic learning, artistic creativity, executive functioning).
We focused on third-graders as they were the youngest students for whom standardized test scores were available, but future research should consider examining multiple grades. Sivarajah et al. 75 found that standardized tests administered in third grade had much stronger socioeconomic effects than those administered in sixth and they found significant associations between canopy cover and sixth-grade performance metrics.
In addition, although we used a state-of-the-art tree canopy coverage dataset, 76 it assesses only spatial coverage of canopy and does not provide information on the type, quality, or local access to canopy resources. The areas captured in our tree canopy cover buffers may or may not be walkable from schools, well maintained, or particularly safe for children to explore. The measure also does not distinguish between deciduous and coniferous canopy and it pertains to summer cover. A seasonally refined metric that would capture coniferous tree cover during the winter would improve upon the current measure. We are also studying data aggregated to the school, which limits the generalizability of our findings to individual children. 77
CONCLUSION
Increasing tree canopy coverage surrounding socially disadvantaged schools could be a first step to addressing the distributional environmental injustices uncovered here. This must be done with input from the surrounding community because, in some EJ communities, residents have expressed concern about greening efforts leading to green gentrification, safety issues, and unwanted wildlife. 78 However, planting even just a few trees can increase the green cover around schools due to trees' large canopies. 79
Tree planting must be done with the utmost care. It is essential to pick the right tree, which involves considerations of species' characteristics (e.g., full size) and maintenance requirements, 80 for the right space (e.g., some spaces lack adequate soil volume because they are too narrow 81 ) to promote tree health and longevity. Proper planning can alleviate the common problem of tree roots causing extensive damage to pavement, which is a common cause of tree removal. 82 Municipalities provide regulations and guidelines for tree planting.
For example, in Salt Lake City, UT, trees planted in the public right of way require a permit, must be a minimum of 2″ caliper in size, and must be a specific distance from other landscape features (e.g., 30′ from a stop sign and 20′ from intersecting sidewalks). 83 Tree planting around schools is often done through contracts with landscaping firms that include regular care and maintenance, and the replacement of trees in case of death during a specified period.
Students can also be involved in tree planting, although this can be difficult to implement successfully due to the large size of young trees relative to the small stature of students, among other considerations. However, there are ways to involve students in greening efforts, for example, by planting tree seedlings and caring for them until they are large enough to plant 84 and through citizen ecological science at school, 85 which could be extended to research on newly planted trees.
The associations we found between greater canopy coverage and decreased percentages of students testing below proficient on standardized tests support the need for experimental research to test the efficacy of tree planting interventions for educational benefits. 86
As municipal policymakers, urban planners and the educational community seek to increase the greenspace at schools, which is happening worldwide (e.g., International School Grounds Alliance) and in the United States (e.g., Green Schoolyards American), 87 they must consider EJ in their decision making to avoid perpetuating or exacerbating disparities in access, such as those documented here. Baró et al. 88 provide specific recommendations. They suggest that school greening initiatives should not only prioritize those schools with the least exposure to natural environments (both within and around school settings), but also consider aspects related to the social marginality of the schoolchildren.
In Utah, these schools include those serving predominantly lower income and racial/ethnic minority student bodies and schools with larger enrollments. Due to the many health benefits that tree canopy cover offers, it should be equally accessible across socioeconomic and racial/ethnic divides within Utah schools. Baró et al. 89 also recommend that municipal and education authorities should use public funds to cover outdoor education activities, especially for schools located in less green environments, as a compensatory mechanism to ensure access to green space benefits for all children. Finally, they assert that school greening projects must be shaped by a just participatory process that includes all voices in school communities, including those of children. 90
We believe research on canopy cover, distributional environmental injustice, and academic proficiency is critical as tree cover is a readily modifiable factor at the school level that can be harnessed to achieve EJ. Student academic proficiency is associated with future academic and economic success. Students who cannot read proficiently by the third grade are four times more likely to exit school without their high school diplomas than more proficient readers. 91
Population-level reductions in academic proficiency among schoolchildren can potentially slow economic productivity and societal progress. 92 Since tree canopy cover has the potential to contribute to student well-being with very few drawbacks (e.g., increased production of allergens, increased water use), it warrants additional attention from research scholars, public school administrations, and state legislators.
Footnotes
AUTHORs' CONTRIBUTIONS
S.E.G.: Methodology (lead), formal analysis (lead), conceptualization (equal); writing-original draft (supporting); writing-review and editing (lead). A.G.: Writing-original draft (lead); formal analysis (supporting), conceptualization (equal); C.M.: Formal analysis (supporting), conceptualization (equal); writing-review and editing (supporting). T.W.C.: Conceptualization (equal); writing-review and editing (supporting). S.N.: Formal analysis (supporting). A.M.: Writing-review and editing (supporting).
DISCLAIMER
The content is solely the responsibility of the authors and does not necessarily represent the official views of the National Science Foundation or the National Institutes of Health.
AUTHOR DISCLOSURE STATEMENT
The authors report no conflicts of interest.
FUNDING INFORMATION
Research supported in this article was supported by the National Science Foundation, through a Research Experiences for Undergraduates Supplement to CMMI-1760655, and by the National Institute of General Medical Sciences of the National Institutes of Health under linked Award Numbers RL5GM118969, TL4GM118971, and UL1GM118970.