
Abstract
Background:
Lead poisoning can severely affect neurological development in small children. Communities with environmental justice (EJ) concerns often face higher levels of lead exposure through multiple routes of exposure. School-aged children can be exposed to lead at their schools through the deposition of lead emissions onto soil over time.
Methods:
Public school students' demographics in “proximate schools”; those within 1.5 km of facilities with lead emissions were compared with other schools in their area. The average proximate emissions per student were calculated for different demographic groups in various geographic areas.
Results:
Schools in combined statistical areas (CSAs) within 1.5 km of lead facilities were found to be composed of significantly more Black (22%) and Hispanic (30%) students than other schools in the area (17% and 26%, respectively). Meanwhile, schools close to lead sources tended to have smaller proportions of White students (37% in “proximate schools,” but 47% overall. When average emissions around students were calculated for a handful of CSAs, inequality in lead exposure could be seen in almost every geographic area, across income and racial lines.
Discussion:
Students of color consistently faced the highest emissions in every area, although amounts, inequities, and at-risk populations differed throughout the different geographic areas.
Conclusion:
The unique history of each location regarding immigration, discrimination, zoning laws, urban sprawl, and industrial past can contribute to this variety in inequities. These findings are not only consistent with EJ trends but also highlight other vulnerabilities for students such as age and food security.
INTRODUCTION
Environmental justice
Environmental Justice (EJ) includes the goal of fair treatment in that “no group of people should bear a disproportionate burden of environmental harm and risks.” 1 However, studies have shown that neighborhoods populated by people of color and low-income families face greater rates of exposure to lead and other harmful industrial chemicals. 2 Homes in low-income neighborhoods are more likely to have deteriorating lead-based paint due to older age and lack of repairs and renovation. 3 In addition, segregated housing contributes to a plethora of EJ concerns such as higher levels of exposure to multiple hazardous chemicals through the placement of industrial waste sites and other facilities as well as highways and airports. 4
Another national study showed that Black students were much more likely to attend “high risk” schools, those with several sources of neurotoxicant emissions nearby. 5 This research demonstrates that communities of color tend to face greater lead contamination not only in their own homes but also from external sources such as highways and industry. Consistent with their proximity to lead sources, studies have shown that elevated blood lead levels (EBLLs) are more likely to be reported among Black children compared with any other racial/ethnic group. 6 These inequalities are not explained by geographic distance and socioeconomic status alone but point to a systemic problem of racial inequality in hazard exposure. 7
Health impacts
Lead specifically has been known to cause severe health effects since very early in human history. Lead poisoning has been linked to higher rates of heart conditions, kidney failure, memory and concentration issues, joint pain, pregnancy complications, as well as a host of other health issues. 8 Neurological impacts are known to be worse for children, especially around ages 1–5. Children absorb lead at much higher proportions than adults and are especially vulnerable due to their active neurological development. In cases of malnutrition, lead also replaces calcium in the bones, meaning that lead in skeletal systems can cause poisoning even after lead sources are removed. 9 Even small amounts can cause long-term harm in children, as there is no known safe amount of lead for humans, especially children. 10 The Center for Disease Control recently established the threshold for EBLLs as >3.5 μg/dL. 11
Children with EBLLs, typically through lead ingestion, have been known to suffer a series of neurological issues, such as lower intelligence quotient (IQ) scores, as well as impulse control issues, which can cause attention-deficit hyperactivity disorder or other learning disabilities. 12 In addition, high rates of EBLLs have been correlated to increases in violent behaviors and crime rates in adulthood. 13 These effects have a high cost on individuals, by limiting their potential, as well as a high societal cost in the form of increased medical costs, special education, lost tax revenue, as well as crime prevention and prosecution. 14 It is important to note that recent studies have shown that the duration of exposure, rather than age at the time of exposure has a stronger correlation with the severity of outcomes. 15 Children who are removed from lead sources show immediate signs of improvement in IQ and other behavioral issues. 16
Soil contamination linked to EBLLs
Although ambient lead concentrations near lead-emitting facilities rarely exceed the federal threshold established by Clean Air Act's Lead National Ambient Air Quality Standards Act, lead particles deposit on the soil over long periods of time. 17 In addition, industrial and residential areas near the facilities may not be tested for soil contamination until long after closure. Even when soil testing shows increased lead concentrations, not all sites meet the 400 ppm requirements needed to be considered for remediation through the Superfund program, despite research showing that lower concentrations of lead in soil are still linked to EBLLs. 18
Previous studies have linked EBLLs in children to high concentrations of lead in the air and soil around their homes. 19 These students are not just exposed to lead during time spent playing outside on potentially contaminated playgrounds, but continuously, as contaminated soil from the environment is repeatedly introduced to inside spaces through shoes, clothes, skin, and hair. In an urban case study of lead pathway contributions, Environmental Protection Agency (EPA, 2007) estimated that 20.5% of Pb exposure came from diet, 11.9% from drinking water, 43.7% from outdoor soil/dust, 23.7% from indoor dust, and 0.1% from air by inhalation of average annual uptake until child is 7 years old. 20
However, more research is required to understand direct proportions of exposure from active lead emissions as opposed to existing legacy contamination. Schools and facilities are relatively long-term institutions, thus the dangers to schools already located in proximity to sources of lead will only increase over time. In addition to the bioaccumulation of lead taking place within children, new students attend a school every year, further expanding the impact of these facilities over time.
This is the first national-scale assessment of lead emissions source proximity to public schools in the context of potential exposures to lead soil deposition. A similar national study has been conducted focusing on public schools and exposure sources for neurotoxicants 21 ; however, the recent focus on lead means that more precise data on lead sources are necessary. Since the Flint water crisis, lead is viewed as a national issue because children are directly exposed to lead through multiple media, including water, housing paint, and industrial sources. This study observes only industrial sources but should be understood in the wider context of lead sources in the lives of children. Students facing the same amounts of nearby emissions in their schools can have a wide array of outcomes depending on their age, behavior, nutritional status, medical access, and home lead exposure. More attention, understanding, and solutions are required for all students to receive a safe and free education.
METHODS
Data sources
Lead air emissions data from lead-emitting facilities were collected from EPA's National Emissions Inventory (NEI) point for 2017. 22 The NEI is compiled based on data collected by the states and tribal air agencies, reporting all emissions within their jurisdiction, then supplemented by relevant federal EPA data. As the NEI data are collected every 3 years, 2017 was the most recent quality-assured data available for leaded air emissions (EPA 2020). 23 However, there is always uncertainty regarding inaccuracies in emissions factors for data collected in emissions inventories. Multiple emission points were aggregated to represent each facility with a single point.
Emissions for each facility also had to meet a threshold of 0.01 lbs/year to ensure that only relevant sources were used to determine cumulative risk but continue to capture 99.8% of reported emissions. Although most previous studies focused on Toxics Release Inventory (TRI) facilities, this study relied on NEI because not all lead sources are required to report to the TRI, such as mining and airports. TRI also has a 100 lbs activity threshold, so smaller sites that are captured by the NEI would not be included. Owing to unique requirements for each reporting program, the NEI provided more comprehensive data, specifically for lead air emissions.
This study used only publicly available information published by the Department of Education and included no personally identifiable information and thus exempt from approval by the International Review Board. The Common Core of Data (CCD) from the National Center for Education Statistics, from the 2017–18 academic year was acquired using the ELSi Table Generator. 24 These data included demographic information for schools, although it is important to note that some children can belong to multiple groups depending on their race/ethnicity, grade, and participation in the Free and Reduced Lunch Program (FRLP). Data sets also included geographic data for these schools such as the urban/rural designation of the school, school district, as well as whether the school is in a major combined statistical area (CSA).
CSAs are census units defined as metro areas with socially and economically associated surroundings. CSAs were chosen based on the largest total number of schools to provide the largest sample sizes. Virtual schools and adult education facilities were eliminated to focus the study on vulnerable school-aged children who are physically gathered in these schools. Data for racial demographics for each school divided students into Hispanic, Black, White, Native American, and Alaskan Native combined as Native American, Native Hawaiian, and Asian American and Pacific Islanders (collectively, AAPI), and students who identified as two or more races/ethnicities.
Data analysis
Using ArcGIS, facility and public-school data from NEI and the CCD, respectively, were represented using given coordinates. Based on a study used in EPA's 2014 Policy Assessment for the Review of the Lead National Ambient Air Quality Standard, buffers of 1.5 km were established around each NEI-reporting facility. 25 This subarea around a facility is most likely to attribute lead caused health issues to the facility emissions rather than other sources of lead. Although this study uses air emission data, the real risk to students comes from the continuous soil deposition from these sources creating contamination in their outdoor recreation areas and indoor learning environment. 26
Lead deposition inside or even outside this area may vary greatly depending on the release source, the height of the stack, and wind direction. However, extensive modeling for air deposition and re-entrainment factors is outside the scope of this study. It is important to understand that this analysis studies possible exposure to students due to proximate schools and lead facilities and is not a direct analysis of risk and lead absorption. This study assumes air deposition of lead accumulates over time, either due to historic proximity or in the future due to their continued colocation.
Schools that were within buffer zones of a facility were determined “proximate schools” and demographically compared by composition with other schools in the geographic area. The comparison was done through a t-test of student proportions in the schools, with a significance level for the p-value of 0.05 or below using SciPy 1.7.1. 27
Since emissions data were linked to schools' location within one or more buffer areas around a facility, average emissions for individual students in a CSA were determined by the following equation:
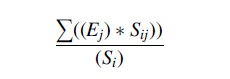
where Ej is the Pb emission rate in lbs/year of facilities with 1.5 km buffers that included the school j. Sij is students in a demographic category i (total, preschool/kindergarten, race, and school lunch status) in school j in the CSA. And Si is the total number of students in a demographic category in the CSA.
The correlation between school demographics and the combined emissions in their 1.5 km area is represented by bivariate analysis, using SciPy 1.7.1. Another bivariate analysis was performed to observe the relationship between the proportion of non-White students attending a school with the proportion of students enrolled in the FRLP.
This study performed analysis on schools located in “Large Cities” as defined by CCD data since soil lead levels are known to be highest in urban areas. 28 In addition, lead deposition can have the highest impact in urban settings where distances from facilities are smaller, population concentrations are larger, thus the possible impact on communities is greater. 29 To understand these urban centers within a larger context, analysis was performed at the CSA level as well, referred to in this article by their principal large city but includes the surrounding suburbs and small towns. This allows for comparison of schools that are geographically close and thus similar in history, development, legislation but may serve very different communities and have different proximate distances to industry.
RESULTS
Table 1 shows that schools within the 1.5 km area of a lead facility tend to have a higher proportion of Black students and a significantly lower proportion of White, AAPI, and two or more race students than the average city school. This signifies that urban schools with more Black students are more likely to be located within 1.5 km of a lead-emitting facility, whereas schools with more White students will be located further away from lead-emitting facilities. Students qualifying for the FRLP make up significantly higher proportions of schools within proximity to lead-emitting sources. Since this program is based on the income level of the student's family, this measure can also be used to observe the socioeconomic status of the student, as well as food insecurity and higher vulnerability to lead absorption due to malnutrition. 30
Average Demographic Composition of All Schools in “Large Cities” Compared with Only Those Within Proximity of a Lead Facility
AAPI, Asian American and Pacific Islander.
Table 2 shows the exaggeration of this effect when incorporating surrounding areas changes the demographics of the overall student population toward more White students, and fewer Black and Hispanic students, who make up smaller percentages of these outskirt schools. Hispanic students make up almost 40% of the average school in a large city but only 26% of their schools in the larger area of a CSA. Proportions of Black students are similarly decreased once the larger areas are considered. The proportion of White students at an average school more than doubles when comparing urban schools with those in the overall geographic area.
Average Demographic Composition of All Schools in a Combined Statistical Area Compared with Only Those Within Proximity of A Lead Facility
However, the changes in the demographics from urban centers to surrounding areas do not change the demographics of those affected by lead emission proximity. “Proximate schools” are much more likely to have a higher proportion of Black and Hispanic students and a significantly smaller percentage of White students, despite the increase in the proportion of White students in the CSA overall. Meanwhile, the inclusion of surrounding areas means that there is a decreased proportion of students on a Lunch Program, but despite lower representation overall, still make up a significantly larger proportion of “proximate schools.”
The increased representation of FRLP students and students of color in lead proximate schools does not directly translate to those schools facing higher emissions. A regression correlating the proportion of non-White students and the emissions from nearby facilities results in the nonsignificant r2 value of 0.0004. Even analysis on a subset of schools facing the highest emissions, those >500 lbs/year, does not show a significant correlation between nonstudents and emissions from nearby facilities.
This contrasts with the data from aforementioned in that although schools close to lead sources tend to have higher proportions of Black students, and fewer White students, this does not seem to correlate with the total amount of emissions coming from those sources. Schools with a high level of diversity may be located to lead sources more frequently, but perhaps not closest to the highest emitters. This analysis also focuses on the school level exposure to lead sources, not the individual students, which can be skewed by varying school sizes and does not mean that individuals belonging to those demographic groups are not being impacted differently.
Figure 1 focuses on emissions for students by demographic group rather than by the school level. Proximate lead emissions per student nationally average about 4 lbs of lead emitted around their school every year as seen in the group “All CSA,” with very little variation between demographic groups. However, this national average hides the wide variability of exposure based on geographic location. Areas such as Chicago, Twin Cities, and San Jose have the highest amounts of lead per student, whereas DC, Boston, and Detroit have less than half the national average.
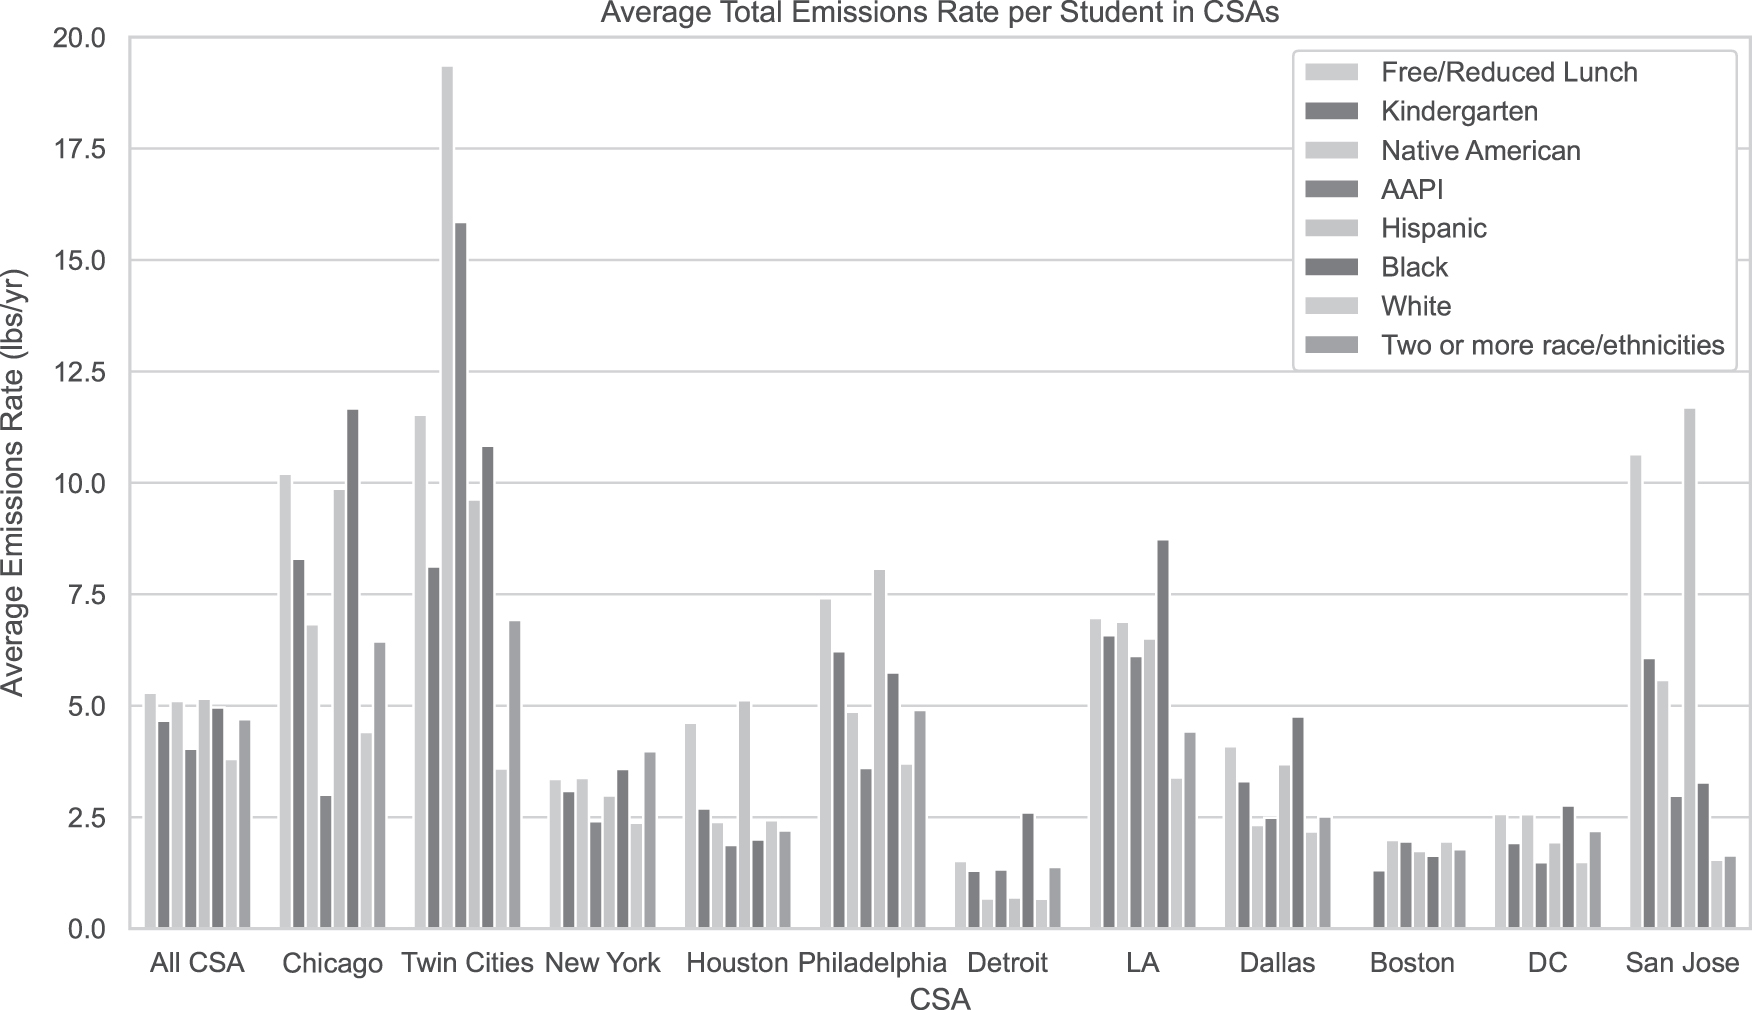
Total average emissions rate in proximity per student, with each combined statistical area divided into its demographic categories.
However, emissions not only differ between different cities but within them as well. Although variability is small when looking at the national averages, each city has a unique profile that reveals specific inequalities. Nationally, as well as in every CSA, White students face smaller amounts of lead emissions near them than the average for their area. Black and Hispanic students are regularly exposed to larger amounts of lead than their peers, with notable exceptions in the Twin Cities, where Native American students face the largest amounts of lead. And finally, another vulnerable population deserves special focus; students qualifying for FRLP face higher emissions per student in every single CSA, except Boston, for which there are no data.
Students who attend schools with more students identifying as non-White are much more likely to have a high proportion of classmates on the FRLP (Fig. 2). Students qualifying for the FRLP can also be indicators of an additional vulnerability: food insecurity. 31 Children with malnutrition are more likely to have increased lead uptake due to the lack of calcium in their systems. 32 Therefore, depending on their geographic location and race/ethnicity, these same students might not only face higher rates of lead deposition at their school but also be more likely to absorb lead at higher rates than their peers and face more serious outcomes.

Percentage of non-White students attending a school compared with the percentage of students who qualify for the Free and Reduced Lunch Program. Each point represents a single public school.
DISCUSSION
The results of this study show that inequalities in exposure exist across geography and income level and show the effects of a long history of systemic environmental racism. The resulting inequities in lead exposure align with the evidence provided in EBLL data and suggest air deposition and soil contamination as consequential vectors for lead poisoning. 33 Non-White populations have been concentrated in urban areas following high demands for labor, housing segregation, chain migration, and suburbanization of White families in the past century. Given the high levels of industry within these cities, higher lead exposure in urban centers is an expected correlation. 34 However, even within cities, segregation plays a clear role in the inequality of lead exposure. 35
Black children and those who qualify for the FRLP make up a larger proportion of student populations in “proximate schools” to lead facilities within cities. This outcome is consistent with previous studies showing that Black children have higher rates of EBLLs, possibly related to the higher depositional lead proximity compared with their White peers with lower lead exposure. 36 Larger geographic areas such as the CSAs, with more extreme inequalities, might be explained by factoring in urban housing discrimination along with the suburbanization of White families. Black and Hispanic students are not only more likely to attend schools near lead sources in larger cities and face higher emissions as individuals but are also more likely to experience high absorption rates due to food insecurity.
AAPI students as well as students of two or more races/ethnicities contend with a mixed level of exposure depending on their location. Native Americans and Alaskans face a similar mixed outcome, with no significant disproportionate impact in urban areas, but make up a smaller proportion of lead proximate schools in CSAs. However, there are some exceptions, such as Native American lead exposure in the Twin Cities, which is more than double the area's average. Although students of color face higher levels of lead proximity in different locations, White students were more removed from lead emissions, even when located in dense urban areas. This indicates that some level of distance from industry is possible for all children if larger systemic issues are addressed.
Based on the data presented in Figure 1, different geographic areas encounter different levels of potential lead exposure when compared with each other, but there are also inherent inequalities within the areas themselves. The results for “All CSAs” show that national average emissions in proximity to students are relatively consistent along different racial groups at 4 lbs/year, consistent with the nonsignificant correlation between the proportion of non-White students and emissions near a school. However, CSAs have different demographic compositions, levels of segregation, regulations for industry and school locations, types of industry, and levels of urban sprawl; all of which affect students' potential exposure to lead. CSAs for Chicago, the Twin Cities, and San Jose have the highest amounts of lead exposure per student, most likely due to their industrial focus.
However, inequality looks very different in these areas. Although Chicago has the highest emissions rate on average, Black and Hispanic students are exposed to more lead emissions from facilities than the rest of their peers. Meanwhile, the Twin Cities have almost double the exposure levels as the national average for all groups except White students, who face the same if not less than the national average. In Minnesota, Native American and AAPI students face the highest levels of lead emissions near their schools. In the San Jose area, Hispanic students confront almost double the amount of lead emissions in proximity than their peers. Detroit, despite its industrial past, seems to have very low levels of lead emissions near schools, which might be due to industrial zoning regulation, leading to more distance rather than low emissions.
Different industrial histories pair with histories of segregation, discrimination, and immigration that tell a unique story of environmental racism in each part of America. These findings also indicate that solutions will need to be tailored to each geographic area, level of industry, urban sprawl, and non-White populations. Areas with the lowest emissions per student and most equitable distributions of emissions such as Boston and DC might also provide opportunities to examine if local zoning policies and decision making have led to reduced lead exposure. In these results, we can see that inequalities in hazard exposure are a national issue despite variability in the extent and the affected populations.
This study shows that EJ concerns not only play a role in lead deposition exposure but also are concerningly present in the lives of young children. The combined results of Figures 1 and 2 show that inequality is tied to the geographic location, race/ethnicity, income, and food security identities of students. These different factors not only contribute to their hazard risk but also the outcomes given other possible sources of lead exposure, medical access, and educational support. Future research can focus on understanding the full extent of the links between segregated housing and other symptoms of systemic racism and observed trends in children's lead hazard proximity. Research into the specific histories of each CSA might help to identify the systemic issues that can then be addressed more precisely.
CONCLUSION
Protecting children from industrial lead sources is an enormous step in creating equitable futures for all children in America. Studies have shown that differences in BLLs might be the root cause for testing gaps between Black and Hispanic children and their White peers. 37 Some studies have shown that lead poisoning can also contribute to economic inequality through discounted lifetime earnings, sick days, special education, medical costs, as well as the financial instability caused by incarceration. 38
Local legislation and communities should consider the siting of certain industries away from school zones to create safe learning environments, ensuring that children are attending schools at a distance from lead emitters, and prevent deposition contamination altogether. 39
However, creating zoning considerations does not solve the problem of existing facilities near schools, and further steps must be taken to reduce children's exposure. Findings can be shared with private industry to prompt participation in voluntary programs such as the Resource, Conservation and Recovery Act (RCRA) corrective action, RCRA's Pollution Prevention (P2), or air/soil monitoring. These programs encourage facilities to clean up contaminated sites, reduce emissions, or simply collect soil lead concentration data. An additional action for industry near schools has been suggested by the Truth Fairy project, a community group pushing for industry-funded BLL testing. 40 This removes the cost and burden of proof away from the community near the facility and allows for early detection of lead impact in children. 41 Early detection practices could allow parents, communities, and government to act swiftly to remove children from exposure to lead.
In addition to actions that can be taken at the federal, facility, and local levels, communities can also take steps to protect their children. Schools within proximity to lead sites should promote handwashing after time spent outside as well as before meals to mitigate risk but washing playground areas does not seem effective. 42 Schools with especially young children might encourage students to take off shoes before entering classrooms to minimize indoor contamination. 43 Finally, children's nutrition should be highlighted as another source of inequality for lead poisoning. Lunch programs near lead facilities should focus on calcium levels in their students and ensure that nutrition in other meals is protecting them from absorbing undue levels of lead. 44 Since primary education is a national mandate, students should be sent to safe and clean environments that assist with their development rather than damaging it.
This study has shown that lead contamination in close contact with schools does not affect all students equally and demonstrates the influence of systemic racism on hazard exposure. Students should be able to attend their local public school without concern about its possible health implications. By using known tools and resources to eliminate or reduce lead contamination, society can take a large step toward reducing inequality and protecting children.
Footnotes
AUTHORs' CONTRIBUTIONS
Conceptualization, data curation, formal analysis, methodology, software, visualization, and writing by B.O. Conceptualization, funding acquisition, methodology, project administration, supervision, validation, writing review, and editing by K.S.
ACKNOWLEDGMENTS
We would like to thank reviews from the EPA who greatly improved this article, including Alan Walts, Ed Nam, Steve Devito, Justin Coughlin, and Tim Barzyk.
AUTHOR DISCLOSURE STATEMENT
No competing financial interests exist.
FUNDING INFORMATION
The research described in this article has been funded wholly or in part by the United States Environmental Protection Agency Region 5 Land, Chemicals and Redevelopment Division. This research was supported in part by an appointment to the U.S. Environmental Protection Agency (EPA) Research Participation Program administered by the Oak Ridge Institute for Science and Education (ORISE) through an interagency agreement between the U.S. Department of Energy (DOE) and the U.S. Environmental Protection Agency. ORISE is managed by ORAU under DOE contract number DE-SC0014664.
All opinions expressed in this article are the authors' and do not necessarily reflect the policies and views of U.S. EPA, DOE, or ORAU/ORISE. All authors declare that at no time there were payments or services received from a third party (government, commercial, private foundation, etc.) for any aspect of the submitted work (including but not limited to grants, data monitoring board, study design, article preparation, and statistical analysis). The first author (B.O.) is a full-time ORISE Participant with the U.S. EPA and is funded by her ORISE Fellowship; the other author is a federal employee and is funded through that role, aside from these employment positions, there have been no other financial relationships (regardless of the amount of compensation) with a government agency, foundation, commercial sponsor, academic institution, and so on.