
Abstract
Background:
In the United States, most private wells are not tested for contaminants, especially in low-income communities, unless state or local testing regulations have been enacted. Few studies have addressed whether Black, Indigenous, and other People of Color (BIPOC) experience similar burden disparities in testing and private well stewardship.
Methods:
Focusing on four North Carolina regions impacted by 2018 hurricanes (Florence and Michael), researchers and community-based organizations partnered to assess: (1) contamination levels of metals in private wells and (2) differences in water quality and well stewardship among demographic groups.
Results:
Well tests revealed contamination exceeding a federal or state standard or public health goal in more than 67% of the samples. Of 476 private well users enrolled in this study, 44% (n = 209) had previously tested their drinking water, yet more than 58% (n = 192) reported having a treatment system installed. White, high-income households had over 10 times greater odds of testing their private wells, and over 4 times greater odds of treating their drinking water than BIPOC, low-income households.
Discussion:
In this study, private well testing and treatment levels were significantly predicted by race and income (p < 0.05). Although high contamination levels (67%) were equally distributed across the sample, the lack of private well testing and treatment means BIPOC, low-income groups may experience greater burden disparities in exposure to toxic metals in drinking water.
Conclusions:
Well-reliant populations in socially and economically marginalized communities will likely remain unaware of potential exposure to contaminated drinking water absent focused efforts to encourage well testing and treatment.
Introduction
One in four North Carolinians (2.4 million residents) rely on private wells for their drinking water—the highest number of households with wells in the nation. 1 Unlike public water utilities or community wells, private wells are not regulated under the federal Safe Drinking Water Act (SDWA), leaving the responsibility to test and treat the drinking water with the well user. 2 , 3 , 4 , 5 Without testing, it is difficult to identify contaminants in drinking water because many metals can be present without noticeable aesthetic qualities (e.g., taste, smell, and appearance). 6 There are well-known barriers to participation in well water testing, such as mistrust of government agencies, 7 cost, 8 a lack of perceived contamination, 9 optimism bias, 10 inconvenience, 11 and concerns about condemnation or reduced property values. 12 , 13
Among private wells that have been tested in the United States, up to 68% exceed at least one health-based standard. 14 , 15 , 16 , 17 Previous studies have documented significant levels of contamination in private wells in North Carolina (NC), including arsenic, 18 hexavalent chromium, 19 lead, 20 , 21 manganese, 22 and radium and radon. 23 Over time, drinking contaminated well water can produce severe adverse health outcomes, such as cancer and cardiovascular disease, 24 preeclampsia, 25 neurological disorders, 26 elevated blood lead levels, 27 , 28 , 29 and higher rates of waterborne illnesses compared with homes supplied with municipal water. 30 , 31
Redlining, racial segregation, and municipal underbounding in peri-urban areas have left many Black, Indigenous, and other People of Color (BIPOC) communities without access to public water systems and reliant on private wells for drinking water. 32 , 33 , 34 , 35 Studies have shown low-income and non-college educated communities have lower rates of private well testing and installation of water treatment devices. 36 , 37 , 38 , 39 Among studies reporting private well testing rates and demographics, most oversampled White and high-wealth homes. 40 , 41 , 42 , 43 , 44 , 45 , 46 Multiple localized case studies have assessed well water concerns in BIPOC communities, 47 , 48 , 49 , 50 , 51 , 52 , 53 , 54 , 55 highlighting trends of burdens disparities, 56 which our study explores at a larger scale.
Research on drinking water contamination and private well stewardship among groups experiencing disproportionate levels of pollution, 57 , 58 also known as environmental justice (EJ) communities, can help develop a better understanding of the health burdens facing many marginalized groups. Such research can also help direct policy interventions and community resources where they are needed most.
To explore how race and income influence access to safe well water in NC, we recruited participants from communities outside the boundaries of public water systems (referred to as well-reliant populations), with deliberate recruiting efforts within EJ communities (described below). Working with neighborhood leaders and community-based organizations (CBOs), the objectives of the study were to assess: (1) contamination levels of metals in private wells and (2) differences in water quality and well stewardship among demographic groups.
METHODS
We used Community Engaged Research (CEnR) strategies, with an emphasis on participatory science, to improve recruitment in EJ communities. 59 , 60 , 61 , 62 , 63 Central to CEnR is a bidirectional collaborative process, 64 whereby researchers, CBOs, and neighborhood leaders deliberate on research designs, prioritize impacted communities, and codevelop appropriate communication strategies. 65 In addition to the co-creation of knowledge, CEnR can benefit from participatory science or “citizen science” approaches, such as self-sampling, which embeds community volunteers directly in the research process. 66
Such strategies can improve recruitment, establish a sense of ownership among study participants, increase sample size, 67 and build a sense of procedural justice necessary to increase trust and acceptance of the results. 68 This study combined participatory science sampling with door-to-door canvassing to enhance recruitment from EJ communities. Finally, CEnR also requires “reporting back” of research results, when researchers return to the community to share findings with study participants and interested stakeholders. 69 Sharing study outcomes with the community can help participants understand the results, 70 motivate health-protective behaviors, and strengthen community-academic partnerships. 71
Focus regions
From October 2018 to January 2020, we focused private well sampling projects in four central and eastern NC counties (Robeson, Northampton, Chatham, and New Hanover), all of which were impacted by the 2018 Hurricanes Florence and/or Michael. 72 Community partners helped direct recruiting in each focus county where, in addition to hurricane flooding, residents in specific neighborhoods raised concerns about potential exposure to coal ash waste (including impoundments, landfills, or structural fills.) 73 In addition to door-to-door canvasing in these small neighborhoods (<50 houses), the study team also accepted well samples from other households throughout the county, as well as nine bordering counties (Bladen, Brunswick, Columbus, Hertford, Lee, Orange, Pender, Scotland, and Wake Counties) (Fig. 1).
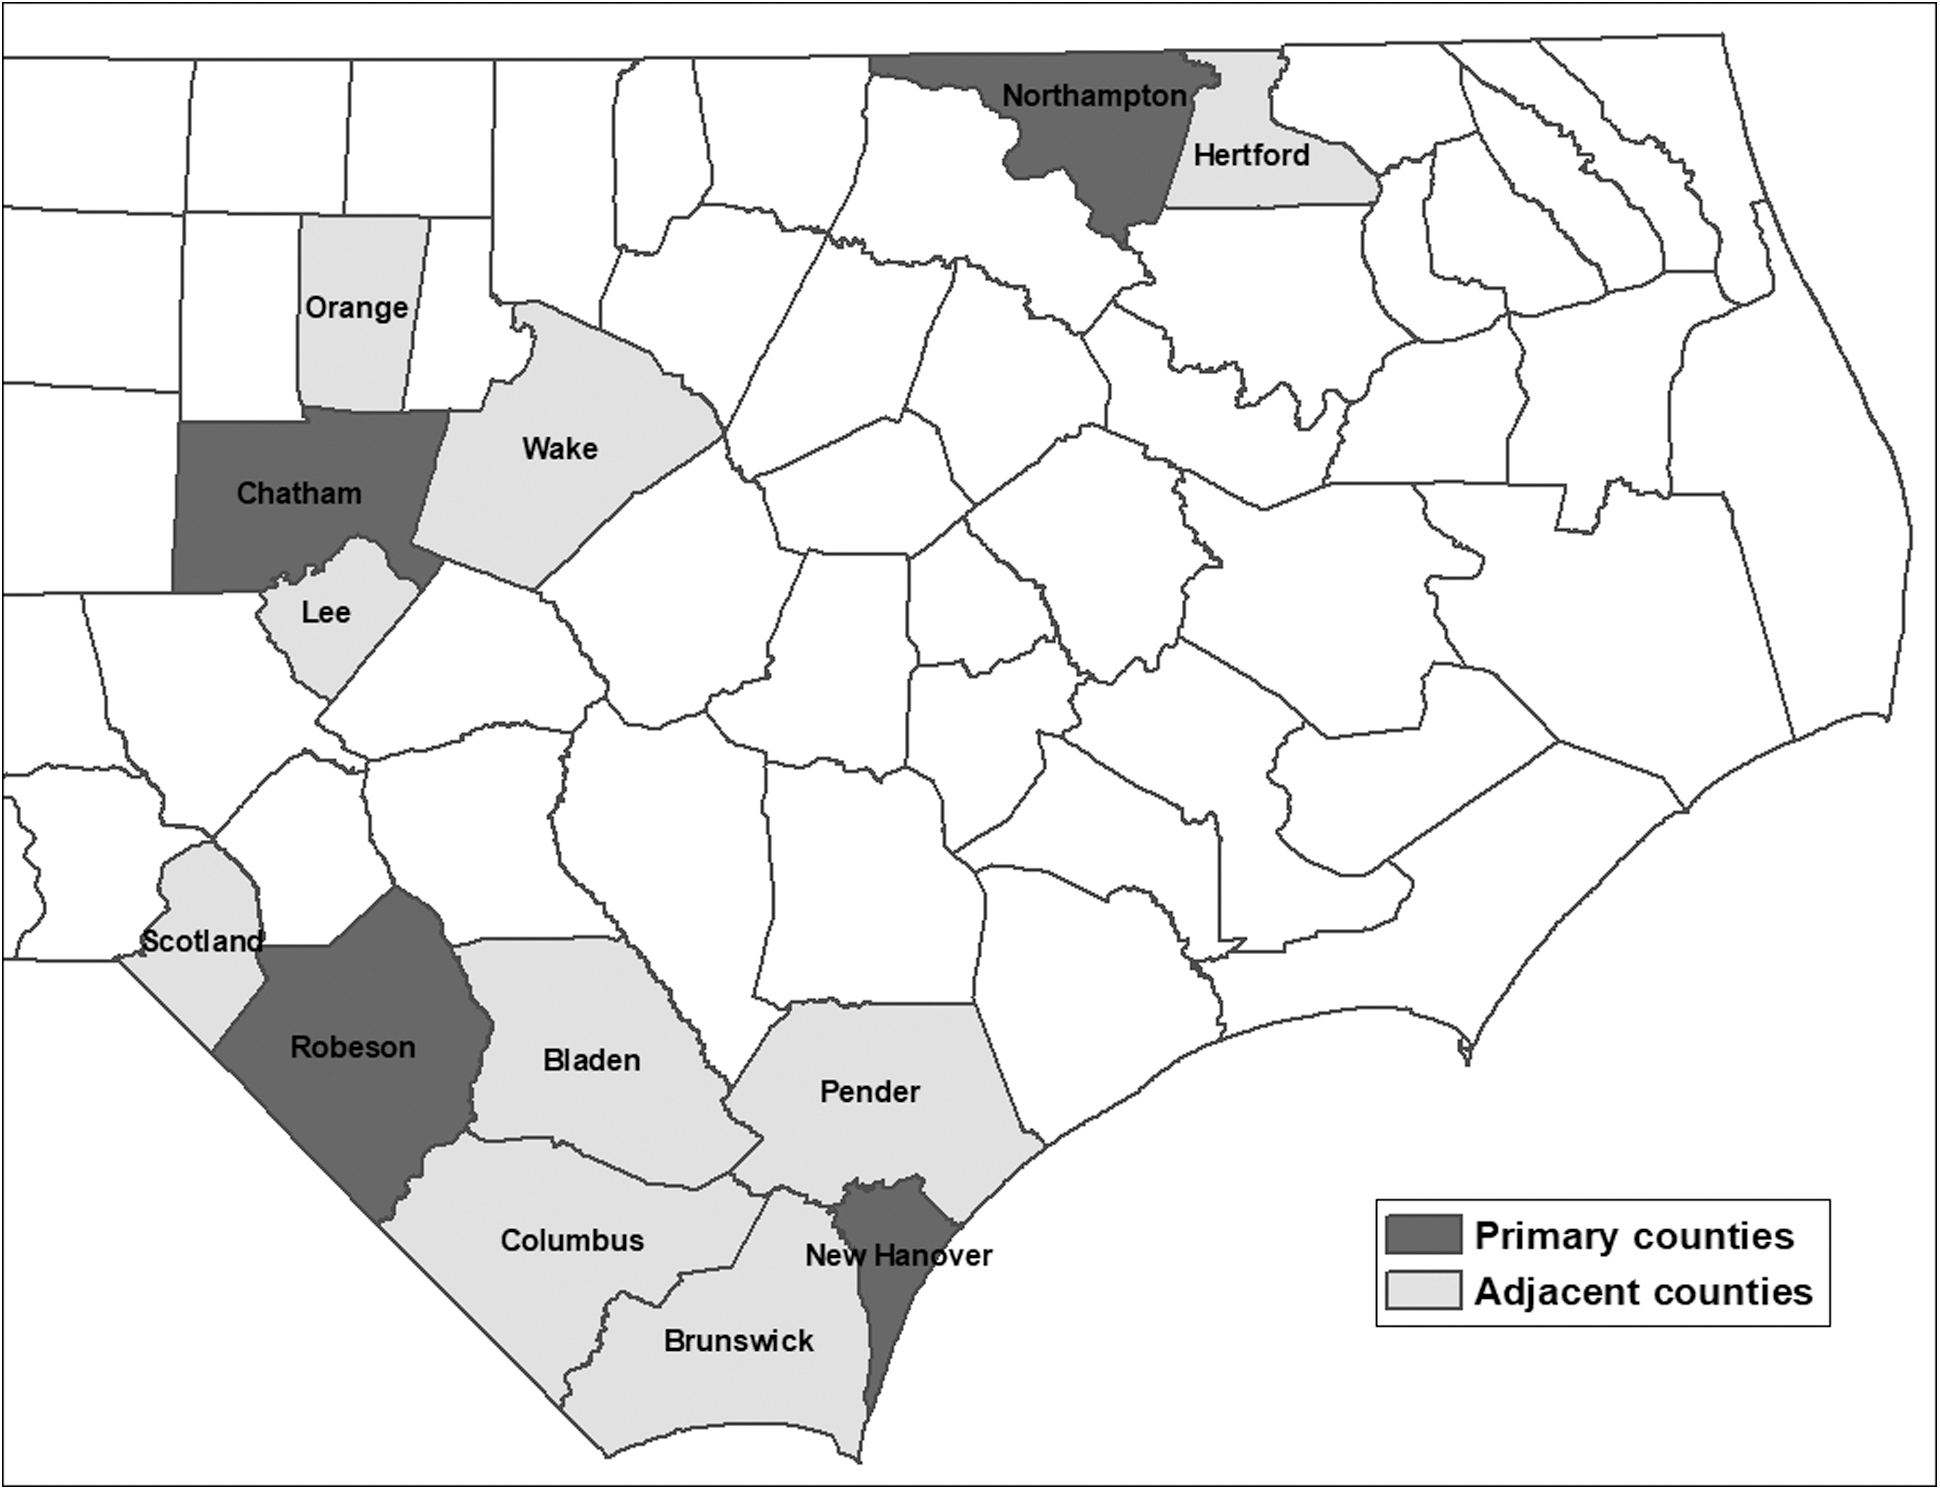
Sampled Regions. Regions sampled for the NSF RAPID well water study were based in four counties (Chatham, New Hanover, Northampton, and Robeson Counties) and nine adjacent counties (Bladen, Brunswick, Columbus, Hertford, Lee, Orange, Pender, Scotland, and Wake Counties). NSF RAPID, National Science Foundation Grants for Rapid Response Research.
While Chatham and New Hanover are predominately White and higher wealth counties, Robeson and Northampton Counties have a Tier 1 rankings (economically distressed) 74 with lower socioeconomic status and higher percentages of BIPOC populations compared with state demographics (NC median income = 56,642; BIPOC = 30%). Robeson County, for example, is 42% Native American, 24% Black/African American, and 9% Latino, whereas Northampton County is 57% Black/African American (Fig. 2). Although the samples from Chatham and New Hanover Counties were consistent with the demographics in each county, without intentional, focused door-to-door canvasing in BIPOC and low-income neighborhoods, the sample would have likely overrepresented high-wealth, White households. Well testing initiatives can exacerbate burden disparities in private well testing and treatment as low-income, non-college educated households are less likely to participate in free testing programs. 75
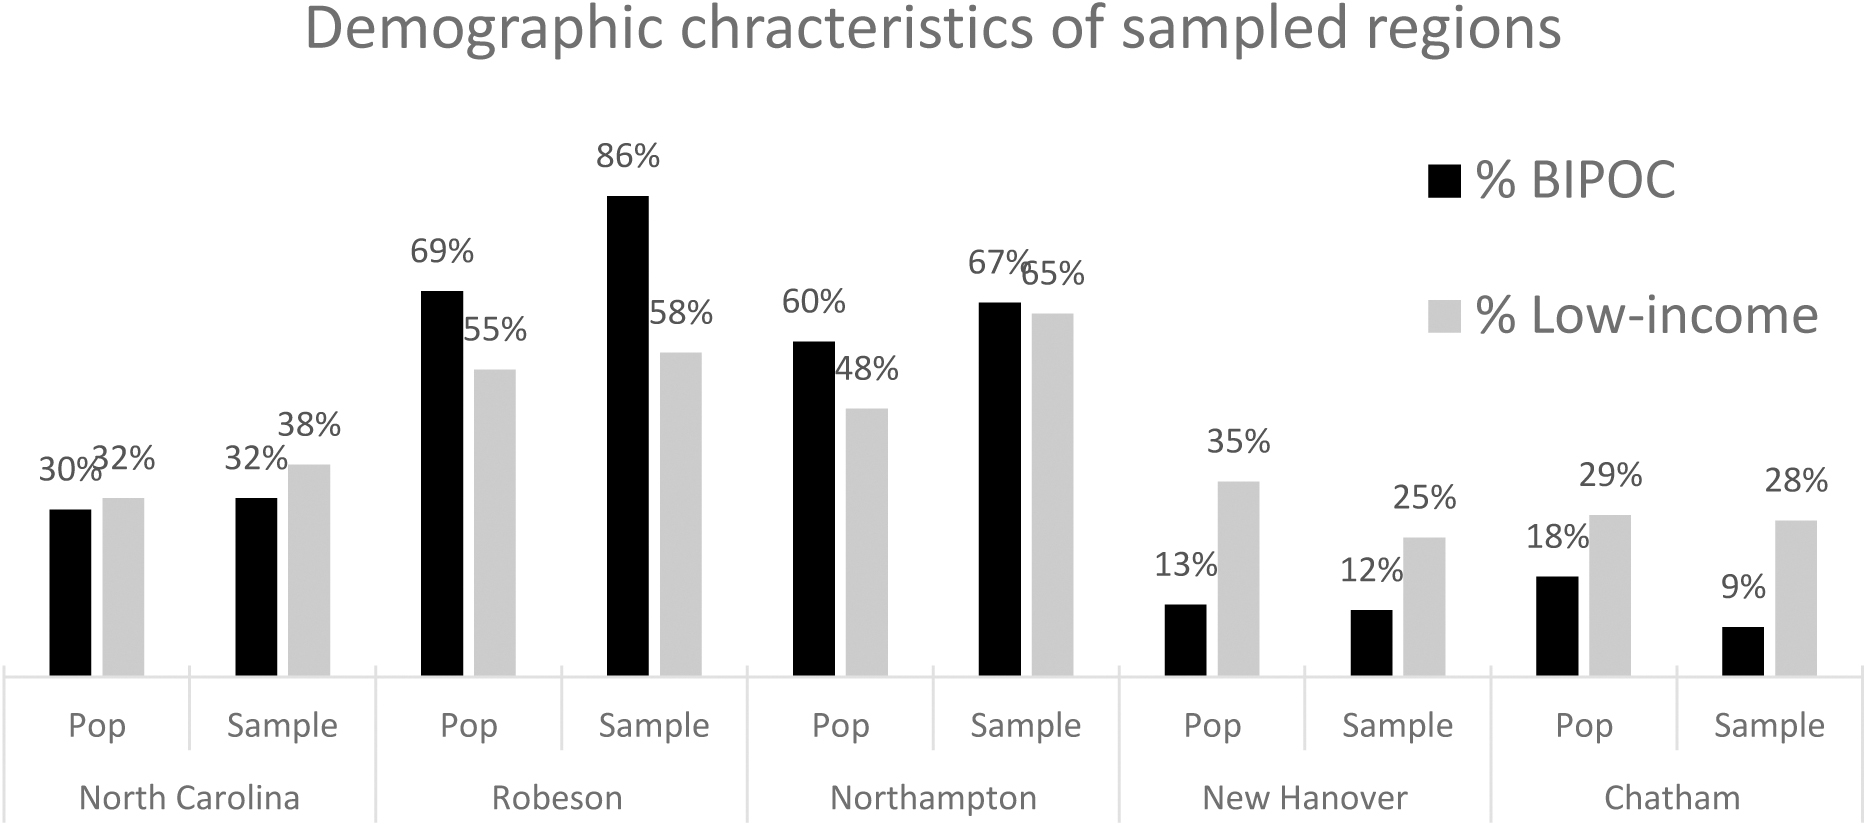
Demographic characteristics of state, sample, and regions. BIPOC, Black, Indigenous, and other People of Color.
In Robeson, we began working in 2018 with the Lumbee Tribe of NCs Tribal Administrator, the Lumber Riverkeeper, and the NC Cooperative Extension office in Robeson County to conduct three county-wide well testing clinics and host three report-back meetings in Pembroke and Lumberton, NC. With our partners, we canvassed near the Weatherspoon Power Plant coal ash impoundments and other small well-reliant neighborhoods (e.g., Maxton). In Northampton, we worked with the Northampton County Citizens Against Coal Ash and Blue Ridge Environmental Defense League (BREDL) to recruit and collect water samples near coal ash landfills and hosted one report-back community meeting in Jackson, NC.
In New Hanover, we worked with the NC Cooperative Extension offices to host three county-wide well testing clinics and two report-back meetings at the NC Cooperative Extension offices in Wilmington and Castle Hayne. With the Cape Fear Riverkeeper, we canvassed in communities to recruit private well users near the coal ash impoundments at the Sutton Power Plant. Finally, in Chatham, working with BREDL and the neighborhood group Chatham Citizens Against Coal Ash Dumps, we canvassed neighborhoods closest to a leaking coal ash landfill 76 in the predominately BIPOC, low-income community of Moncure, NC, held three county-wide clinics, and conducted two report-back meetings in Moncure and Pittsboro, NC. All study protocols were approved by VA-Tech Institutional Review Board (IRB; 16-918 and 19-149).
Water quality standards
Standards used for this study included the U.S. Environmental Protection Agency's (U.S. EPA) maximum contaminant levels (MCLs) and action levels (AL) required for regulated municipal systems. Although ALs apply to public water systems and are triggered when more than 10% of homes exceed 15 ppb for lead, MCL and AL standards are not enforceable for private wells and are not strictly based on health risk. Instead, MCLs are set at the lowest level feasible for public municipal systems when balancing health risk with cost and available technologies (per the SDWA). 77 The U.S. EPA also has voluntary secondary maximum contaminant levels (SMCLs) used for public municipal systems for aesthetic considerations.
We also used the NC Department of Environmental Quality “Groundwater Quality Standards,” called 2L Standards (title 15A, Subchapter 2L, Section 0.0100, 0.0200, 0.0300), which are the maximum allowable concentrations of contaminants in groundwater without creating a threat to human health or which would otherwise render the groundwater unsuitable for use as a drinking water source (15A NCAC 02L.0202). Finally, for hexavalent chromium [Cr(VI)], we used the NC Department of Health and Human Services' (NC DHHS) Health Screening Level, also known as a “State Health Goal” (SHG) of 0.07 ppb, which was developed based on toxicological and epidemiological data. 78
Sampling
Participants received IRB-approved materials beginning in October 2018 (IRB No. 16-918 and 19-149), including a sample kit with bottles, a consent form, sampling instructions, and a survey addressing: (1) household demographics (race, household income, educational attainment); (2) well water use and consumption patterns; (3) prior testing; and (4) treatment devices installed. Participants were instructed to collect two samples from a working tap after a 5-minute flush (flushed sample), including a 250 mL sample for metals and a 125 mL sample for Cr(VI). After our initial sampling in Robeson and New Hanover uncovered low pH values (<6.5) in more than 46% of the wells sampled, we added a third 250 mL bottle and collected 363 samples after a 6-hour stagnation period (first draw), before flushing the water from the system for 5 minutes to collect the two flushed samples.
Water samples were analyzed via inductively coupled plasma-mass spectrometry per Standard Method 3125-B and Cr(VI) analysis via ion chromatography per Standard Method. 79 For data quality assurance and quality control, blanks and spikes of known concentrations were measured for every 10 samples. Participants received water quality reports by mail, 4–6 weeks after sampling. Samples collected from non-private well sources or duplicated samples (n = 48), collected at the tap after treatment devices (n = 8), or without identifying a sampling location (n = 7) were removed from analysis.
Statistical analyses
We analyzed data with SPSS Statistics 26 using an alpha value of 0.05. Key demographics (race and household income) were self-reported by study participants on the survey. BIPOC status was recorded for participants who reported any race other than White. Low-income status was assigned if participants reported an annual household income below $50,000/year. 80 A binary variable was established for educational attainment if anyone in the household reported having a 4-year college degree. The following combinations of demographic variables were analyzed: (1) BIPOC/low-income; (2) BIPOC/high-income; (3) White/low-income; and (4) White/high-income (Table 2). We used correlation to test unadjusted bivariate analysis, and if any co-movement occurred between variables of interest, we used binary logistic regression, a form of generalized linear models, to assess predictive values of dependent variables (testing, treatment, and contamination) and covariables (race and income), while controlling for education, well type, and aquifer system.
RESULTS
Between October 2018 and November 2019, 476 flushed samples were collected from 13 NC counties, with door-to-door recruiting and well test clinics based in Robeson (n = 67), Northampton (n = 92), New Hanover (n = 80), and Chatham counties (n = 237). First draw samples (n = 363) were also collected in the four focus regions, including Robeson (n = 9), Northampton (n = 92), New Hanover (n = 25), and Chatham counties (n = 237). Wells were sampled in four different aquifer systems: (1) Castle Hayne aquifer (n = 60); (2) Northern Atlantic Coastal Plain aquifer (n = 144); (3) Surficial aquifer (n = 24); and (4) Piedmont and Blue Ridge crystalline-rock aquifer (n = 237) (11 aquifer types were unknown).
Reported well depths varied from 16 to 1000 feet, with a mean depth of 209 feet, including 50% (n = 240) deep wells (>50 feet), 12% (n = 56) shallow wells (<50 feet), and 38% (n = 180) of well depths unreported. The mean reported age for all wells sampled was 30 years, serving homes with a mean 2.3 residents, who have lived in the residence a mean of 20+ years. More than 58% of participants (n = 192) reported at least one form of treatment system, with sediment filters (24%) and water softeners (19%) reported most frequently. Less than half (44%) of study participants (n = 209) reported prior well testing. Of those who did test, 61% (n = 134) previously tested with their county health department, and 39% (n = 85) tested with private a private commercial laboratory. Well types included dug/bored, “sand-point,” and driven wells (n = 64) or drilled wells (n = 304), with 41 participants not reporting a well type.
Among study participants reporting race (n = 419), 32% of households identified as BIPOC (NC average = 32%) and 38% of participants reporting income (n = 318) were low-income (<$50,000; NC average = 32%) (Fig. 2). Race was reported by 60% of households as White (n = 286), 12% as Black or African American (n = 59), 10% as Native American (n = 48), 5% as two or more races (n = 25), and 14% (n = 58) elected not to answer. At the individual county level, participant representation was consistent with county race averages (Fig. 2). Income varied from <$12,000 to $150,000 and above, with median household income levels between $50,001 and $100,000.
Most participants (56%) held a 4-year college degree or higher (n = 267) (NC average = 32%), 81 with educational attainment levels ranging from 28% (n = 138) with a graduate degree, 26% (n = 129) with a 4-year college degree, 10% (n = 40) reporting a 2-year or associates degree, 11% (n = 51) had some college, 10% had a high-school diploma (n = 47), 2% (n = 9) reporting receiving some high-school education, and 13% did not answer (n = 62).
Contamination levels of inorganic metals in private wells
Among flushed samples (n = 476), ∼67% (n = 321) had metals exceeding at least one federal or state standard or public health goal (Table 1). Thirty-seven percent of flush draw samples (n = 176) exceeded at least one federal standard, including 36% exceeding at least one SMCL nuisance standard (n = 169). More than 18% (n = 87) exceeded a state standard (NC 2L groundwater standard), and 33% (n = 157) exceeded NCs SHG (0.07 ppb) for Cr(IV).
Water Quality Parameters Reported by Contamination
While 225 private wells exceeded one federal or state standard or health goal (47%), 79 exceeded at least 2 (17%) and 17 exceeded at least 3 (4%). Thirty-two percent (n = 155) exceeded no federal or state standard or health goal for inorganic metals.
Flushed samples (n = 476).
First draw samples (n = 363).
2L, state groundwater standard; AL, action level; Cr(VI), hexavalent chromium; MCL, maximum contaminant level; SHG, State Health Goal; SMCL, secondary maximum contaminant level; TDS, total dissolved solids.
Based on the EPAs standards used for public water systems (ALs), 20% (n = 72) of first draw samples exceeded ALs for lead (n = 32) or copper (n = 51), including 12 wells with both copper and lead above federal ALs. SMCL contamination included exceedances above the standard for iron (300 ppb) in 18% (n = 84), manganese (50 ppb) in 15% (n = 70), aluminum (200 ppb) in 11% (n = 50), and total dissolved solids in 4% of the wells (n = 20). Among exceedances of NCs 2L standards (not including those with federal MCL standard), cobalt was the most common contaminant, with 14% of private wells exceeding 1 ppb (n = 66), 4% of the wells (n = 21) exceeding the 1000 ppb 2L standard for zinc, and <1% (n = 6) of the wells exceeded the vanadium standard. Microbial contamination was outside the scope of this study but discussed in detail elsewhere 82 (Table 1).
Differences in water quality and well stewardship based on demographics
Unadjusted bivariate analysis of well stewardship, demographics, and other independent variables (well type and aquifer system) uncovered statistically significant correlations (Fig. 3). Predictably, the strongest correlation (0.433) occurs between income and education (p < 0.01). Race and well type had the next strongest correlation (−0.409), due to 70% (n = 45) of dug wells used by BIPOC participants, compared with only 17% (n = 52) of drilled wells (n = 304). Well type also strongly correlated (0.404) with NC 2L groundwater exceedances (p < 0.001), as well as SMCL nuisance exceedances (−0.352). Other notable correlations occurred between aquifer type and race (0.394, p < 0.01), which is explained by the different demographic groups sampled in different aquifers.

Correlation matrix of demographic, well stewardship, consumption, contamination, aquifer type, and well age. **Correlation is significant at the 0.01 level (two-tailed). *Correlation is significant at the 0.05 level (two-tailed). 2L, state groundwater standard; MCL, maximum contaminant level; SMCL, secondary maximum contaminant level.
For example, more than 90% of the private wells in the Blue Ridge and Piedmont Aquifer in the NC Piedmont (Chatham County) were used by White households, whereas only 45% of the wells in the other aquifers were used by White households. Correlation between race and well type (−0.409) and aquifer (0.394) is a function of the limits of well types that can be constructed in different aquifer systems. Also notable is the correlation between SMCL contamination and race (−0.306), with 57% of BIPOC households having at least one SMCL nuisance exceedance, compared with only 25% of White households, highlighting a burden disparity relating to metal contamination occurring in BIPOC wells (p < 0.01) (Fig. 3).
When controlling for education, well type, and aquifer type system, regression models showed differences among demographic characteristics of study participants and well testing, at statistically significant levels. Private well testing was predicted best by income (p < 0.01) and race (p < 0.05), with low-income households 3.4 times less likely to test, and BIPOC households 2.3 times less likely to test, than high-income or White households.
Next, to develop a better understanding of disparities among study participants, we stratified demographic metrics into four subgroups: (1) BIPOC/low-income, (2) BIPOC/high-income, (3) White/low-income, and (4) White/high-income (Table 2). When controlling for education, well type, and aquifer system, regression models showed that differences in testing among subgroups remained significant, with <14% of Group 1 (BIPOC/low-income) reporting testing their wells, compared with 63% of Group 4 (White/high-income). This translates into Group 4 having over 10 times greater odds of reporting prior testing compared with Group 1 (p < 0.001) (Table 2).
Regression Analysis of Demographic Groupings, Education, Well Type, and Aquifer System
p < 0.05.
p < 0.01.
BIPOC, Black, Indigenous, and other People of Color; OR, odds ratio; SE, standard error.
Disparities in the presence of water treatment systems were also observed based on income and race, while controlling for education and aquifer system. (Controlling for well type reduced the sample size to 38% and was not included.) High-income and White households had 2.8 and 2.5 greater odds, respectively, of reporting use of a treatment system, at statistically significant levels (p < 0.01; p < 0.05). At the intersection of race and income, these patterns remained significant, with Group 1 (BIPOC/low-income) reporting a treatment system 29% of the time, compared with more than 67% of Group 4 (White, high-income). When controlling for education, and aquifer system, analysis of treatment systems, we found homes from Group 4 (White/high-income) had 4.2 times greater odds of reporting a treatment system than Group 1 (p < 0.05) (Table 2).
Although unadjusted bivariate analysis (Fig. 3) showed significant correlation (p < 0.01) between race and well contamination from SMCL nuisance exceedances (−0.306), when controlling for aquifer and well type, regression modeling analysis found well type (dug or drilled) was the strongest predictor of contamination. Well tests revealed 61% of drilled wells exceeded at least one federal or state standard or health goal, whereas similar exceedances were discovered in 86% of dug wells. Regression analysis showed exceedances of NCs 2L groundwater standards were best predicted by well type (p < 0.01), with dug wells having almost 11 times greater odds of experiencing contamination by 2L metals compared with drilled wells. Dug wells were also contaminated by SMCL nuisance metals 70% of the time, compared with only 25% of drilled wells, representing over five times greater odds of finding contamination in dug wells (p < 0.01) (Table 2).
DISCUSSION
Consistent with the literature, study participants reported low levels of private well testing and treatment systems (44% and 58%, respectively). However, well stewardship practices, essential for maintaining clean and safe drinking water, were not equally distributed across the sample. Instead, race and income were significant predictors of private well testing and treatment levels, even when controlling for other variables. Odds ratios showed high-income, White households had 10 times greater odds of reporting previous testing, and 4.2 greater odds of using a treatment system, compared with low-income, BIPOC households. Although other studies have found similar patterns among low-income households, we believe that this article is one of the first to identify these disparities in testing and treatment among BIPOC populations across multiple regions.
Among the study sample, low-income, BIPOC households accounted for 40% of dug wells, compared with only 10% of drilled wells, whereas high-income, White households reported only 23% of dug wells and 57% of drilled wells. According to the United State Geological Survey, dug wells have a higher risk of contamination due to their depth and lack of continuous casing. 83 In this study, differences in contamination levels between drilled and dug wells were consistent with literature, with 61% of drilled wells exceeding at least one federal or state standard or health goal, compared with 86% of dug wells with similar contamination.
Additionally, drilled wells can be costly and require technical expertise, compared with dug/bored or driven wells, which can be installed with relatively lower cost. Cost is influenced by both the type of system (dug/drilled) and depth of system (shallow/deep) and can vary based on the source aquifer. In addition to cost considerations, geology also influences the type of private well that is constructed, with wells in the Northern Atlantic Coastal Plain aquifer, for example, requiring boring to remove salt contamination, while wells in the Piedmont and Blue Ridge crystalline-rock aquifer require drilling.
Unadjusted bivariate analysis showed race and income correlated with SMCL nuisance contamination levels (Fig. 3), although binary logistic regression showed that the strongest predictors of contamination were aquifer system and well type. These findings are likely due to different groundwater well depth, pH levels, temperature, and other factors related to the sample location. However, while well type and aquifer system are better predictors of groundwater quality overall, location itself has race and income components. Differences between communities are not random and are instead a product of historic demographic pressures, including racial underbounding, redlining, restrictive covenants, and other institutionalized racial and economic policies. 84 , 85 , 86 , 87 , 88 Additional research into burden disparities associated with the contaminants studied here is warranted.
Private well stewardship is critically important, especially given we observed substantial metal contamination (MCL, SMCL, 2L, and SHG exceedances) in private wells in the four NC study regions. Results showed exceedances of at least one federal or state standard or health goal in more than 67% of the well tests documented (n = 321). At least one federal MCL or AL standard was exceeded in more than 20% of first draw samples (n = 72), and SMCL standards were exceeded in more than 36% of the flushed samples (n = 169). Exceedances of state standards were also observed, with 18% (n = 87) of the wells above at least one 2L standard and 32% (n = 157) above the SHG for Cr(VI). Although the levels of SMCL and MCL exceedances are consistent with the private well literature, 89 , 90 few studies have tested for and documented similar levels of the 2L and SHG exceedances observed here. 91
These standards are only enforceable for public water utilities; private well users are not required to meet these requirements or take corrective actions if contamination exceeds federal standards. Although the SDWA does not apply to private wells, contamination levels observed in this study would have required substantial remediation at any public water utility. For example, with more than 10% of the first-draw samples exceeding the AL for lead (15 ppb) within one public water system, a water utility would have been compelled to take corrective action to remediate the contamination, whereas the SDWA specifically excludes private wells from the regulations. Also, if the 72 wells exceeding an MCL or AL in this study were tested through county health departments, the agencies would be compelled to mail a Health Risk Evaluation recommending well users “do not drink” the water. Beyond warning households against consuming the contaminated drinking water, no remediation or other corrective actions are required by federal or state law.
Although a 2008 NC statute mandates testing for all newly constructed wells, testing of older wells is not required, and costs may be excessive for many low-wealth communities. A few states, including New Jersey, 92 Oregon, 93 and Rhode Island, 94 have passed legislation requiring well tests before real estate transfers, but most do not address this issue. Although support for low-income well users in NC is available through the state's Bernard Allen Memorial Emergency Drinking Water Fund, the program applies only to anthropogenic contaminants, tests less than 500 wells per year, and individual private well users cannot directly access the fund. 95 Although some counties and local municipalities have the capacity to support private well users, there are significant disparities in outreach and support offered by county health departments across the state. 96
Given these challenges, public health intervention strategies in NC must consider these identified burden disparities to better serve the 2.4 million households that rely on private wells for drinking water, especially those in socially and economically marginalized communities. These results underscore the need to prioritize well testing and treatment systems for EJ communities.
CONCLUSIONS
Working together, CBOs and the research team engaged well users in a participatory community science project and coordinated report-back meetings to present aggregated results to participants and other stakeholders in the focus regions. We observed burden disparities among well users previously unaddressed in the literature, including statistically significant low levels of testing and treatment among low-income, BIPOC households. Without engaging EJ communities, research into private wells will continue to exclude the most marginalized, underserved populations. These results suggest a need for strategic efforts to increase well testing and improve treatment efforts among NCs well-reliant communities.
Footnotes
ACKNOWLEDGMENTS
We would like to thank the faculty and students at Virginia Tech and the University of North Carolina at Chapel Hill's Institute for the Environment for their assistance in sampling. We would also like to thank our community partners, which include the Blue Ridge Environmental Defense, Cape Fear and Lumber Riverkeepers, Chatham Citizens Against Coal Ash Dumps, Northampton County Citizens Against Coal Ash, Lumbee Tribal Administration, New Hanover County and Robeson County Cooperative Extension, and Winyah Rivers Alliance. Finally, the authors thank the well users who participated in this study.
AUTHORs' CONTRIBUTIONS
A.G.: Conceptualization, funding acquisition, methodology, recruiting, sampling, validation, formal analysis, writing—original draft. K.G.: Conceptualization, funding acquisition, analysis, writing—review and editing. K.W.: Sampling, formal analysis, writing—review and editing. J.C.: Sampling and Editing. J.H.: Sampling and Editing. A.W.K.: Sampling and Editing. D.G.: Analysis, writing, and editing. M.E.: Funding acquisition, methodology, writing—review and editing. K.J.P.: Project administration, conceptualization, methodology, recruiting, sampling, validation, formal analysis, writing—review and editing, funding acquisition.
AUTHOR DISCLOSURE STATEMENT
The authors have no conflict of interest or financial ties to disclose.
FUNDING INFORMATION
This research was supported by the National Science Foundation RAPID response program (Grant Award No.: 1855567), the UNC Superfund Research Program (P42-ES031007), Spring Point Partners, and the EPA (G2017-ORD-F1).