
Abstract
Although challenges in water and sanitation access are often assumed to be issues of low- and middle-income nations, more than 400,000 homes in the United States still lack access to complete indoor plumbing. Previous research has demonstrated that the remaining plumbing challenges are more prevalent in communities with high Black and Brown populations. This study hypothesizes that the 1930s practice of redlining by the Home Owners' Loan Corporation (HOLC), which systematically denied loans to minority populations, is linked to present-day inadequate plumbing access (i.e., defined as incomplete plumbing above the national average). Digitized HOLC maps for 202 urban areas across the country and U.S. Census data from the 2016 to 2020 American Community Survey were combined to interpolate the modern-day plumbing access for historical neighborhoods (n = 8871 communities). Analysis via binomial logistic regression demonstrated that nationally, redlined communities (HOLC Grade “D”) are significantly more likely to have a rate of incomplete plumbing above the national average compared with greenlined communities (HOLC Grade “A”) (0.1352; confidence interval = ±0.036). This finding was also observed for three of the nation's four census subregions (Northeast, Midwest, and West). Slight differences by region in relationships between the proportion of specific racial/ethnic populations on rates of incomplete plumbing demonstrate the need for targeted place-based interdisciplinary examinations of exclusionary practices. The demonstration of the present-day impacts of redlining after nearly 90 years emphasizes the need to intentionally mitigate past injustices to ensure modern-day equity.
INTRODUCTION
The United Nations established water access as a human right over a decade ago, with Sustainable Development Goal 6 (SDG6) calling for universal access to clean and safely managed drinking water and appropriate sanitation services by 2030. 1 However, two billion people in the world today still live without access to this essential resource. 2 Although access to safe drinking water and sanitation services is often assumed to be primarily a concern for low- and middle-income countries, there is recent and increasing attention on continuing issues of incomplete plumbing in high-income countries, particularly those in the United States, which are characterized by intensifying economic inequities. 3 , 4 , 5
The 2019 American Community Survey (ACS) estimated that more than 400,000 occupied households in the United States still lack complete plumbing 6 ; assuming an average household size of 2.61 people, this equates to more than one million Americans living in conditions that do not meet the stated goal of SDG6. 7 Under the current U.S. Census definition, complete plumbing includes access to hot and cold running water, flush toilets, and bathtubs or showers. 8
Multiple examinations at the national and local scales suggest that incomplete plumbing in the United States is not only a function of local wealth inequalities but also strongly correlated with race and/or ethnicity. 9 , 10 , 11 , 12 , 13 , 14 For example, a recent national examination by Mueller and Gasteyer of plumbing access and Safe Drinking Water Act compliance determined that county levels of incomplete plumbing were significantly predicted by the Indigenous proportion of population, income, and poverty level. 15 These findings concur with the national examination of Integrated Public Use Microdata Series data by Deitz and Meehan, who demonstrated that income, homeownership, and race/ethnicity were correlated with incomplete plumbing; that is, numbers of Black, Indigenous, and Hispanic or Latino households without complete plumbing access were higher than expected given representation within the national population. 16
Similar patterns linking decreases in safe water access and race/ethnicity have been observed at finer and more localized scales. Gibson et al. demonstrated that for every 10% increase in the Black population in Wake County, North Carolina, the probability of lacking municipal water services increased by over 3%. 17 In a follow-up study, Lecker and Gibson identified historical practices of deliberate exclusion from municipal services to maintain racial segregation as a possible explanation for underserved periurban areas characterized by a higher proportion of lower income Black populations. 18 Specifically naming a past exclusionary practice, Balazs and Ray noted that in San Joaquin Valley, California, the practice of redlining was used as a justification to not extend municipal infrastructure to underserved communities and that this past negligence is in part responsible for present-day inequities in water infrastructure. 19
“Redlining” refers to the practice of divestment from certain communities based on economic, demographic, and environmental factors and was formalized in the 1930s. Briefly, the Home Owners' Loan Corporation Act of 1933 created Home Owners' Loan Corporation (HOLC) to assist homeowners in attaining mortgages by providing loans at a reasonable rate. To ensure the security of these loans during the Great Depression, the HOLC collaborated with local real estate officials to map neighborhoods in each city according to the supposed risk of investment. Neighborhoods were graded on a system of “A” through “D,” with “A” graded areas (green) labeled “Best”; “B” graded areas (blue) labeled “Still Desirable”; “C” graded areas (yellow) labeled “Definitely Declining”; and “D” graded areas (red) labeled “Hazardous.”
Eventually known more commonly as “redlining,” this practice evolved into de jure segregation as realtors attempted to group similar races together to maintain “racial harmony.” 20 , 21 Together with measures such as racially restrictive covenants, redlining excluded African Americans from city neighborhoods and withheld investment from predominantly Black neighborhoods. This led to crowded conditions and apartment conversions in many urban neighborhoods that provided housing units for Black residents but often lacked services, such as adequate plumbing. Through this process, individual discriminatory views were embedded in public policy and became structural forms of discrimination. 22
Although established nearly 90 years ago, an increasing number of studies have demonstrated that redlining continues to define the demographics of many American cities. For example, a study by Aaronson et al. of 149 U.S. cities demonstrated that before the creation of HOLC maps, Black Americans made up, on average, nearly 15% of the population in “D” neighborhoods. By 1980, the average population of Black Americans had grown to more than 45% in “D” neighborhoods. 23 There is also compelling evidence that redlining continues to negatively impact economically disadvantaged minority populations across the country.
In their analysis of 58 redlined areas, Appel and Nickerson reported that properties in redlined neighborhoods were worth nearly 5% less than properties in adjacent neighborhoods. 24 Similarly, Nardone et al. used 2010 census data to demonstrate that redlined neighborhoods had significantly lower median household incomes than greenlined areas ($39,800 vs. $61,200). 25 Additionally, in an examination of 115 cities where neighborhoods had been assessed by the HOLC, Mitchell and Richardson determined that while more than 90% of the greenlined areas were middle-upper-income areas, more than 70% of the redlined areas were lower-middle-income areas. 26
Not surprisingly, the labeling of neighborhoods as declining or hazardous influences infrastructure investments within cities, which in turn can impact environmental health. For example, the Environmental Protection Agency defines urban heat islands (UHIs) as areas where impervious surfaces are prevalent and green space is scarce, causing higher temperatures compared with surrounding areas. This is an issue of growing health concern as more than 700 deaths occur annually in the United States due to elevated temperatures. 27 Hoffman et al. recently used Landsat-derived land surface temperature maps within 108 U.S. urban locations to examine the occurrence of UHI effects in redlined neighborhoods.
Nationally, “D” graded areas were nearly 3°C warmer than “A” graded areas; this difference was statistically significant. 28 Although multiple studies have documented the positive effects of community green spaces, including reductions in heat, crime, and improved stormwater management, 29 , 30 , 31 , 32 recent work by Nowak et al. examining 30 urban areas in the United States demonstrated that HOLC-designated “D” neighborhoods had nearly 20% less tree cover and more than 20% more impervious surface than grade “A” neighborhoods. 33
Given significant previous research demonstrating the influence of race/ethnicity on incomplete plumbing, as well as research confirming likely links between the redlining practices of nearly a century ago and present-day infrastructure and environmental health disparities, 34 , 35 , 36 we hypothesize in this study that areas of present-day incomplete plumbing within U.S. cities (i.e., communities with a proportion of homes lacking complete plumbing above the national average) are significantly associated with HOLC neighborhood designations. To test this hypothesis and explore potential implications, this study applies a geospatial technique to link historical redlining maps with present-day (2020) census housing and demographic data. Understanding the relative influence of past structural racist practices on present-day disparities is an essential first step in correcting past injustice and prioritizing the extension of in-home safe water and sanitation access to all Americans.
MATERIALS AND METHODS
The present work merged geospatial data from two sources: (1) the Mapping Inequality database (University of Richmond) 37 and (2) the 2016–2020 American Community Survey Census Data (U.S. Census Bureau). 38 The Mapping Inequality database consists of digitized HOLC maps for 202 locations in the United States. In brief, digitized HOLC boundaries are available as downloadable shapefiles with accompanying metadata describing the neighborhood name, HOLC grade (“A”–“E”), and area description when available (Fig. 1).
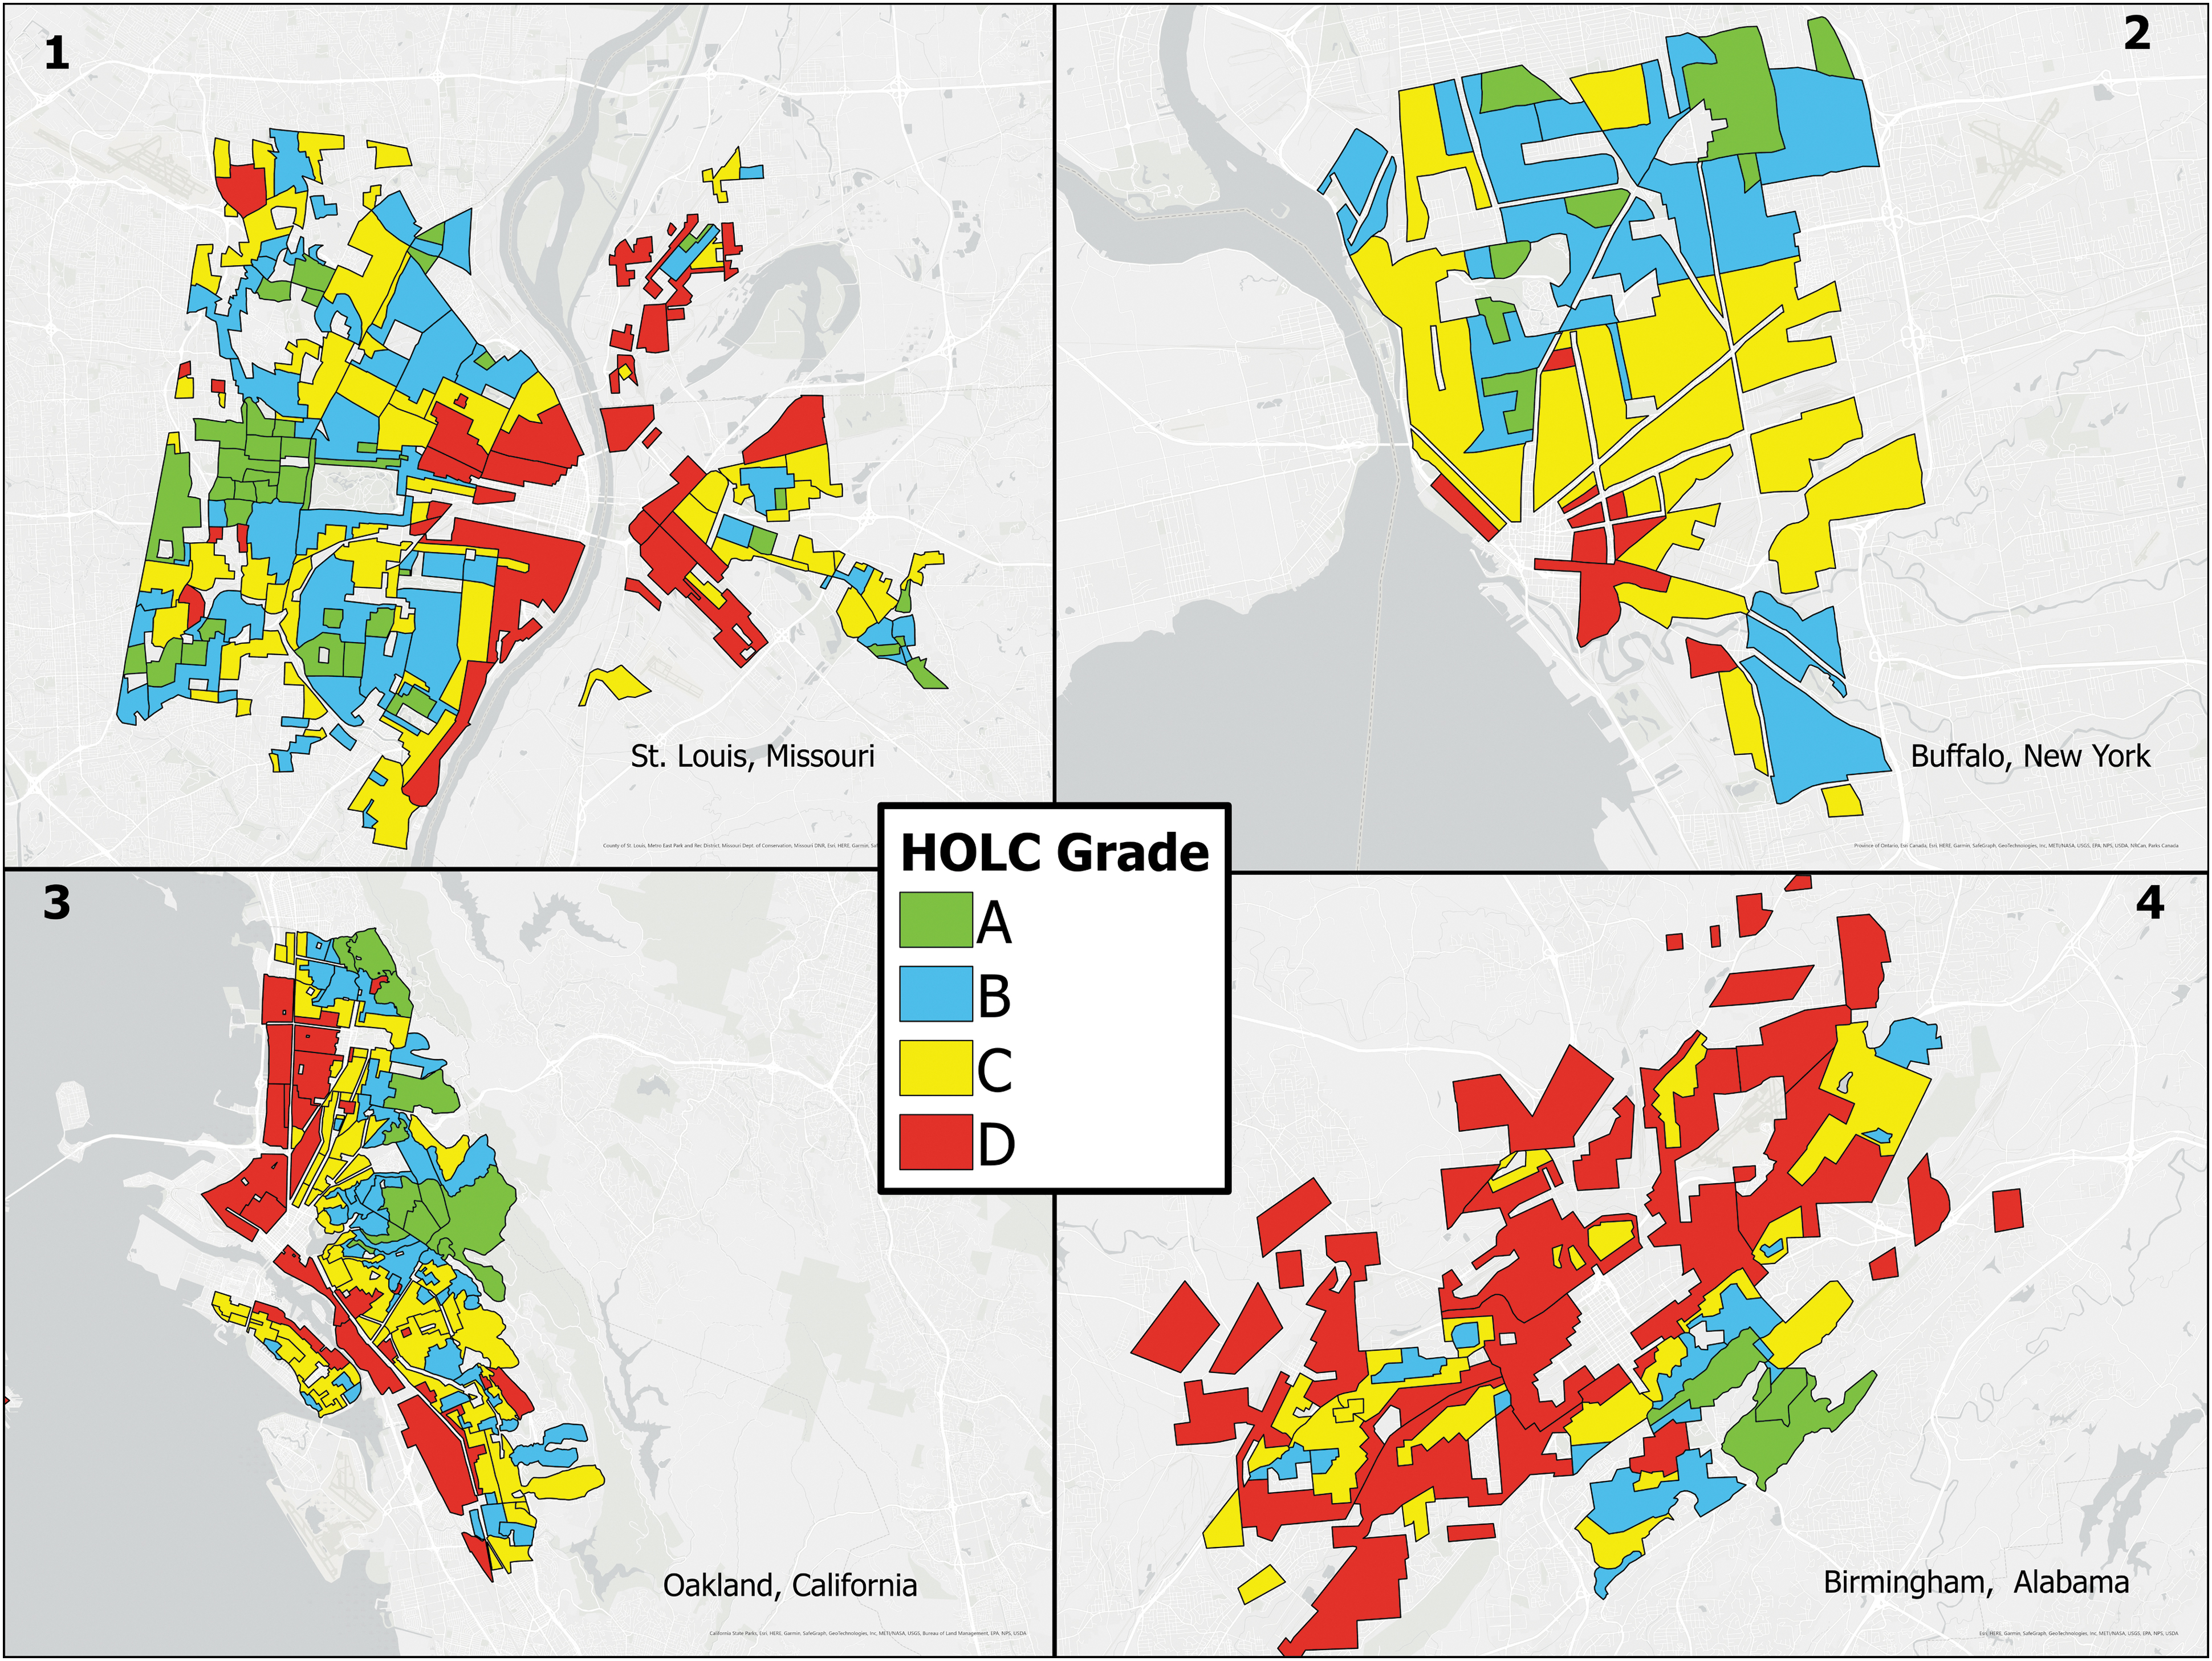
Example HOLC security maps for each of the four U.S. Census designated regions: (1) Midwest: St. Louis, Missouri; (2) Northeast: Buffalo, New York; (3) West: Oakland, California; (4) South: Birmingham, Alabama. HOLC, Home Owners' Loan Corporation.
The definitions of HOLC boundaries within this database have been previously used to examine air pollution, late-stage cancer diagnosis, and emergency room visits in peer-reviewed articles. 39 , 40 , 41 Data downloaded from the 2016 to 2020 ACS included plumbing facilities, homeownership, poverty status, race, ethnicity, country of origin, mobile home units, and age of house construction at the block group level. The plumbing facilities data were separated into two categories: incomplete plumbing as defined earlier and complete plumbing. As stated previously, within this data set, complete plumbing is defined as access to hot and cold running water, flush toilets, and bathtubs or showers.
To account for the incongruous geometry between census block groups and HOLC polygons (i.e., communities), simple areal interpolation was used to assign values to the HOLC polygons. Areal interpolation 42 , 43 , 44 is a widely used and effective method to allow for geospatial analysis of socioeconomic data when areal units differ 45 , 46 , 47 and has been used to support HOLC-based analysis specifically. 48 , 49 Areal interpolation was converted to a Python package that was accessible after creating a Python environment on Jupyter Notebook 6.4.5. 50 Using this method, quantitative values were determined for relevant census parameters (e.g., total population and total incomplete plumbing) in each HOLC neighborhood. The resulting shapefiles were then combined using ArcGIS Pro 2.9.2 that produced a data table that was used for analysis (Supplementary Data).
Potential relationships between HOLC grade and plumbing status were examined via binary logistic regression. This model can predict the likelihood of one of the two events occurring based on prespecified predictors. 51 To increase power, and in keeping with recent work by Meehan et al., 52 incomplete plumbing was transformed into a binary dependent variable: (1) a higher percentage of unplumbed houses than the national average (0.3%) or (0) neighborhoods with a value lower than 0.3. Our chosen regression outputs logarithmic odds as a result. To make results more meaningful, the average marginal effects (AMEs) of each variable on the model were calculated using the “margins” package in R. The AME of a variable is the percentage change in the probability when a variable is changed by one increment and all other variables are held constant. This method is commonly used for the results of logistic regressions. 53
To limit the number of explanatory variables, house age, which is given by the census as a 10-year range, was separated into two periods, pre- and post-1980. This year was selected as the breakpoint given the passing of the U.S. Safe Drinking Water Amendments commonly referred to as the “Lead Ban,” which occurred just prior. The dependent variable for the first model was a binary variable for plumbing. The independent variables were HOLC grade and (all in %): Black population, Hispanic or Latino population, residents below the poverty line, mobile homes, houses built in 1980 or newer, rented housing units, Indigenous population, and foreign-born population.
A stepwise function was used to eliminate highly correlated variables and to reduce multicollinearity in the model. Both backward and forward eliminations were used to determine the significant parameters that should be included in the final model. 54 The stepAIC package in R studio was used to conduct this analysis. As expected, % White population was heavily negatively correlated with % Black population (r = −0.85) and was therefore removed from the model (Fig. 2). We used HOLC Grade A as the reference group in keeping with recent work by Krieger et al.; it is worth noting that the proportion of incomplete plumbing did differ significantly between grades (Dunn's test, p = 2.10E-03, 6.09E-28, 7.25E-85; Supplementary Table S1). 55
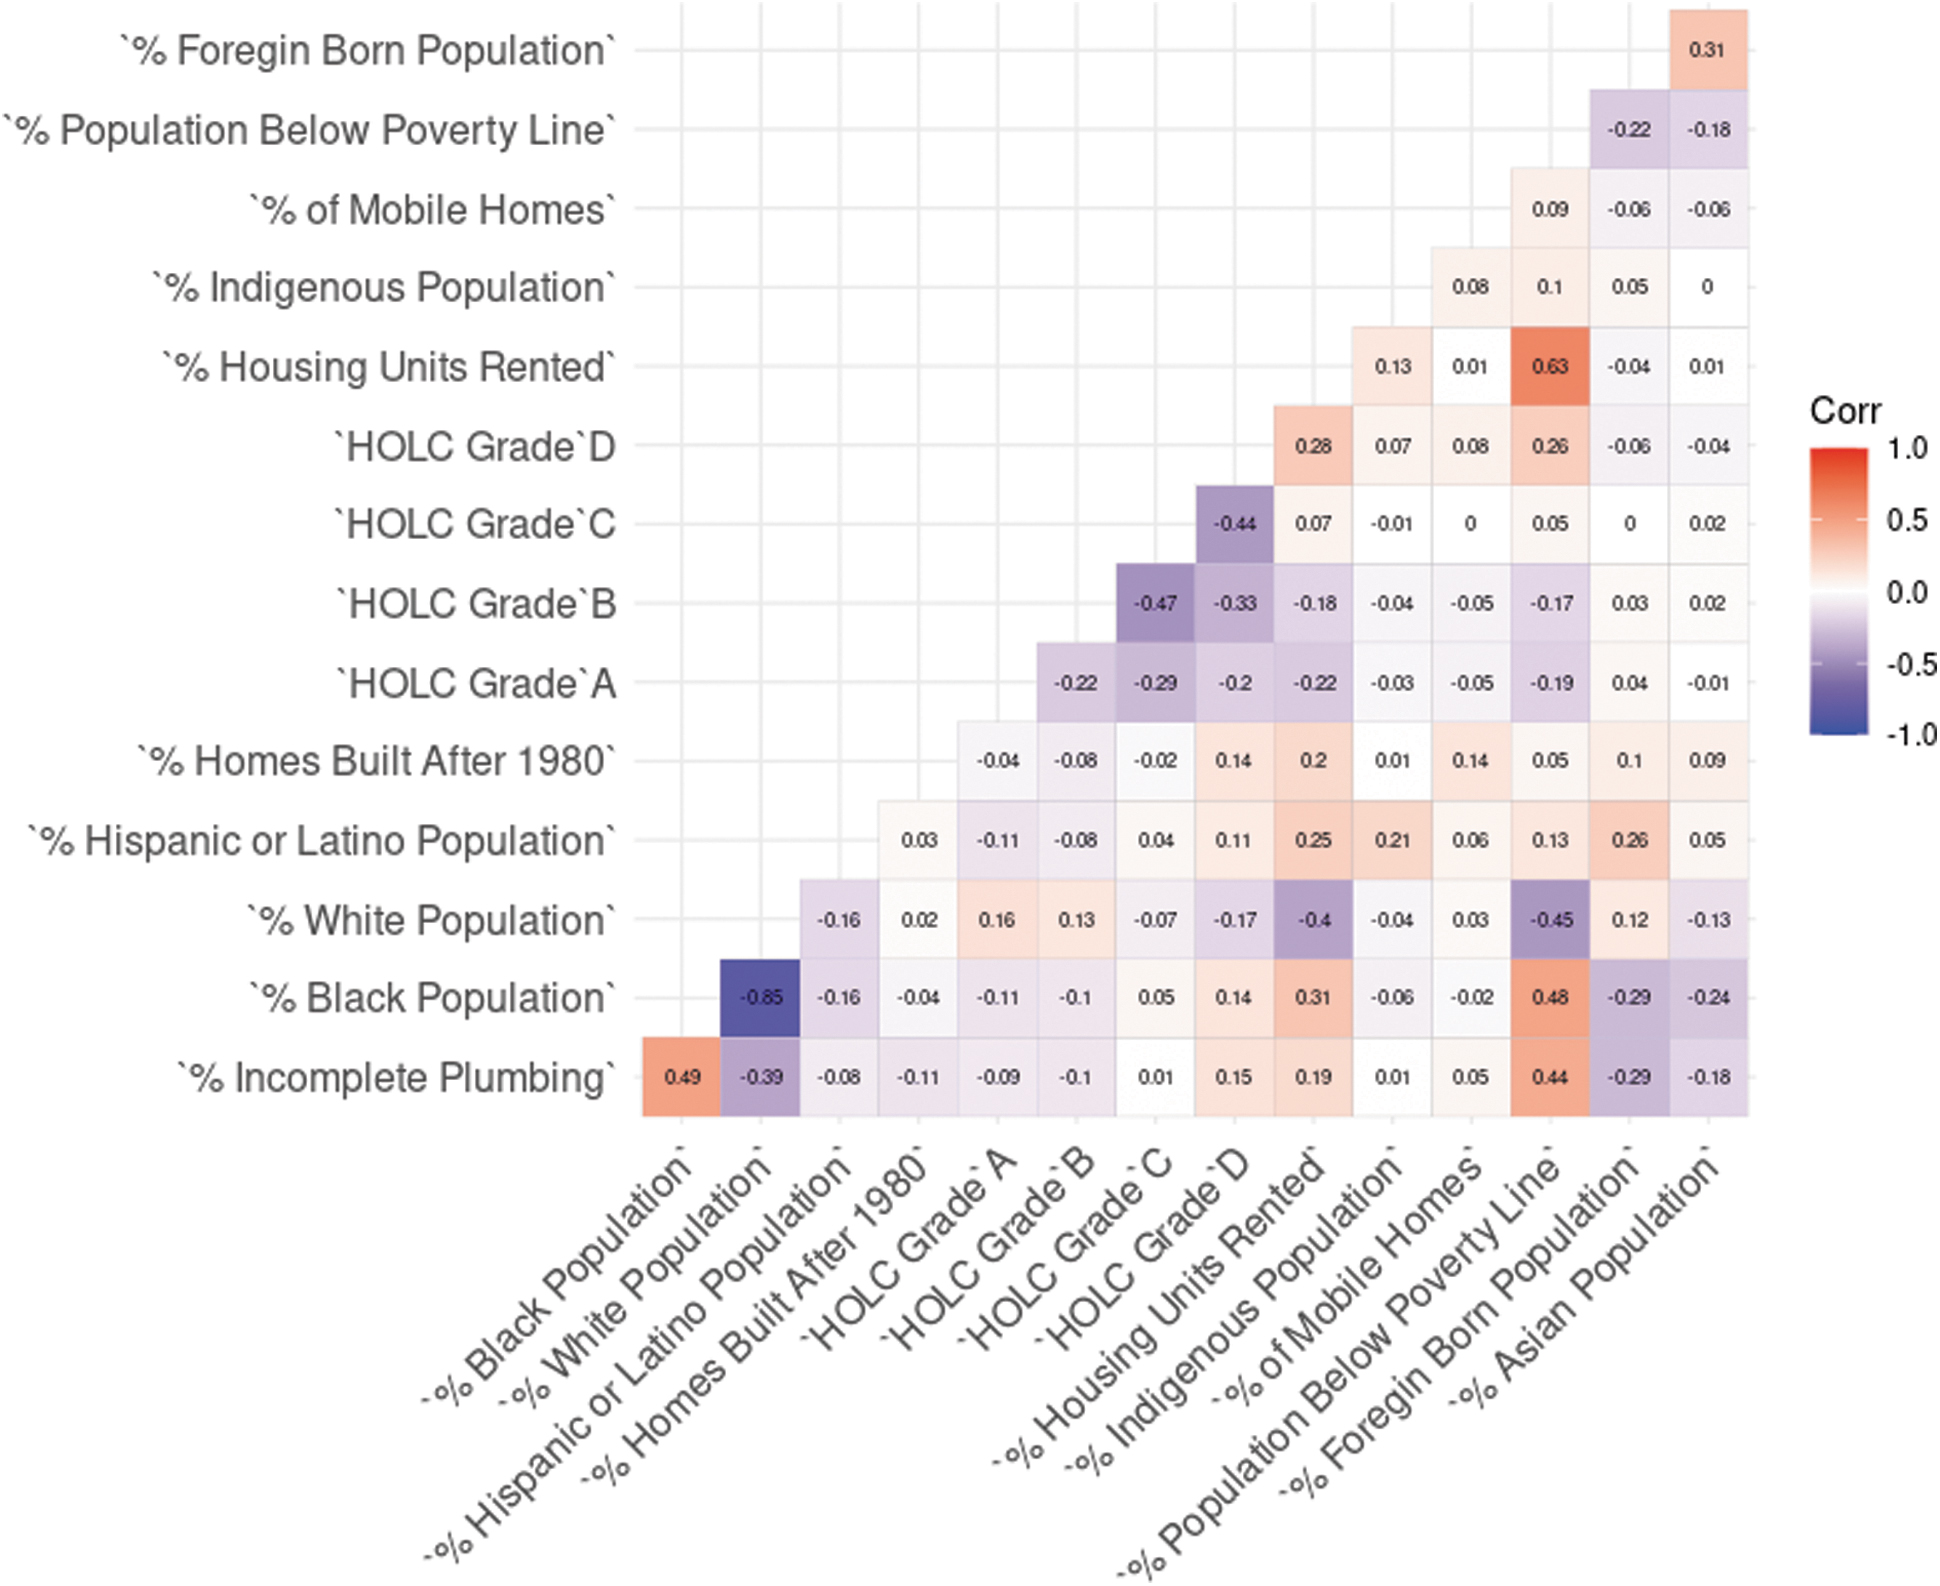
Correlation plot for potential predictive variables.
In addition to a national analysis, the data were also separated according to the four U.S. Census regions (Northeast, Midwest, South, and West) with binary logistic regression performed independently for each region to explore potential regional differences. Three records from the national data set were deleted from the model analysis because of missingness (not available/zero population). In the process of separating the data into four regions, one polygon was deleted because it fell between the regions. It is also important to note that polygons assigned HOLC Grade “E” were not considered in the full analysis (4 communities out of a total of 8878). HOLC Grade “E” was assigned to some majority Black neighborhoods before the standardization of the grades and was eventually phased out of the grading system. 56 Removing HOLC Grade “E” reduced the amount of “noise” in the model, increasing its statistical power.
Because the average rate of incomplete plumbing within our 202 metropolitan area data set was higher than the national average of 0.3% (2.61%; Supplementary Table S2) and varied between the four Census subregions (from 3.76% in the Midwest region to 0.78% in the West region), we also conducted the same analyses described using these average values as “breakpoints” defining below/above average incomplete plumbing nationally and for each region. To maintain uniformity throughout analysis, we primarily focus our discussion of the results using 0.3% (the national average) as the breakpoint, as results using regional specific breakpoints did not alter many findings of significance for the predictive variables (Supplementary Tables S3–S7; see the Results section).
RESULTS
The results from the national-level analysis echo previous research: a higher percentage of Black, Indigenous, and Hispanic or Latino populations, as well as higher household poverty, was significantly associated with a level of incomplete plumbing above the national average of 0.3% when holding HOLC grade constant (0.0044, 0.0186, 0.0012, and 0.0066; confidence interval [CI] = ±0.001, ±0.009, ±0.001, and ±0.001, respectively) (Fig. 3). Elevated incomplete plumbing was also significantly associated with HOLC designations C and D on a national scale after holding all other variables constant (0.0477 and 0.1352; CI = ±0.032 and ±0.036, respectively) (Table 1). These designations were also significant when using the overall average observed for these 202 urban areas (2.61%) as the breakpoint defining an elevated rate of incomplete plumbing (Supplementary Table S3).

Example maps for each of the four U.S. Census designated regions: (1) Midwest: St. Louis, Missouri; (2) Northeast: Buffalo, New York; (3) West: Oakland, California; (4) South: Birmingham, Alabama, created using Areal Weighted Interpolation. Each map displays the percentage of households without complete plumbing within each HOLC neighborhood.
Average Marginal Effects (i.e., Change in Probability for a 1% Change in Each Variable) as Determined Via the Binary Logistic Regression Model
Grade A was used as comparison baseline for statistical analysis of the HOLC grades. “Not in model” indicates that a variable was excluded from that model to reduce multicollinearity.
Significance codes: ***p < 0.001, **p < 0.01, *p < 0.05.
HOLC, Home Owners' Loan Corporation.
Results from the regional analysis yielded similar relationships between HOLC designation and incomplete plumbing for the Northeast and Midwest regions, although only HOLC designation D was significantly predictive in the West region (Table 1). HOLC designation was not related to higher rates of incomplete plumbing in the South region, regardless of whether national (Table 1) or local data set breakpoints (Supplementary Table S5) were used, which was unexpected. An increase in % Black population was associated with an increased probability of higher levels of incomplete plumbing for the South, Northeast, and Midwest regions, in keeping with national results (0.0041, 0.0052, and 0.0036; CI = ±0.001, ±0.002, and ±0.001, respectively).
These results were consistent regardless of whether the overall national average of 0.3% lacking indoor plumbing (Table 1) or local data set breakpoints (Supplementary Tables S4–S6) were used. The percentage of the Indigenous population was associated with an increased probability of incomplete plumbing for all regions, Northeast, Midwest, and West (0.0643, 0.0289, and 0.0242; CI = ±0.035, ±0.021, and ±0.017, respectively), except the South region, where it was not included in the model due to multicollinearity (Akaike information criterion [AIC] = 1862 in the original model and 1856 in the stepwise model); when using local data set breakpoints, it was also not included in the Midwest region.
Although the percentage of mobile homes in a neighborhood was significantly positively correlated with elevated incomplete plumbing nationally, in the regional analysis, this relationship only remained for the South region (Table 1). This relationship was unchanged when using local data set breakpoints. Both an increase in the percentage of houses built after 1980 and a decrease in the percentage of the population below the poverty line increased the probability of a higher rate of complete plumbing for all regions except the West region, where it was not included in the model (AIC = 1521.8 in the original model and 1511.7 in the stepwise model).
DISCUSSION
The results presented in Table 1 demonstrate a relationship between the redlining practices of the 1930s and present-day incomplete plumbing on a national scale; that is, more than 90 years later, community HOLC designations (particularly designations C and D) still impact the modern-day living conditions of those who live there. Notably, Black population had the highest correlation with HOLC Grade “D” (r = 0.14), whereas White population had the lowest (r = −0.17) (Fig. 2). Black population was also associated with elevated incomplete plumbing in most of the models (Supplementary Table S7). This finding is in keeping with our original hypothesis and is not surprising given that the practice of redlining specifically targeted Black Americans and that previous work has demonstrated tangible evidence of present-day economic and health inequities in redlined communities. 57 , 58 , 59 , 60
Although the establishment of the HOLC and practice of redlining are most associated with marginalization and disinvestment in predominantly Black communities, it is worth noting that the effect of Indigenous population percent on the probability of elevated incomplete plumbing was higher than any other demographic variable, while holding all other variables constant (Table 1). This is in keeping with national and more localized examinations of the interactions between race/ethnicity and water injustice in the United States. For example, Deitz and Meehan reported that Indigenous households are over three times more likely than average American households to have incomplete plumbing. 61
Application of the model to each of the four Census designated regions revealed significant relationships between HOLC designations and present-day incomplete plumbing in all regions, with the exception of the South region. This result was initially surprising, given that struggles against slavery, segregation, and structural racism are perhaps most well documented for this region. However, it is worth noting that the South region had a larger amount of HOLC Grade D polygons compared with other regions (Table 2). This most likely weakened the statistical power of this model to assess the relationship between redlining and elevated incomplete plumbing.
The Number of Each Grade Polygon in Each Data Set
The percentage of the total data set that this number accounts for is in parenthesis.
Regional differences in the relationships between specific races/ethnicities and higher levels of incomplete plumbing may reflect regional differences in demographics. Notably, the highest decrease in the probability of having an average or lower than average incomplete plumbing for the Hispanic or Latino population was observed in the American West, which may reflect denser areas of the Hispanic or Latino population (0.0028 [±0.001]). While 18.9% of the population is Hispanic or Latino nationally, four of the five states with the highest Hispanic or Latino populations are in the West (New Mexico: 50%, California: 40%, Arizona: 32%, Nevada: 29). 62 Interestingly, % Foreign-Born was associated with a decrease in incomplete plumbing; that is, a higher percentage of foreign-born was significantly predictive of communities with higher complete plumbing than the national average, at the national level, and specifically for the Northeast and Midwest regions. This may reflect regional differences in demographics.
Although the history of redlining has previously been used as a lens to examine the historical causes of other present-day inequalities, including environmental health, to the best of our knowledge, this is the first study to explicitly examine the potential effects on water infrastructure, although previous publications have hypothesized a connection. 63 , 64 When considering the relevance of this effort to ongoing discussions of water inequities within the United States, several key inherent methodological limitations must be considered. As previously mentioned, the examination was limited to available digitized HOLC maps. The original goal of HOLC was to increase economic growth in urban areas. 65
Therefore, the work does not consider incomplete rural plumbing, which previous national examinations suggest is of significant concern. 66 The U.S. regions are not as finite as census block groups, resulting in the loss of five polygons (communities). It is worth noting that while it appears that redlining did significantly influence infrastructure development, it was likely not the sole cause, and instead part of a myriad of interconnected drivers, including local political histories, landscapes, available technology, economic opportunities, and justice movements. Future transdisciplinary efforts linking historical examinations of infrastructure development at the individual city scale considering all these factors are encouraged to identify necessary strategies to reduce these disparities.
CONCLUSIONS
The results of this analysis support our initial hypothesis that the 1930s practice of redlining significantly impacts access to plumbing in present-day America: when historical HOLC boundaries are applied to modern-day Census block groups, present-day plumbing status is dependent on whether the neighborhood was designated as “less desirable” or “hazardous” (i.e., HOLC Grades “C” and “D”), holding all demographic variables and other HOLC Grades in the model constant. This trend was consistent for the Northeast, Midwest, and West regions, although the influence of specific minority populations differed, perhaps because of regional differences in demographics and urbanicity.
Although this work adds compelling evidence of how redlining continues to shape the demographics, wealth, natural resources, and health of present American communities, significant questions remain and demand an interdisciplinary approach. The history of the implementation and impact of redlining can be localized: understanding the decision making, process, and experience of infrastructure exclusion within individual cities will require shared examinations by historians, economists, urban planners, and engineers. 67 Understanding potential shifts in the impacts of HOLC designation on community infrastructure access over time, rather than solely comparing with present-day metrics, may yield insights into how past socioeconomic movements and stressors contributed to the persistence of this structural inequity.
Although the Flint, Michigan, lead crisis captured public attention in 2014 68 and led to increasing public and academic awareness of present-day water inequity within the United States, 69 , 70 new water crises within predominantly Black cities continue to emerge. 71 , 72 , 73 , 74 Historical evidence has made clear that the divestment from communities of color was intentional. Policies were put in place to increase the gap of equity between racial groups. 75 , 76 , 77 Identifying both present-day and historical political, economic, and sociological forces that contribute to these crises is critical to the design of just, sustainable, and long-term equitable solutions to ensure high-quality and affordable access to water and sanitation services. Awareness of the impacts of redlining on community development, as well as the identification of neighborhoods that continue to suffer its consequences, is essential to prioritize future infrastructure investment. While federal level funding and oversight are necessary, decisions related to infrastructure and housing investment are likely best led at the local level and must include those within marginalized communities.
Footnotes
ACKNOWLEDGMENTS
The authors gratefully acknowledge the assistance provided by the Statistical Applications and Innovations Group at Virginia Tech for the confirmation of the methods.
AUTHORs' CONTRIBUTIONS
This study has not been previously published. This article is not under consideration for publication elsewhere. All authors have read and agreed to the contents of the submission and have contributed substantially to the work. C.W.S.III.: Conceptualization, methodology, writing—original draft, visualization, funding acquisition, and investigation. L.-A.K.: Writing—review and editing, supervision, and funding acquisition. T.P.: Methodology, software, resources, and writing—review and editing. L.W.: Investigation, resources, and writing—review and editing.
ETHICAL COMPLIANCE
All procedures performed in studies involving human participants were in accordance with the ethical standards of the institutional and/or national research committee and with the 1964 Declaration of Helsinki and its later amendments or comparable ethical standards.
AUTHOR DISCLOSURE STATEMENT
No competing financial interests exist.
FUNDING INFORMATION
C.W.S.III. was supported by the George Washington Carver Fellowship.