
Abstract
Regulations requiring ambient air monitoring at oil refinery fencelines have resulted in new data about air quality in fenceline communities. However, these data do not fully address environmental injustices unless communities can create and access interpretations that meaningfully represent their experience. The Refinery Air Watch website (refineryairwatch.org) further promotes environmental justice by making fenceline monitoring data readily available for download, offering metrics that highlight, rather than minimize, the impact of pollution on communities, and illustrating the systemic problems of refinery pollution through comparisons of facilities, corporations, and states. Refinery Air Watch has yielded insights useful to community members in their advocacy on local issues, as well as the recommendation that policies for fenceline monitoring include requirements for data infrastructures, such as application programming interfaces for all data and websites that offer users the ability to download data.
INTRODUCTION
In November 2022, the Fair Tech Collective, in partnership with SAYGRID and the Air Watch Bay Area Working Group, launched Refinery Air Watch (refineryairwatch.org), a website that enables users to download fenceline monitoring data from U.S. oil refineries and compare refinery performance across the country. The site helps ensure that new regulatory requirements for fenceline monitoring actually support environmental justice (EJ), which calls for communities not only to have access to information, but also be able to interpret it in ways meaningful to them.
The site does so by providing a user-friendly infrastructure to download data, highlighting data that are not available for download, synthesizing data into metrics that indicate a refinery's impact at a glance, and comparing the performance of refineries, states, and companies to illustrate the systemic nature of the problem of refinery pollution. Creating the site has resulted in recommendations for fenceline monitoring programs to include data infrastructure requirements to promote EJ, and residents of fenceline communities are beginning to use insights from the site in their local advocacy.
RATIONALE: FENCELINE DATA AND EJ
Access to accurate information is a key tenet of EJ 1 and supports communities' ability to participate in policy processes that value scientific data over local knowledge. 2 However, not all information is equally responsive to or representative of community concerns, and poorly designed studies may undermine EJ by appearing to exonerate polluters or invalidate communities' lived experience. 3 Research positing epistemic justice as an aspect of EJ suggests that communities and their allies need the means to pursue data and craft metrics that represent pollution as they experience it. 4 Information systems that promote EJ, then, should enable communities to interpret or reinterpret raw data in ways consistent with their concerns, and/or access interpretations relevant to their experience.
These standards have not been met by recent rules requiring oil refineries to measure ambient concentrations of hazardous air pollutants at their fencelines. These rules, especially the U.S. Environmental Protection Agency (EPA)'s 2015 update to its Petroleum Refinery Sector Rule 5 and California's 2017 law, AB-1647, 6 were vigorously supported by EJ activists. For decades, activists had decried the injustice of regulatory monitoring networks that sited air monitors miles away from polluting industrial facilities and the communities most affected by them. 7 These new rules ensured for the first time that the communities would have access to data about pollution levels in their immediate area.
The data produced under the rules have their limits. The EPA requires only long-term (2-week) measurements of only one pollutant (benzene). In California, where the law does require real-time measurements of multiple pollutants, there is no standard list of pollutants to be measured, and poor data quality has been an on-going issue. 8 Nonetheless, even limited data can offer opportunities to quantify the impact of refineries on nearby communities. Companies and the EPA, however, have presented the data in ways that downplay refineries' impact.
California refineries' fenceline monitoring websites, for example, compare current pollution measurements to health standards. Although such information could inform emergency response, it does not speak to the “slow violence” of chronic exposures. 9 The 2-week benzene measurements required by the EPA are reported along with a calculated “net concentration” (ΔC) value that absolves refineries of responsibility for background levels of benzene and obscures the information most consequential for human health. 10
These are not the only interpretations possible. 11 Communities and researchers could use the data to create alternative metrics, if they could access the data in a machine-readable format that permitted reanalysis. However, access to the data has been cumbersome at best, impossible at worst. Until the fall of 2022, the only way to obtain the fenceline benzene monitoring data required by the EPA was to download Excel spreadsheets, one per refinery per quarter (3 months), through the agency's Webfire site, a process that required knowing what Regulatory Part, Code of Federal Regulations (CFR) Part, and CFR Subpart to select from a series of menus.
With the release of its Benzene Fenceline Monitoring Dashboard, the EPA made it significantly easier to download data, but the site's complexity and slowness may continue to be obstacles to users. Data from continuous fenceline monitoring in California have been readily available for viewing, but none of the websites that present monitor readings enable users to download the data, and all limit the extent to which a user can look back at historical data. Results more than a month old (sometimes less) are unobtainable. Without the ready ability to download fenceline monitoring data in a machine-readable format, communities are reliant on minimizing interpretations provided by refineries and the EPA.
DEVELOPMENT: DATA INFRASTRUCTURE FOR EJ
Refinery Air Watch was created to overcome and highlight the limitations of infrastructures for accessing fenceline monitoring data. Specifically, it aimed to ensure that data were presented in a way that supported EJ, by enabling communities to reinterpret data in a manner meaningful to them, and offering access to interpretations that better represent community experience.
Contributors
The project was led by the author's university-based research group, the Fair Tech Collective, which uses social science to promote justice in science and technology. Participants comprised students and volunteers from a variety of backgrounds, including software engineering, data science, social science, and design. We contracted with the graphic design firm SAYGRID to create the site's logic and user interface.
Refinery Air Watch extended the Fair Tech Collective's collaboration with the Air Watch Bay Area Working group, a collection of residents from communities in proximity to northern California oil refineries (Valero in Benicia and Phillips 66 in Rodeo), with whom we have been working on issues surrounding the interpretation of fenceline monitoring data since 2016. The working group provided guidance and feedback throughout the development process, which was funded by a grant from the Benicia Good Neighbor Steering Committee.
Download access
To render data available for interpretation and analysis, we first created a database to store and manage fenceline benzene data submitted to the EPA by each of the nation's oil refineries. The database compiled in one place data that had previously only been available in a series of spreadsheets, divided up by refinery and quarter; in other words, it constituted data into a data set. To the database we added fields for information that could be relevant for future analysis, like each refinery's parent corporation.
We also established a database for continuous monitoring data of the type required by the state of California. We populated the database with information about the refineries conducting continuous monitoring and the pollutants for which they monitor. In most cases, however, we were unable to populate the database with the actual monitoring data, because the websites where data are displayed provide no means for downloading the data or accessing it through an application programming interface (API).
Although scraping data from the sites may have been feasible, we have found that scrapers tend to be unreliable, and we were reluctant to appropriate data from privately run sites without clear stipulations about data licensing and use. At the time of writing, the continuous monitoring database includes only data from the Benicia Community Air Monitoring Program, a community-run effort that provided us with access to their data through an API.
We then created a website to make it easy to download data from our databases. Visitors to Refinery Air Watch land on a map of the nation with each oil refinery represented by a dot. Hovering over a dot brings up a box that names the refinery, indicates how many pollutants are being measured, with what frequency, and invites the user to download data or compare the refinery to others (Fig. 1).

Refinery air watch landing page shows individual oil refineries in national context.
Users who click through to the download page are offered the ability to select pollutants and dates for which they want data. Unlike other sites that provide access to air quality data, Refinery Air Watch shows not only data that are available for download, but also data that are not available and should be. The download page lists all the possible pollutants for which you might expect to be able to access 2-week measurements (benzene) and continuous measurements (every pollutant measured by at least one fenceline monitoring program, a total of 42 in all).
Pollutants for which data are available are highlighted yellow and have a checkbox next to them. Pollutants that are measured but for which measurements are not made available are highlighted in gray, and their checkboxes have a slash through them. Pollutants that are not measured have a “?” in their checkbox (Fig. 2).
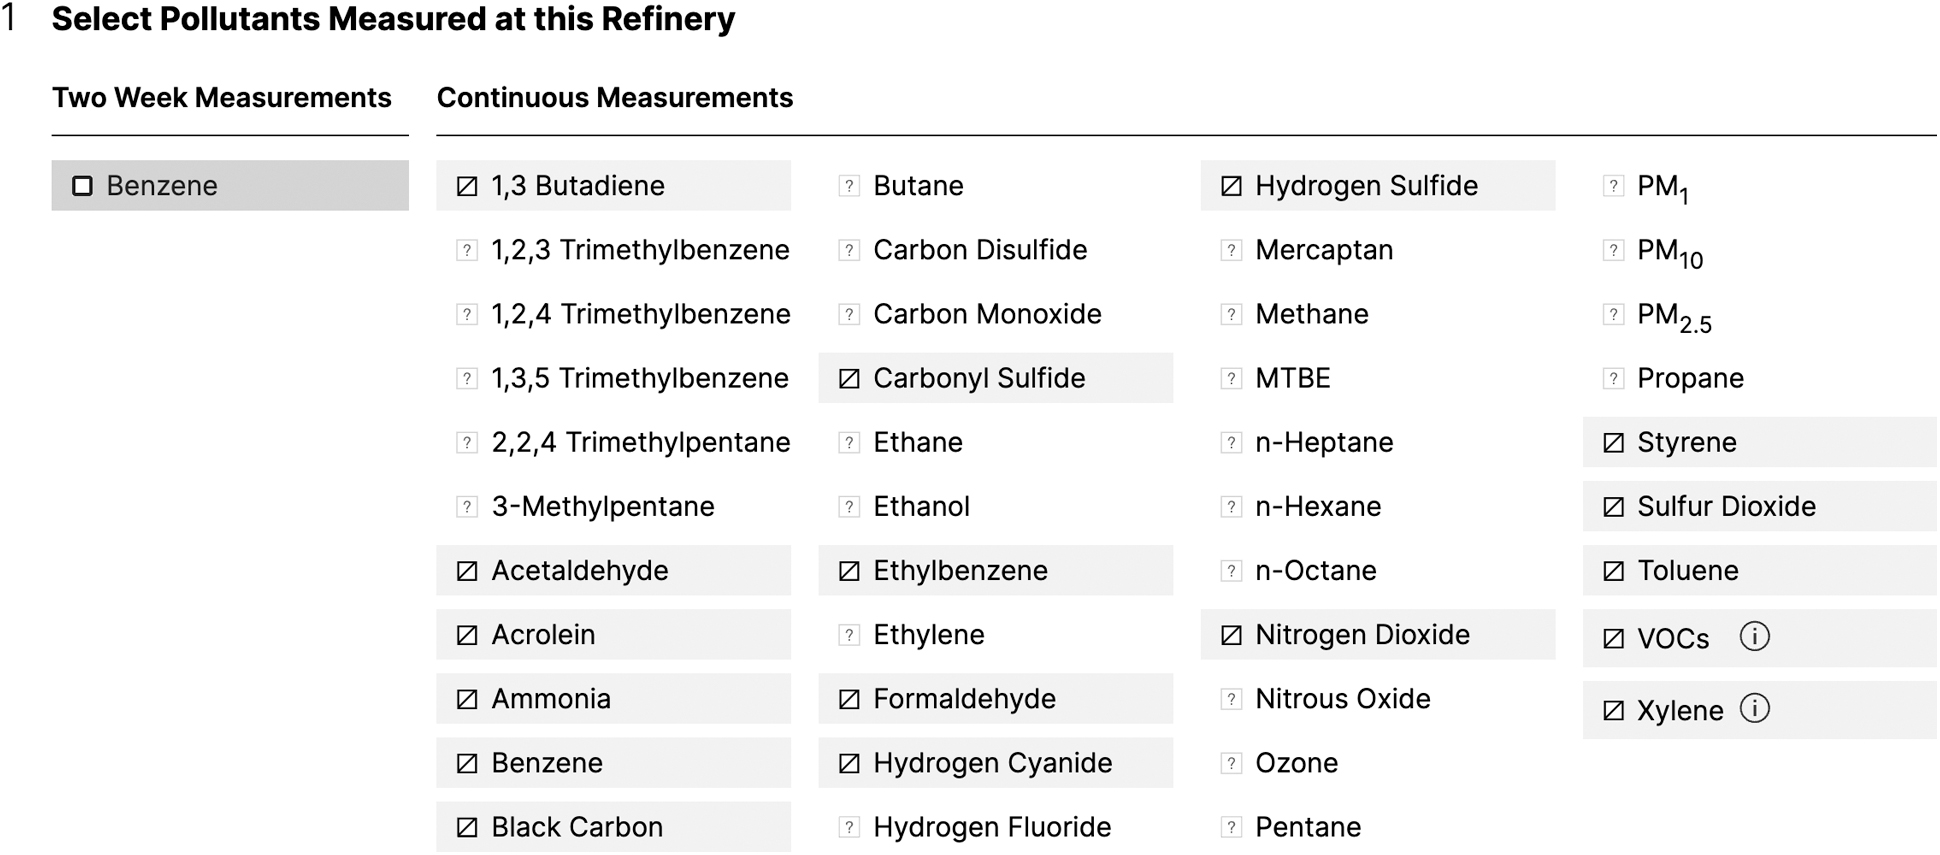
Download options visualize missing and inaccessible data.
The download page further highlights these absences of data with three statements about the extent and accessibility of monitoring data that appear in a panel with refinery information (Fig. 3). The first statement gives the number of pollutants measured every 2 weeks (currently 1 for all refineries, per the EPA's rules) and the number of pollutants measured continuously. The number of continuously measured pollutants is zero for refineries outside of California. The second statement indicates how much of the continuous monitoring data is available for download.
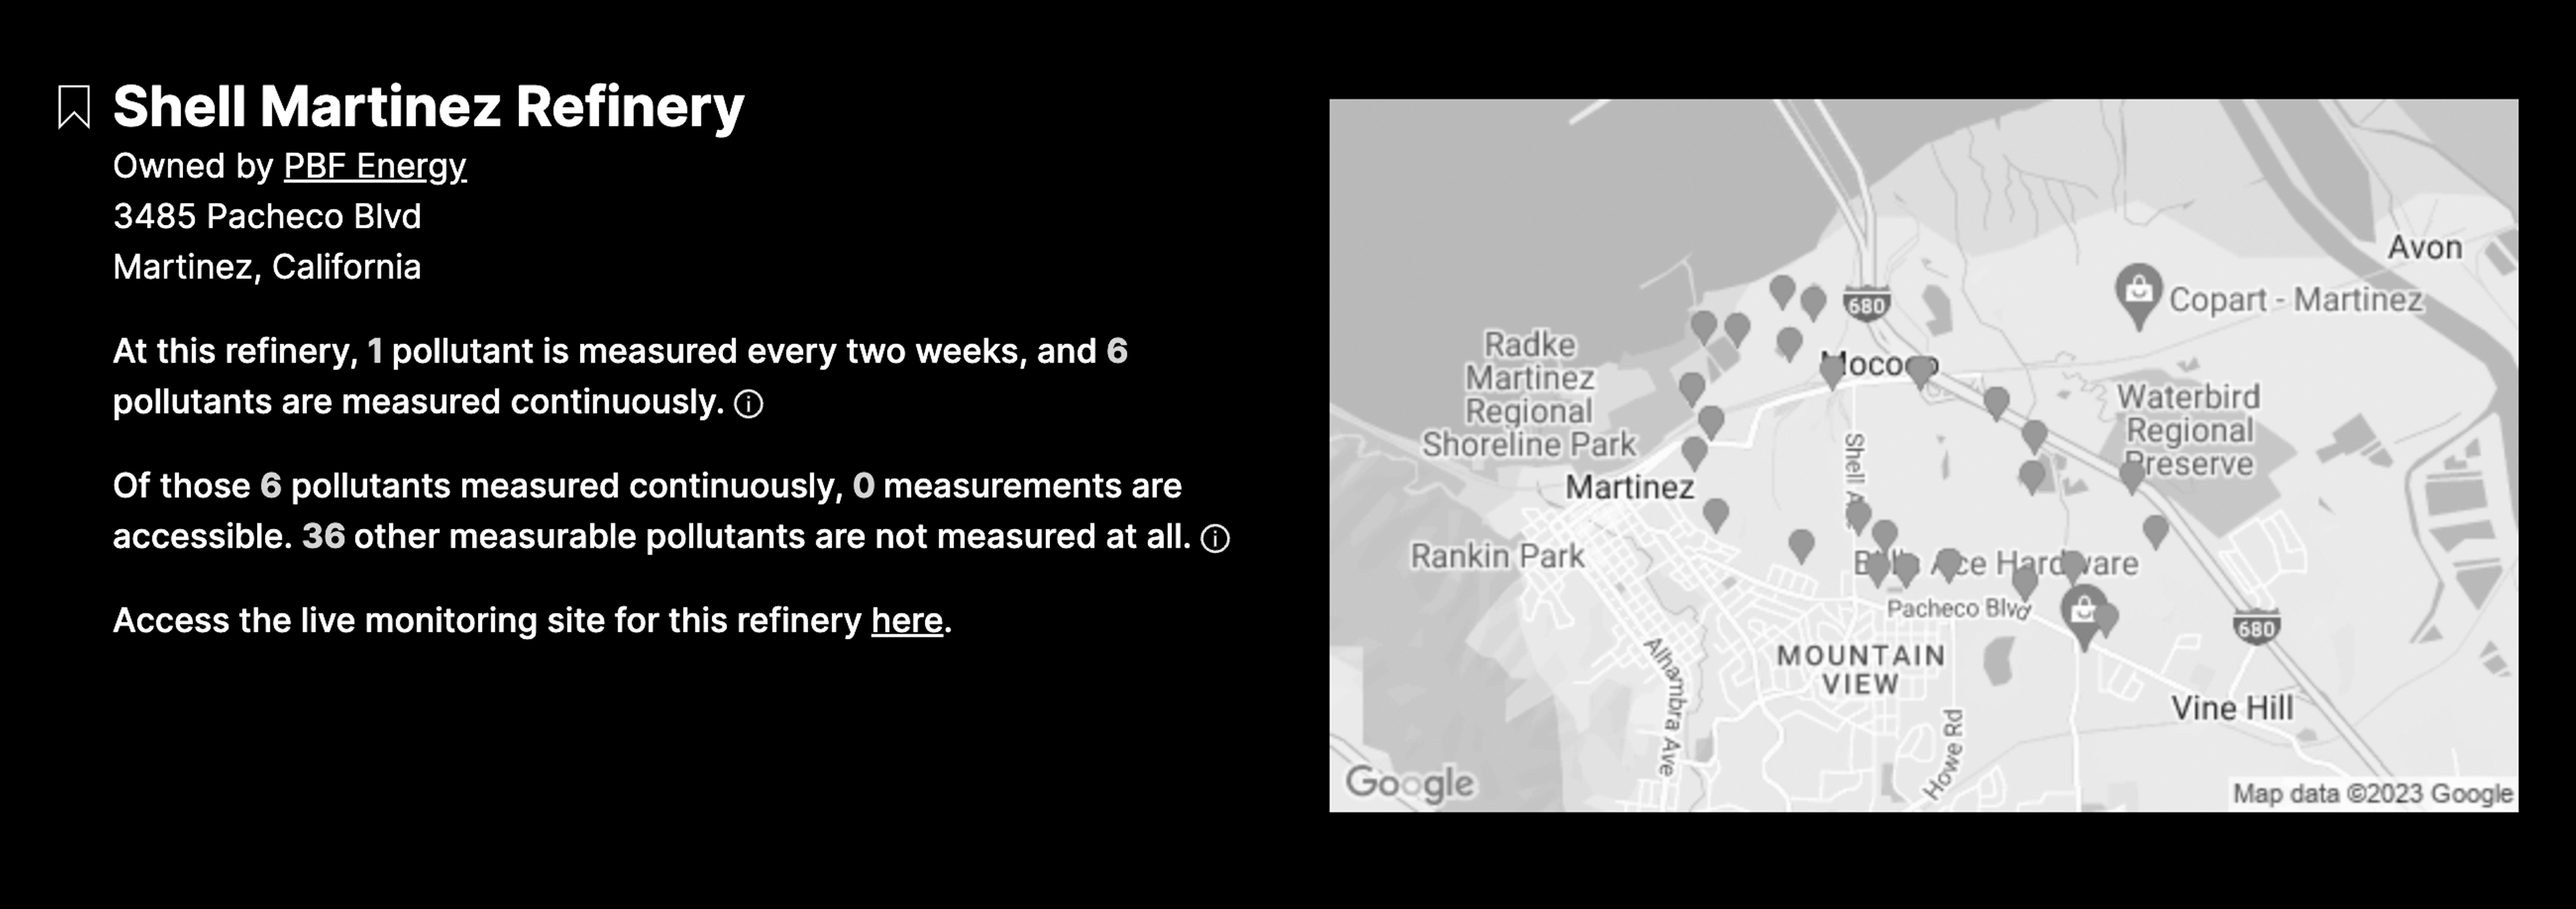
Download page header indicates the extent and accessibility of monitoring data.
“Of those 18 pollutants measured continuously, 0 measurements are accessible,” is a typical statement for California refineries. The final statement gives the number of pollutants that could be measured continuously but are not. The number of pollutants listed in the final statement as not being measured is 42 for most refineries, and fewer (but not zero) for California refineries.
Metrics and comparisons
Providing access to data for communities to reinterpret does not fully meet EJ needs. Frontline communities should not necessarily be expected to have time or resources to devote to data analysis; therefore, offering interpretations of data that avoid minimizing refinery impacts or undermining residents' understandings is also important. As part of developing Refinery Air Watch, we created three metrics to characterize each refinery's benzene levels in a nonminimizing way: the average of all benzene measurements, the highest measured concentration, and the number of “unhealthy weeks,” two times the number of sampling periods during which one or more benzene concentration measured at the refinery's fenceline exceeded 3 μg/m3, the reference exposure level set by the state of California.
Each of these measurements is calculated using the most recent year's worth of available data from 2-week benzene measurements submitted to the EPA. (We did not include any metrics for continuous monitoring data because we have access to so little of it.) These three metrics are displayed prominently on each refinery's download page (Fig. 4).

Metrics help make sense of available data.
Although the hazards posed by petrochemical facilities are often considered on a community-by-community basis, petrochemical pollution is also a systemic problem that merits national and international responses. The EPA's 2015 fenceline monitoring requirement created a potentially powerful tool for addressing the problem in a larger-than-local way: the first national data set of ambient benzene concentrations at refinery fencelines. Refinery Air Watch takes advantage of the data's nationwide scope by offering a series of comparisons, based on the metrics described above, that suggest possible systemic drivers of local pollution.
The comparisons page lists all refineries with their average benzene concentrations and marks the 20 with the highest average concentrations. Although the default order is alphabetical, the user can choose to order the list by average benzene concentration. Our original design also included an ordinal ranking for each refinery, but members of our working group felt that this made for confusing terminology, especially for refineries with relatively lower average benzene concentrations (e.g., 115th worst out of 116). We also worried that declaring a refinery among the least bad could be invalidating to those who felt endangered by the facility. As a result, the refinery ranking was eliminated from the site.
Tabs to compare by corporation and state flesh out the national picture of fenceline benzene concentrations (Fig. 5). Shown are the number of refineries in a state or owned by a given corporation, the number among the 20 with the highest benzene concentrations, and the average number of “unhealthy weeks” across the state or corporation's refineries.

Comparisons across states take advantage of a national data set.
You can see from our comparisons that, for example, 17 of the 20 refineries with the highest average benzene concentrations are located in Texas (13) and Louisiana (4), even though the two states are home to only 42 of the 119 refineries included in our database. Seven of those 20 belong to corporations that own only one refinery, and only three corporations operating with multiple refineries (Valero, Exxon Mobil, and PDV America) have more than one on the 20-worst list. 12
IMPACT
Through the process of designing and building the site, we found that technical aspects of the infrastructures for storing, displaying, and accessing data stood in the way of communities and researchers analyzing or reinterpreting data to more meaningfully represent community experience and concerns, thus hindering epistemic and environmental justice. This is in part because fenceline monitoring regulations tend to specify what data must be collected, but not how they ought to be handled subsequently.
To help ensure that fenceline monitoring rules do support EJ, we proposed a series of measures that should be included to address potential shortcomings in data infrastructure. We recommend that APIs be provided for all data; that APIs be public, open, documented, and regularly maintained; that raw data and metadata be made available; that monitoring data be stored on hosted cloud services; that data interfaces be Americans with Disabilities Act-compliant and allow users to download data in .csv format (i.e., in a file readable by Excel); that funding be provided for communities to collaborate with researchers on data interpretation; and that other measures be taken to ensure data quality, public access to data, monitoring system resilience, and community engagement. 13
These findings from the creation of Refinery Air Watch were incorporated into Earthjustice's 2022 report highlighting the need for reforms to California's fenceline monitoring rules, 14 and subsequently informed the provisions of a California state Senate bill (SB-674) that would extend and strengthen the state's fenceline monitoring requirements. 15
Communities are still finding our site and determining how and whether it can be useful to them. We do have early anecdotal indications that the site's metrics and comparisons have been taken up by fenceline community residents advocating for change at the local level. Information from our site indicating that the Valero refinery in Benicia, California, in 2022 had the most “unhealthy weeks” of any refinery in the state was cited by proponents of an Industrial Safety Ordinance (ISO) as one reason the law was needed. In December 2023, the Benicia City Council agreed to move forward with drafting an ISO.
In nearby Rodeo, California, the Phillips 66 refinery has among the lowest average benzene levels in the country, a fact that one community member used in her efforts to persuade the company to embrace fenceline monitoring, because of its potential to show that the refinery was performing well. In addition, we hear from working group members how their takeaways from the site have informed their advocacy. One says the site impressed upon her how much we don't know; another says California's good performance relative to Gulf Coast states underscores how important government regulation is to protecting communities like hers.
CONCLUSION
One of the many manifestations of environmental injustice is a lack of information about what is in the air in the communities nearest to polluting facilities. The expansion of fenceline monitoring requirements, long demanded by communities, only partially addresses this issue. EJ encompasses epistemic justice, which suggests the need for communities to be able both to analyze data themselves and to access interpretations that meaningfully represent their experience.
Unlike government- and industry-run websites for fenceline monitoring data, Refinery Air Watch furthers these goals by making fenceline benzene data readily available for download, and by offering metrics and comparisons that highlight both the impact of refinery pollution on specific communities and the systemic problem of pollution across the country. In creating Refinery Air Watch, we identified features of data infrastructure necessary to support EJ goals, resulting in recommendations for improved fenceline monitoring policies.
Our hope is that Refinery Air Watch can be a temporary solution to the on-going limitations of information about air quality at refinery fencelines, and that in the future, governments and facilities will take on the obligation of providing robust infrastructures to foster data access and use, as a routine part of monitoring programs.
Footnotes
ACKNOWLEDGMENTS
Contributors to Refinery Air Watch include Sufyan Abbasi, John Bowman, Constance Beutel, Janet Callaghan, Jay Gunkelman, Jeffrey Finn, Liam Kane, Kathy Kerridge, Steven Mangione, Andee Mazzocco, Hiep Ngyuen, Erin Poole, and Nancy Rieser. We thank Keene Kelderman at the Environmental Integrity Project for his help streamlining the database update process. Thanks also to the CREATE Lab, the National Science Foundation (Award #1352143), and Dawn Nafus for their support of the Air Watch Bay Area project, from which we learned so much.
AUTHOR'S CONTRIBUTION
G.O. is responsible for the conceptualization and writing (original draft as well as review and editing) of this article. Individuals involved in the creation of the website on which it reports are listed in the Acknowledgments section.
AUTHOR DISCLOSURE STATEMENT
No competing financial interests exist.
FUNDING INFORMATION
Refinery Air Watch was made possible by a grant from the Benicia Good Neighbor Steering Committee.