
Abstract
Under-served and impoverished communities can be exposed to the worst climate and environmental hazards. Community managers must identify these potential hazards and build resilience to withstand them. Enhancing community resilience requires three major steps: (1) Examining available information, (2) Conducting community engagement and assessing local knowledge, and (3) Developing and implementing reasonable strategies to enhance resilience. This article examines the first component of this three-step approach in the Mid-Atlantic region of the United States. First, information concerning existing county-level resilience to climate hazards, including well-being and climate/social equity, was evaluated using selected existing models and tools. These climate hazards included inland flooding, variations in temperature, landslides, tropical storms, and other potential natural climatic hazards in the mid-Atlantic region of the United States. Through evaluation with EPA Regional staff and the use of Environmental Justice 40 information, social justice and environmental justice communities were selected to develop further climate resilience capacity strategies addressing possible adverse community outcomes of natural hazard events. Continuing studies beyond the evaluation of available data will be described elsewhere. They will examine local knowledge and community engagement to gauge the success of the community engagements, determine potential strategies to enhance resilience, develop plans for local implementation, and assess the transferability of the approach to other candidate communities.
INTRODUCTION
Increasing evidence from across the United States suggests changes in the location, frequency, and impact of hazards associated with climate change. 1 Much of this evidence is global, but the impacts of the changes are felt locally, and building local resilience capacity is necessary to combat these impacts. In addition, environmentally, socially, and economically challenged communities often bear most of these climate impacts.2,3,4
The risks from climate change natural hazards (i.e., extreme weather) are increasing and significant. Extreme weather causes significant damage not only to immediate loss of life and assets but also to longer-term damage to livelihoods and economies.5,6 Societies are not resilient enough to extreme weather today. Media reports of massive wildfires, 7 increased frequency of tornadoes, 8 expansive heat domes, 9 and large-scale flooding 10 and their resulting impacts are a current testament to this lack of resilience. Regulatory actions and decisions must be taken by the international community, governments, local policymakers, communities, the private sector, and non-governmental organizations to enhance resilience capacity. 11 Communities can be protected from the direct impact of extreme weather and enhance their abilities to recover from such events by using innovative approaches (e.g., governance changes and building codes) based on a growing understanding of the role of the natural environment in reducing hazards and by recognizing the importance of mobilizing community support. 12 While important international agreements can be reached about disaster risk reduction and climate change, 13 it is essential to realize that local community-level actions have significant, immediate, and direct impact on building resilience capacity in response to climate change.14,15,16
Due to limited funds, many governmental agencies must prioritize which regions, states, counties, and communities would benefit most from their programs. If the programs relate to resilience, the agencies need to know those entities’ present resilience level. Comparing some measures of resilience (e.g., Climate Resilience Screening Tool 17 ) across counties for a large region would delineate which counties would benefit most from a resilience enhancement program. These measurements could be coupled with other socioeconomic, environmental, or climate justice measures to hone further the potential counties that would benefit from the agency’s program.
In this spirit, researchers at the Environmental Protection Agency (EPA) developed a project to enhance local resilience to natural hazards in select disadvantaged communities in the U.S. Mid-Atlantic region (Region III). The project is envisioned in three parts: (1) examining available information, (2) conducting community engagement and assessing local knowledge, and (3) developing and implementing reasonable strategies to enhance resilience. The first of these activities examining available information is the subject of this manuscript. The second activity is introduced, and the second and third activities will be addressed in future articles.
The goal of Step #1 of the project is to select disadvantaged communities that would significantly benefit from enhancing resilience capacity to climate-related natural hazards. This effort uses multiple indices to examine existing community resilience, overall community well-being, and the level of social and economic disadvantage in the counties/communities in the Mid-Atlantic region of the United States. These indices are commonplace in comparative analyses, and the four described in the Methods Section have been used in many assessments.18,19,20,21,22
While several significant national and regional efforts to address enhancing resilience to climate-related events exist, many local actions are being taken by individual communities and smaller-scale governmental entities (e.g., counties) to develop their resilience to these events. While these two camps of approaches are complimentary, many proponents of local action point to promoting adaptive capacity and the need to balance bottom-up flexibility with top-down hierarchical control.23,24,25 Finally, several terms used throughout this manuscript need to be defined operationally for this project—resilience, community capacity, and disadvantaged communities. Resilience is the ability to withstand or recover quickly from difficulties. At the same time, community capacity is the interaction of human, social, and organizational capital existing within a given community that can be leveraged to solve collective problems and improve the well-being of that community. A disadvantaged community is defined in the sense of the Justice 40 initiative, 26 where a community is considered “disadvantaged” if the census tract is above the threshold for one or more environmental or climate indicators and the community is above the threshold for socioeconomic indicators.
METHODS
Region III of the Environmental Protection Agency serves five states in the mid-Atlantic Region of the United States—Delaware, Maryland, Pennsylvania, Virginia, West Virginia, and the District of Columbia. Several indices were examined to determine the level of natural hazard resilience, well-being, and the level of environmental, social, and economic challenges in the counties in these states. These included the Climate Resilience Screening Index (CRSI), 27 the Human Well-Being Index (HWBI),28,29 the Environmental Justice Screening Tool (EJScreen), 30 and the Climate and Economic Justice Screening Tool (CEJST). 31 These indices and tools were selected as the Environmental Protection Agency and the Council on Environmental Quality routinely use them. CRSI is the predominant index used to assess resilience to natural hazards, and CEJST is the primary index used to assess Justice 40 communities. HWBI and EJScreen were used to confirm the CRSI and CEJST findings. The Federal Emergency Management Agency (FEMA) Risk Index was not used as it was unavailable when this assessment was completed. Application of the FEMA Risk Index confirms the selections. Even if the FEMA Risk Index were available, it confounds the ability to assess “why” a high score is achieved as it integrates risk and impact, while CRSI allows the separation of exposure to a hazard and the impact of and recoverability from a hazard.
The approach to this resilience-building process comprises three major steps, followed by implementation and assessment of transferability (Fig. 1). The first step examines the available data for the counties in EPA Region III. This examination assesses available information to gauge each county’s well-being, resilience to natural hazards, and environmental/climate/socioeconomic attributes. Based on model results and expert opinion, candidate counties are selected for resilience capacity building. The next step of the capacity-building process is community engagement and the assessment of local knowledge to confirm the findings of the available data. The final step of the resilience-building process is the development of strategies to address the resilience shortcomings identified in the previous steps. Steps 2 and 3 will be examined in companion manuscripts. The assessment of available information (Step 1) is the subject of this paper. These three steps will be followed by local implementation of the strategies developed in Step 3 and an examination of the transferability of the overall process to other counties in EPA Region III or throughout the United States.The conceptualization and structure of the CRSI is discussed fully in Summers et al.32,33 CRSI includes five domains composed of 20 indicators, which, in turn, were derived from 117 unique metrics. Figure 2 details the final CRSI framework, including the domains and indicators expressed at the county level. The selection of the domains and indicators are completely described in Summers et al.25 and are summarized here for completeness. The domains include risk, governance, society, built environment, and natural environment. Under the concept of fundamental community resilience to natural hazards being driven by the likelihood of an event occurring and the community’s preparation for such an event, the domains of risk and governance are included at the base of the conceptual model (Fig. 2) to denote essential resilience as some relationship between risk and preparedness. Exposure and losses comprise the indicators for risk, while community preparedness, personal preparedness, and natural resource conservation, representing the governance indicators.
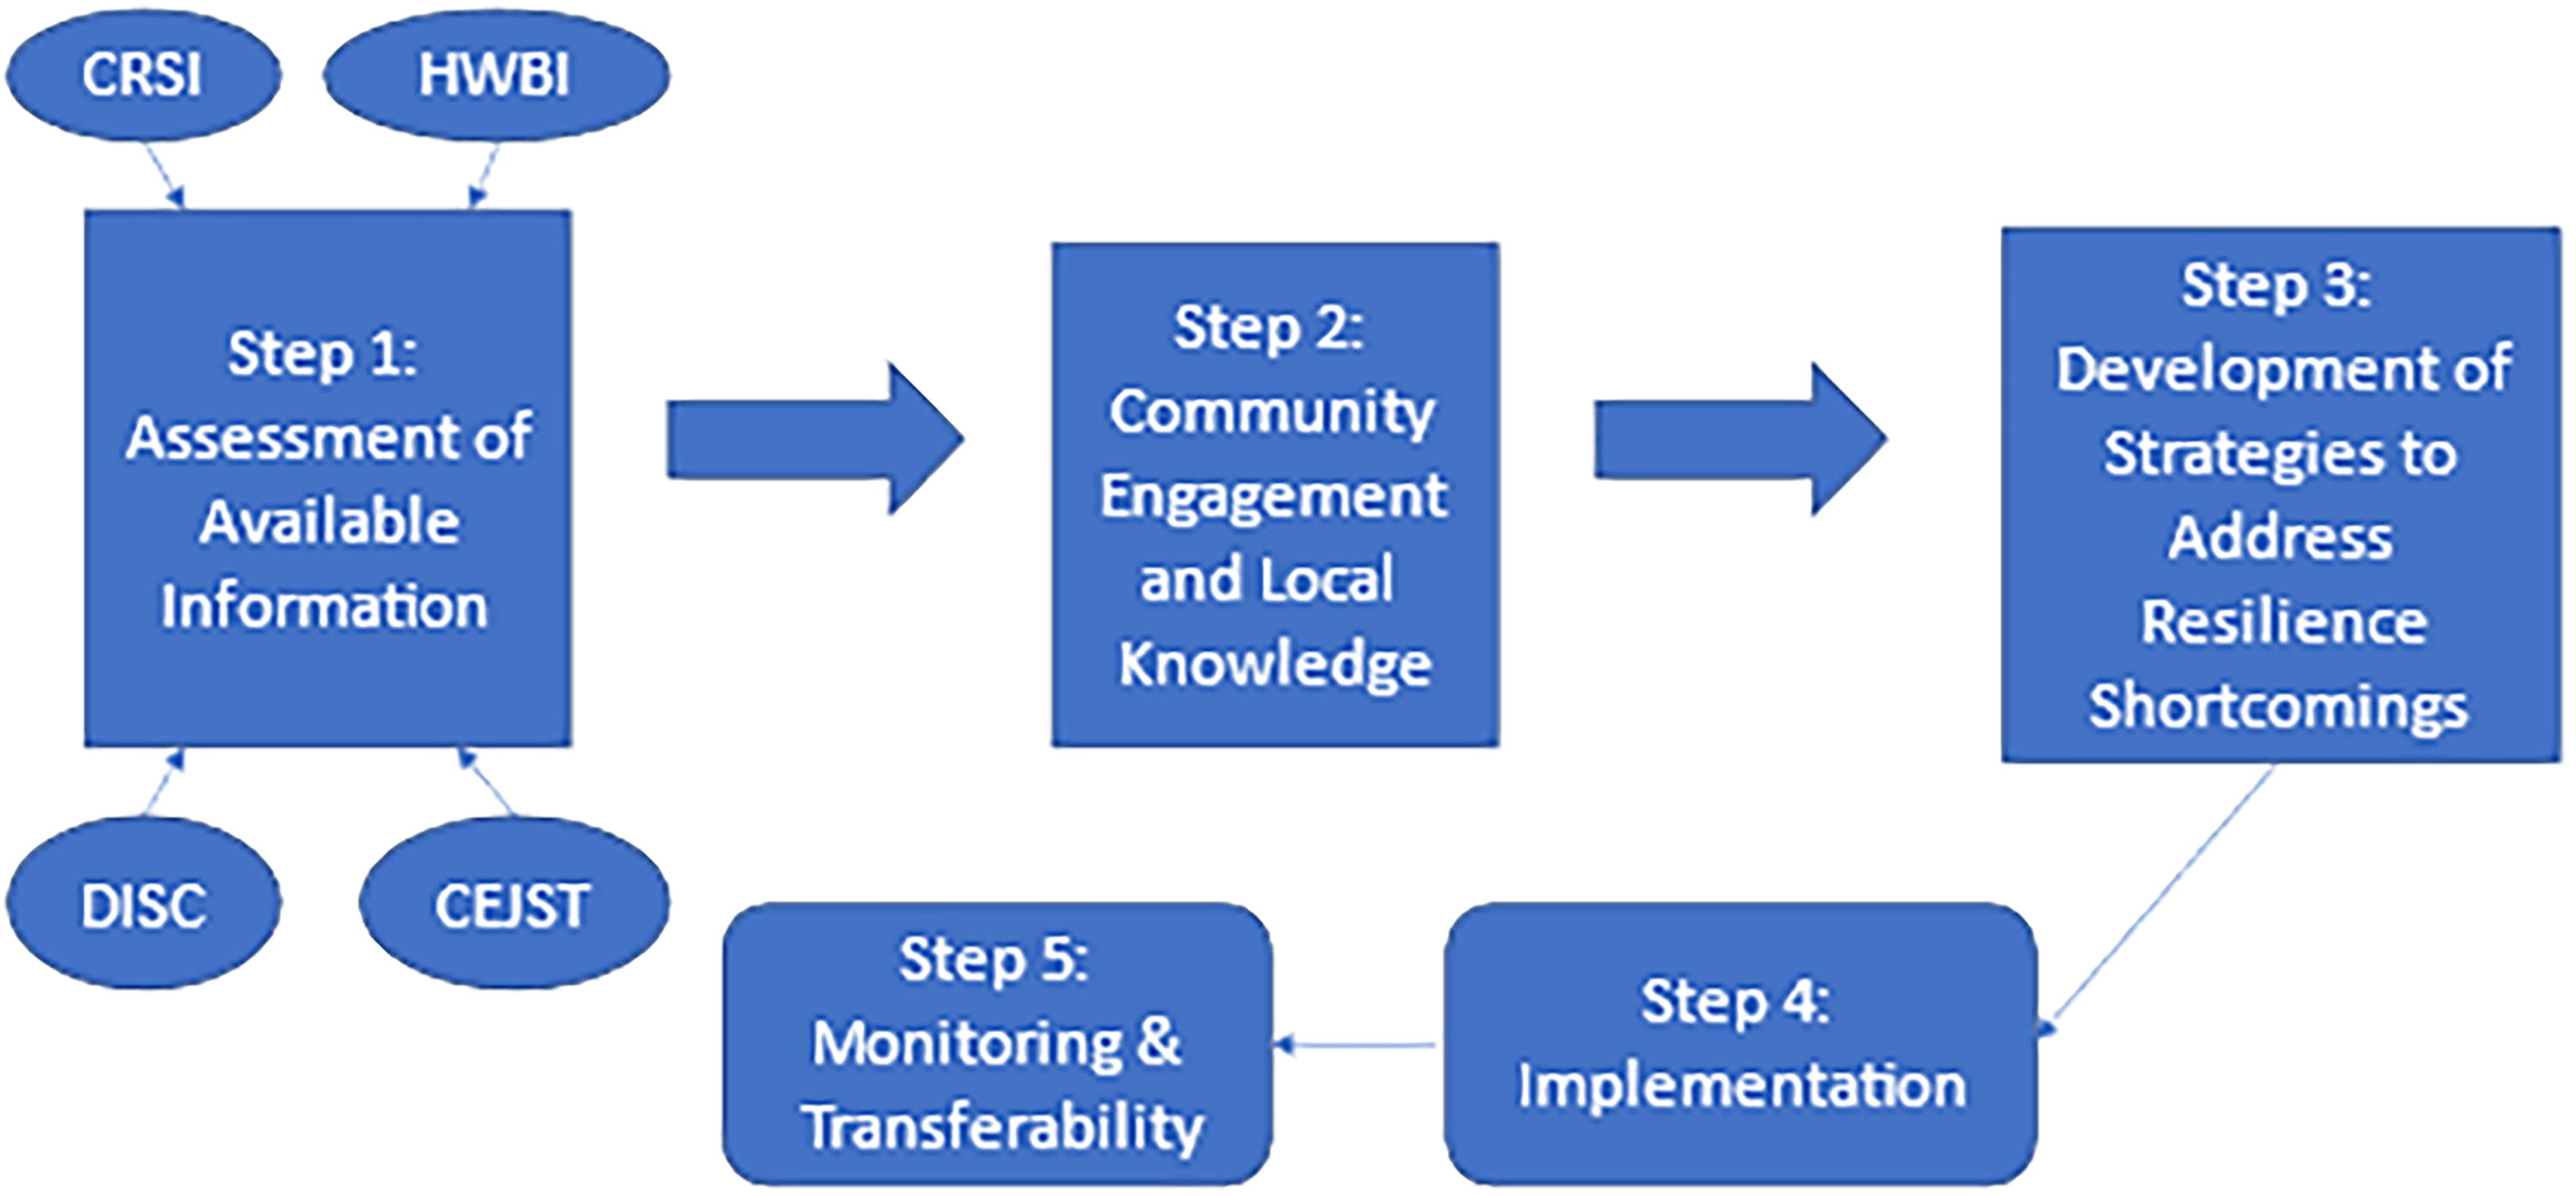
Approach for resilience capacity building.
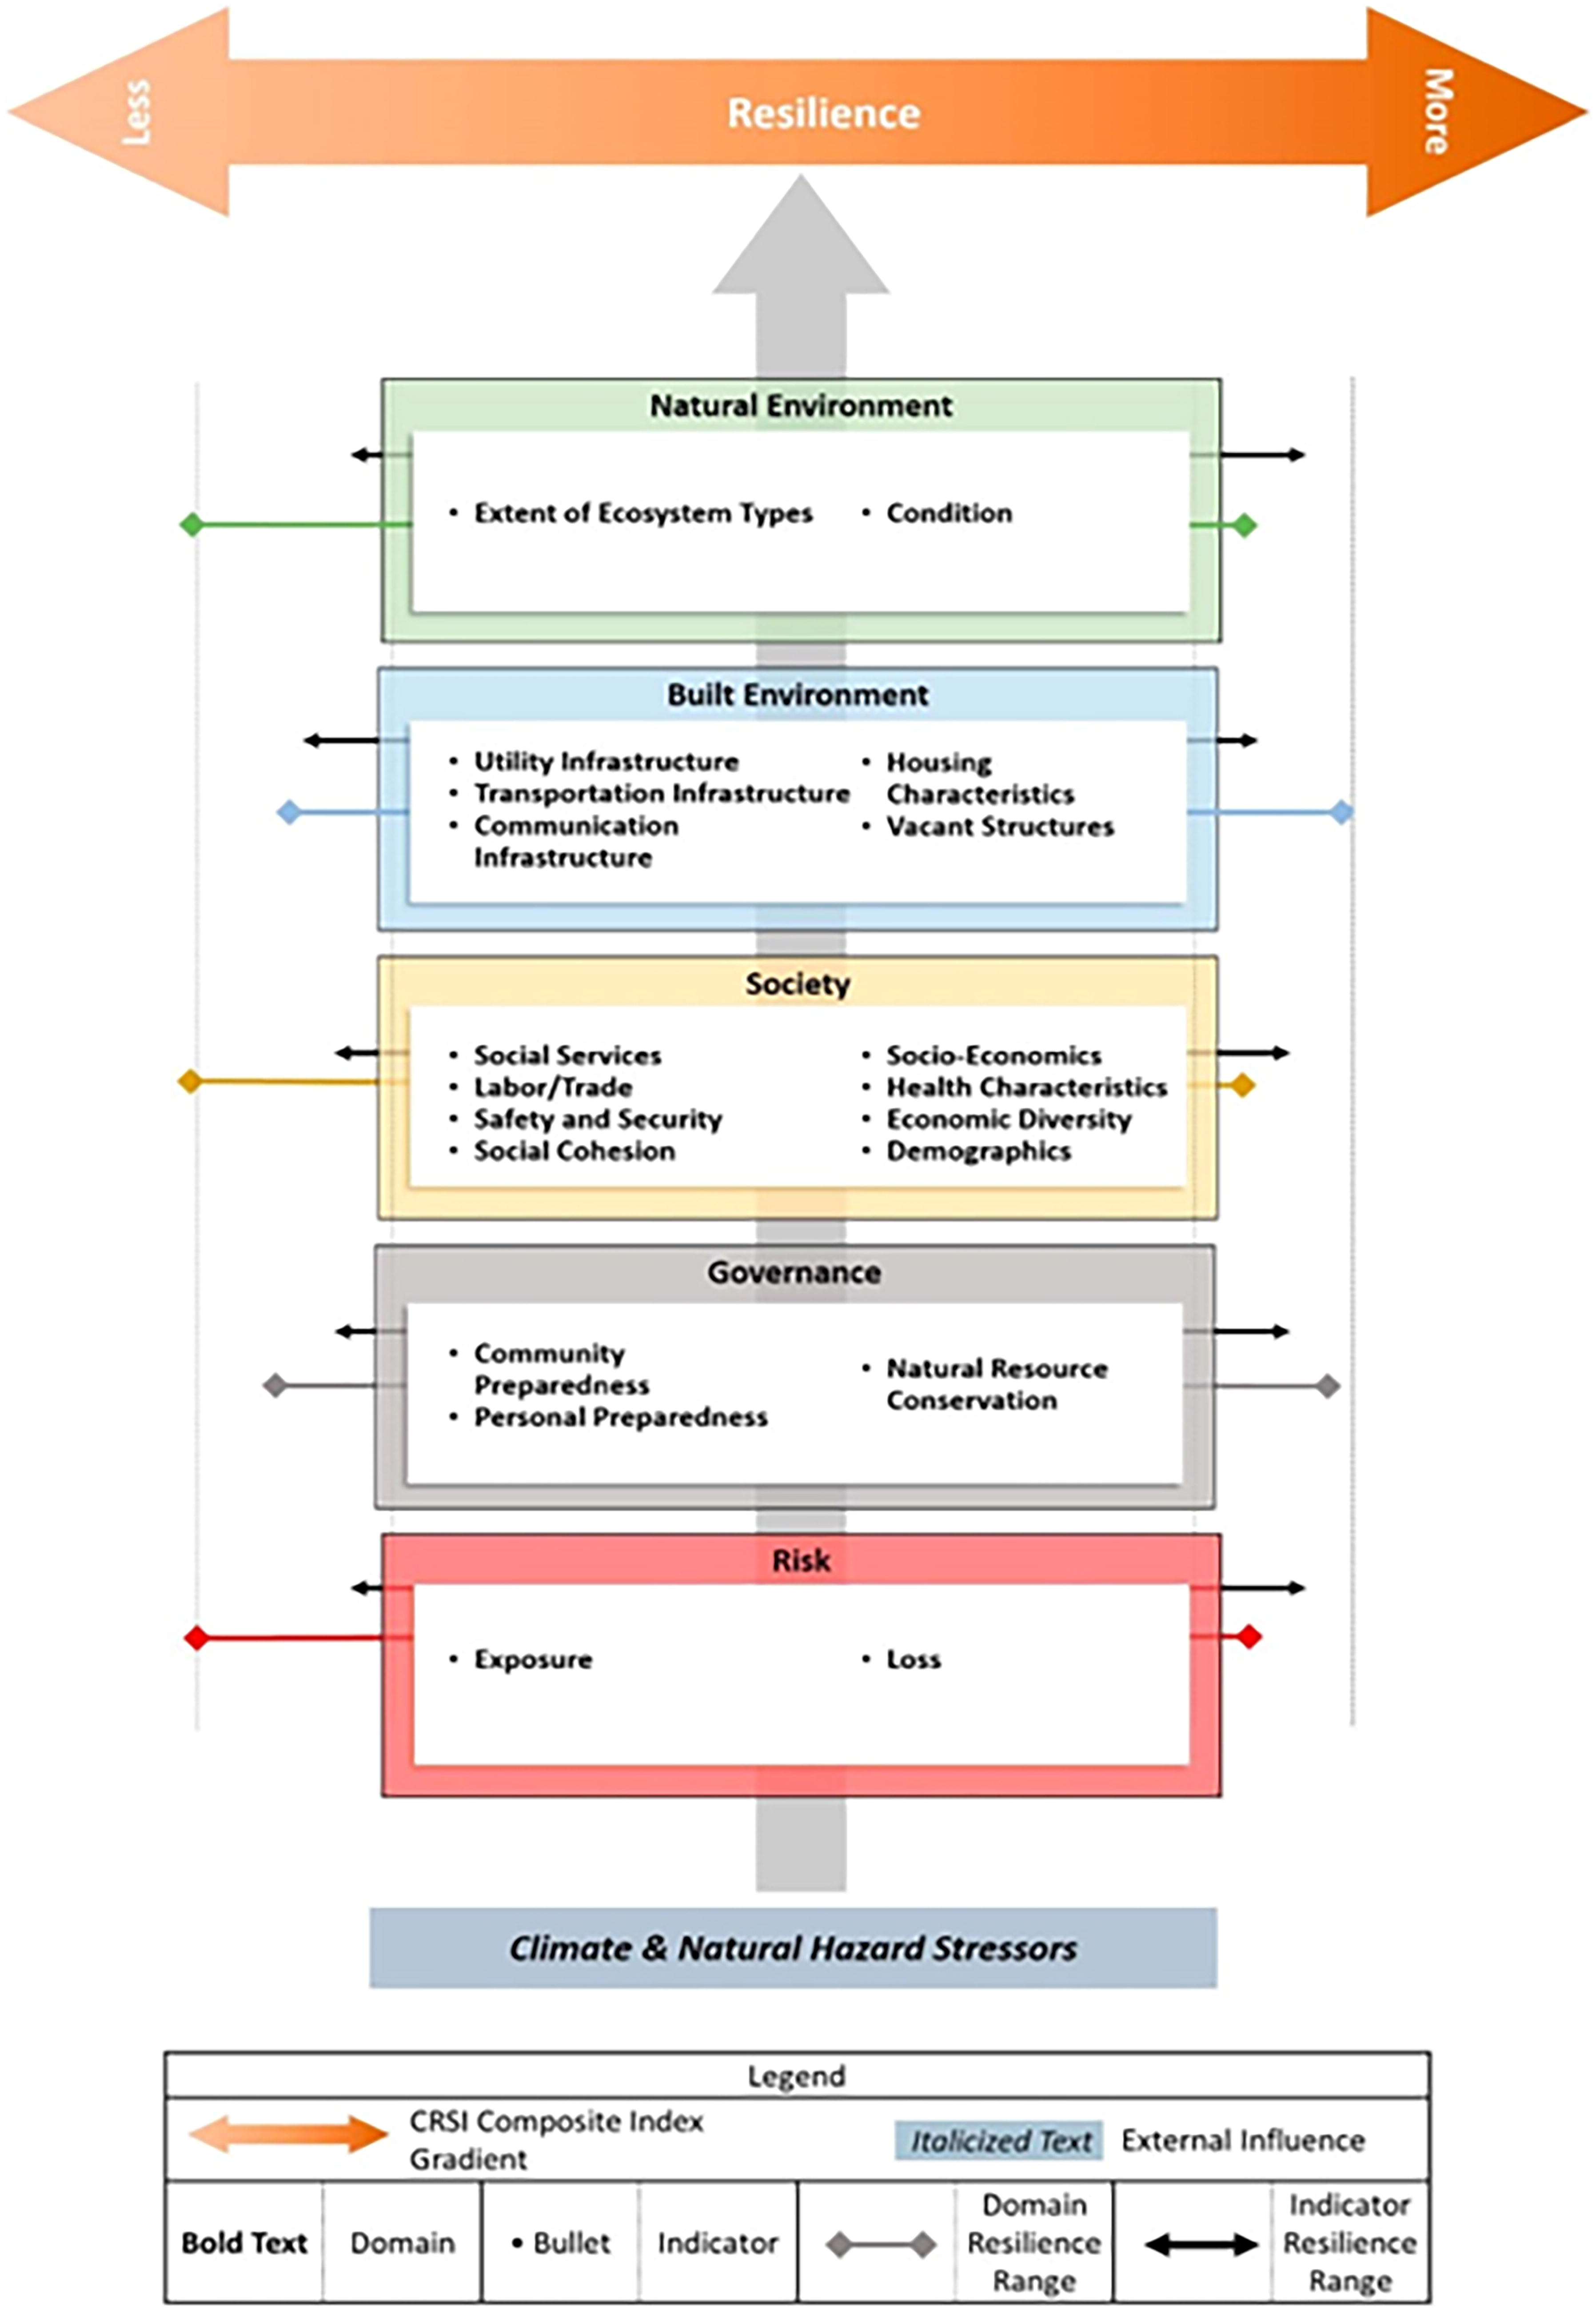
The Conceptual framework for the Climate Resilience Screening Index.
Twenty metrics contribute to the two risk indicators, and five metrics contribute to the three governance indicators. The remaining domains include elements that could exacerbate or diminish a community’s vulnerability and recovery potential. These include society, the built environment, and the natural environment. Societal indicators include social services, available labor and trade services, safety and security requirements, socioeconomics and economic diversity, health characteristics and health care access, basic demographic information, and social cohesiveness. Fifty metrics are utilized to describe these societal indicators. Built environment indicators include several infrastructure elements—communications, utilities, and transportation—and housing characteristics. Twenty-four metrics are compiled to represent the built environment. The natural environment domain describes the resilience of natural and managed ecosystems through indicators of ecosystem extent and condition. Eighteen metrics are used to represent the indicators within the natural environment domain. CRSI scores range from −10 to 1000, although most (98% of counties) range from 0 to 25.
U.S. Environmental Protection Agency researchers developed an integrated approach to characterizing human well-being: the Human Well Being Index (HWBI). 34 HWBI uses a suite of measures to assess the influence of environmental, social, economic, and service flows on the eight domains of human well-being in a holistic fashion (Fig. 3). The conceptualization depicts the relationships among natural and built capital, goods, and services, the domains of well-being and their sub-elements, and the value system of the entity being examined (i.e., relative importance values with specific communities). The mathematical structure of HWBI is fully described in Summers et al. 35 The index utilizes eight domains, 25 indicators, and 80 metrics with data expressed at the county level. Theoretically, county scores for HWBI range from 0 to 100, but most counties range from 25 to 55.
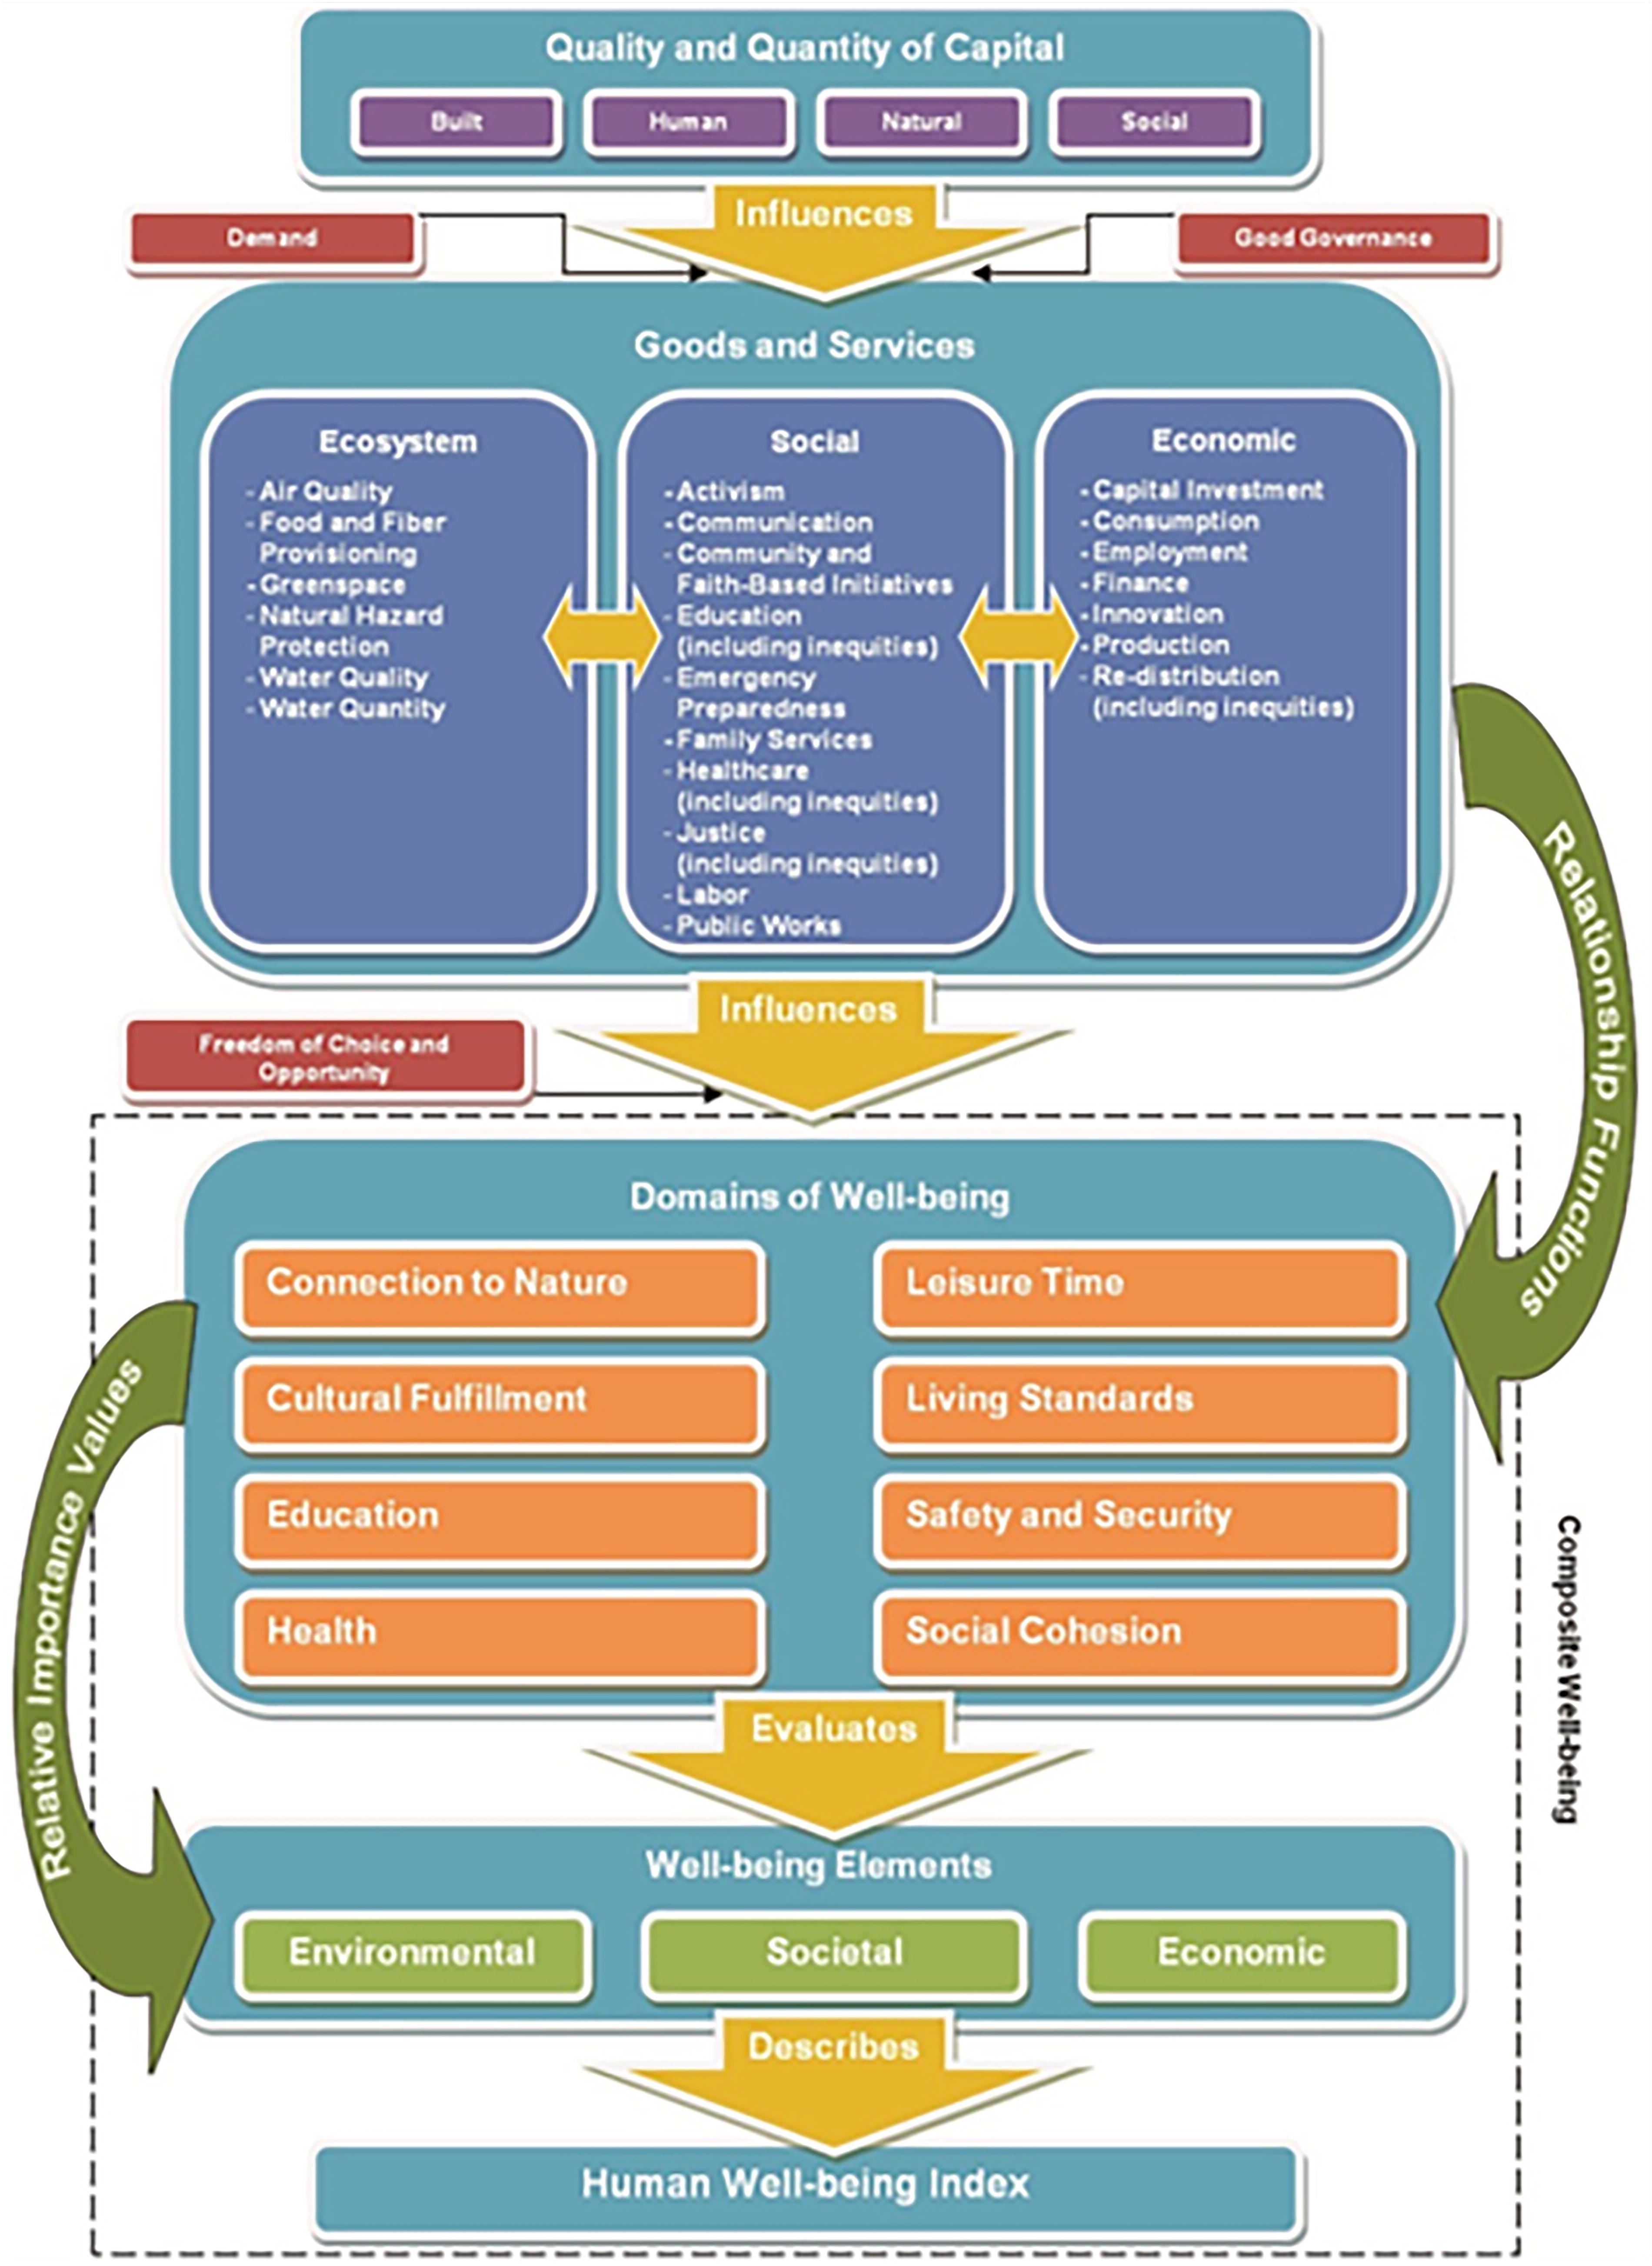
Overview of the conceptualization of the Human Well-Being Index (HWBI).
Environmental Justice Screening Tool (EJScreen) examines environmental justice mapping and provides an approach for combining demographic socioeconomic and environmental indicators that is nationally consistent. 36 EJScreen users can select a geographic area; the tool then provides demographic, socioeconomic, and environmental information. All the EJScreen indicators are publicly available data. EJScreen displays this information and combines environmental and demographic indicators into EJ indices. EJScreen includes 12 environmental indicators, seven socioeconomic indicators, 12 environmental justice indices, and 12 supplemental indices with data expressed at the county level. These indicators include information concerning climate change data, such as flood risk, sea level rise, and wildfire risk. The mean EJScreen score used ranges from 0 to 100.
The White House Council on Environmental Quality (CEQ) launched the beta version of Climate and Economic Justice Screening Tool (CEJST) in 2022. They requested information from Tribal Nations, State and local governments, Federal Agencies, environmental justice stakeholders, the White House Environmental Justice Advisory Council, and the public regarding its utility. CEQ launched version 1.0 of CEJST, 37 an essential step in implementing the Justice40 Initiative. 38 This action ensured that 40% of certain government programs are directed to communities overburdened by climate change, pollution, and historic underinvestment are being reached by Federal programs. 39 CEJST presents data at the census tract level. Version 1.0 of CEJST identifies 27,251 communities in the U.S. as disadvantaged or partially disadvantaged. Communities or tribal lands in a census tract meeting the threshold for at least one of CEJST’s categories of burden and corresponding economic indicators are considered disadvantaged. The CEJST score represents the proportion of census tracts in a county deemed “disadvantaged” based on the criteria.
Based on CRSI and CEJST scores (and supported by HWBI and EJScreen scores), the project leads interacted directly with the EPA Region III leads to determine the communities for potential community engagement [e.g., Community Involvement Coordinators (CICs) from EPA Region III]. The mean CRSI score for Region III counties is 2.93, and this project targeted communities/counties with scores of 1.5 or below (i.e., about 50% of the regional mean and would benefit from capacity building and climate change planning). Counties determined as having low resilience (i.e., CRSI <1.5) were assessed through CEJST about the proportion of census tracts in the country that were considered “disadvantaged”. Counties with about 50% or more of their census tracts were assessed as “disadvantaged” and created a pool of potential county/community combinations for the project. The project selected two eastern and two western communities (one primary and one alternate community in each area) that met these requirements and were listed on the Region 3 Priority Engagement Communities list. Eastern communities included the states of Delaware, Maryland, Eastern Virginia, and eastern Pennsylvania as well as the District of Columbia. Western communities were selected from western Pennsylvania, western Virginia, and West Virginia. Larger urban communities were gauged at having populations greater than 500,000, smaller urban communities as having populations between 50,000 and 500,000, and rural communities as having population less than 50,000. The population sizes of the specific communities would be smaller but they are encompassed in major or minor urban environments or rural settings.
The final selections of communities/counties were based on personal interaction with EPA Region III Community Coordination staff. Community Coordination staff and Administrative Personnel wanted the project to avoid communities with numerous EPA Regional infrastructure projects “on their plate” (e.g., building a wastewater treatment facility). In addition, the Region III administration wanted the resilience project to include approximately twenty communities already selected by the Region to be “disadvantaged” based on socioeconomic factors and the community’s willingness to participate in Regional programs. The compromise was that the assessment based on data collected from the indices would create a candidate list of counties/communities, cross-walked with the Region III list, and, where possible, counties/communities appearing in both venues would be selected.
The CRSI scores for the final four communities, characterized by inequities, low resilience, and low well-being, were deconstructed to determine the primary indicators and metrics contributing to those assessments. These contributions were tabularly tallied and visually depicted using polar plots. 40
RESULTS
While four indices were used to assess the Region III counties, only CRSI and CEJST scores were used to determine candidate counties with HWBI and EJScreen scores used to confirm the selections. The results of the indices for CRSI and CEJST applied to the Mid-Atlantic states CRPC are shown graphically in Figure 4. For CRSI, the figure provides the counties with scores below the mean index score for the region (2.93) or counties containing a community from Region III’s Priority Engagement Communities Program. For CEJST, Figure 4 provides the percentage of census tracts in those counties determined to be underserved and having high levels of social and climate injustice. A significant number of counties in Region III were below the mean CRSI scores for the combined counties of the United States (4.321) and the combined counties in Region III (2.934). Many counties and cities displayed extremely poor resilience (<1.00) – particularly in Virginia and West Virginia. Many counties in the region displayed very poor resilience (1.00<x<1.50). Similarly, many counties showed poor resilience (1.50<x<2.00).
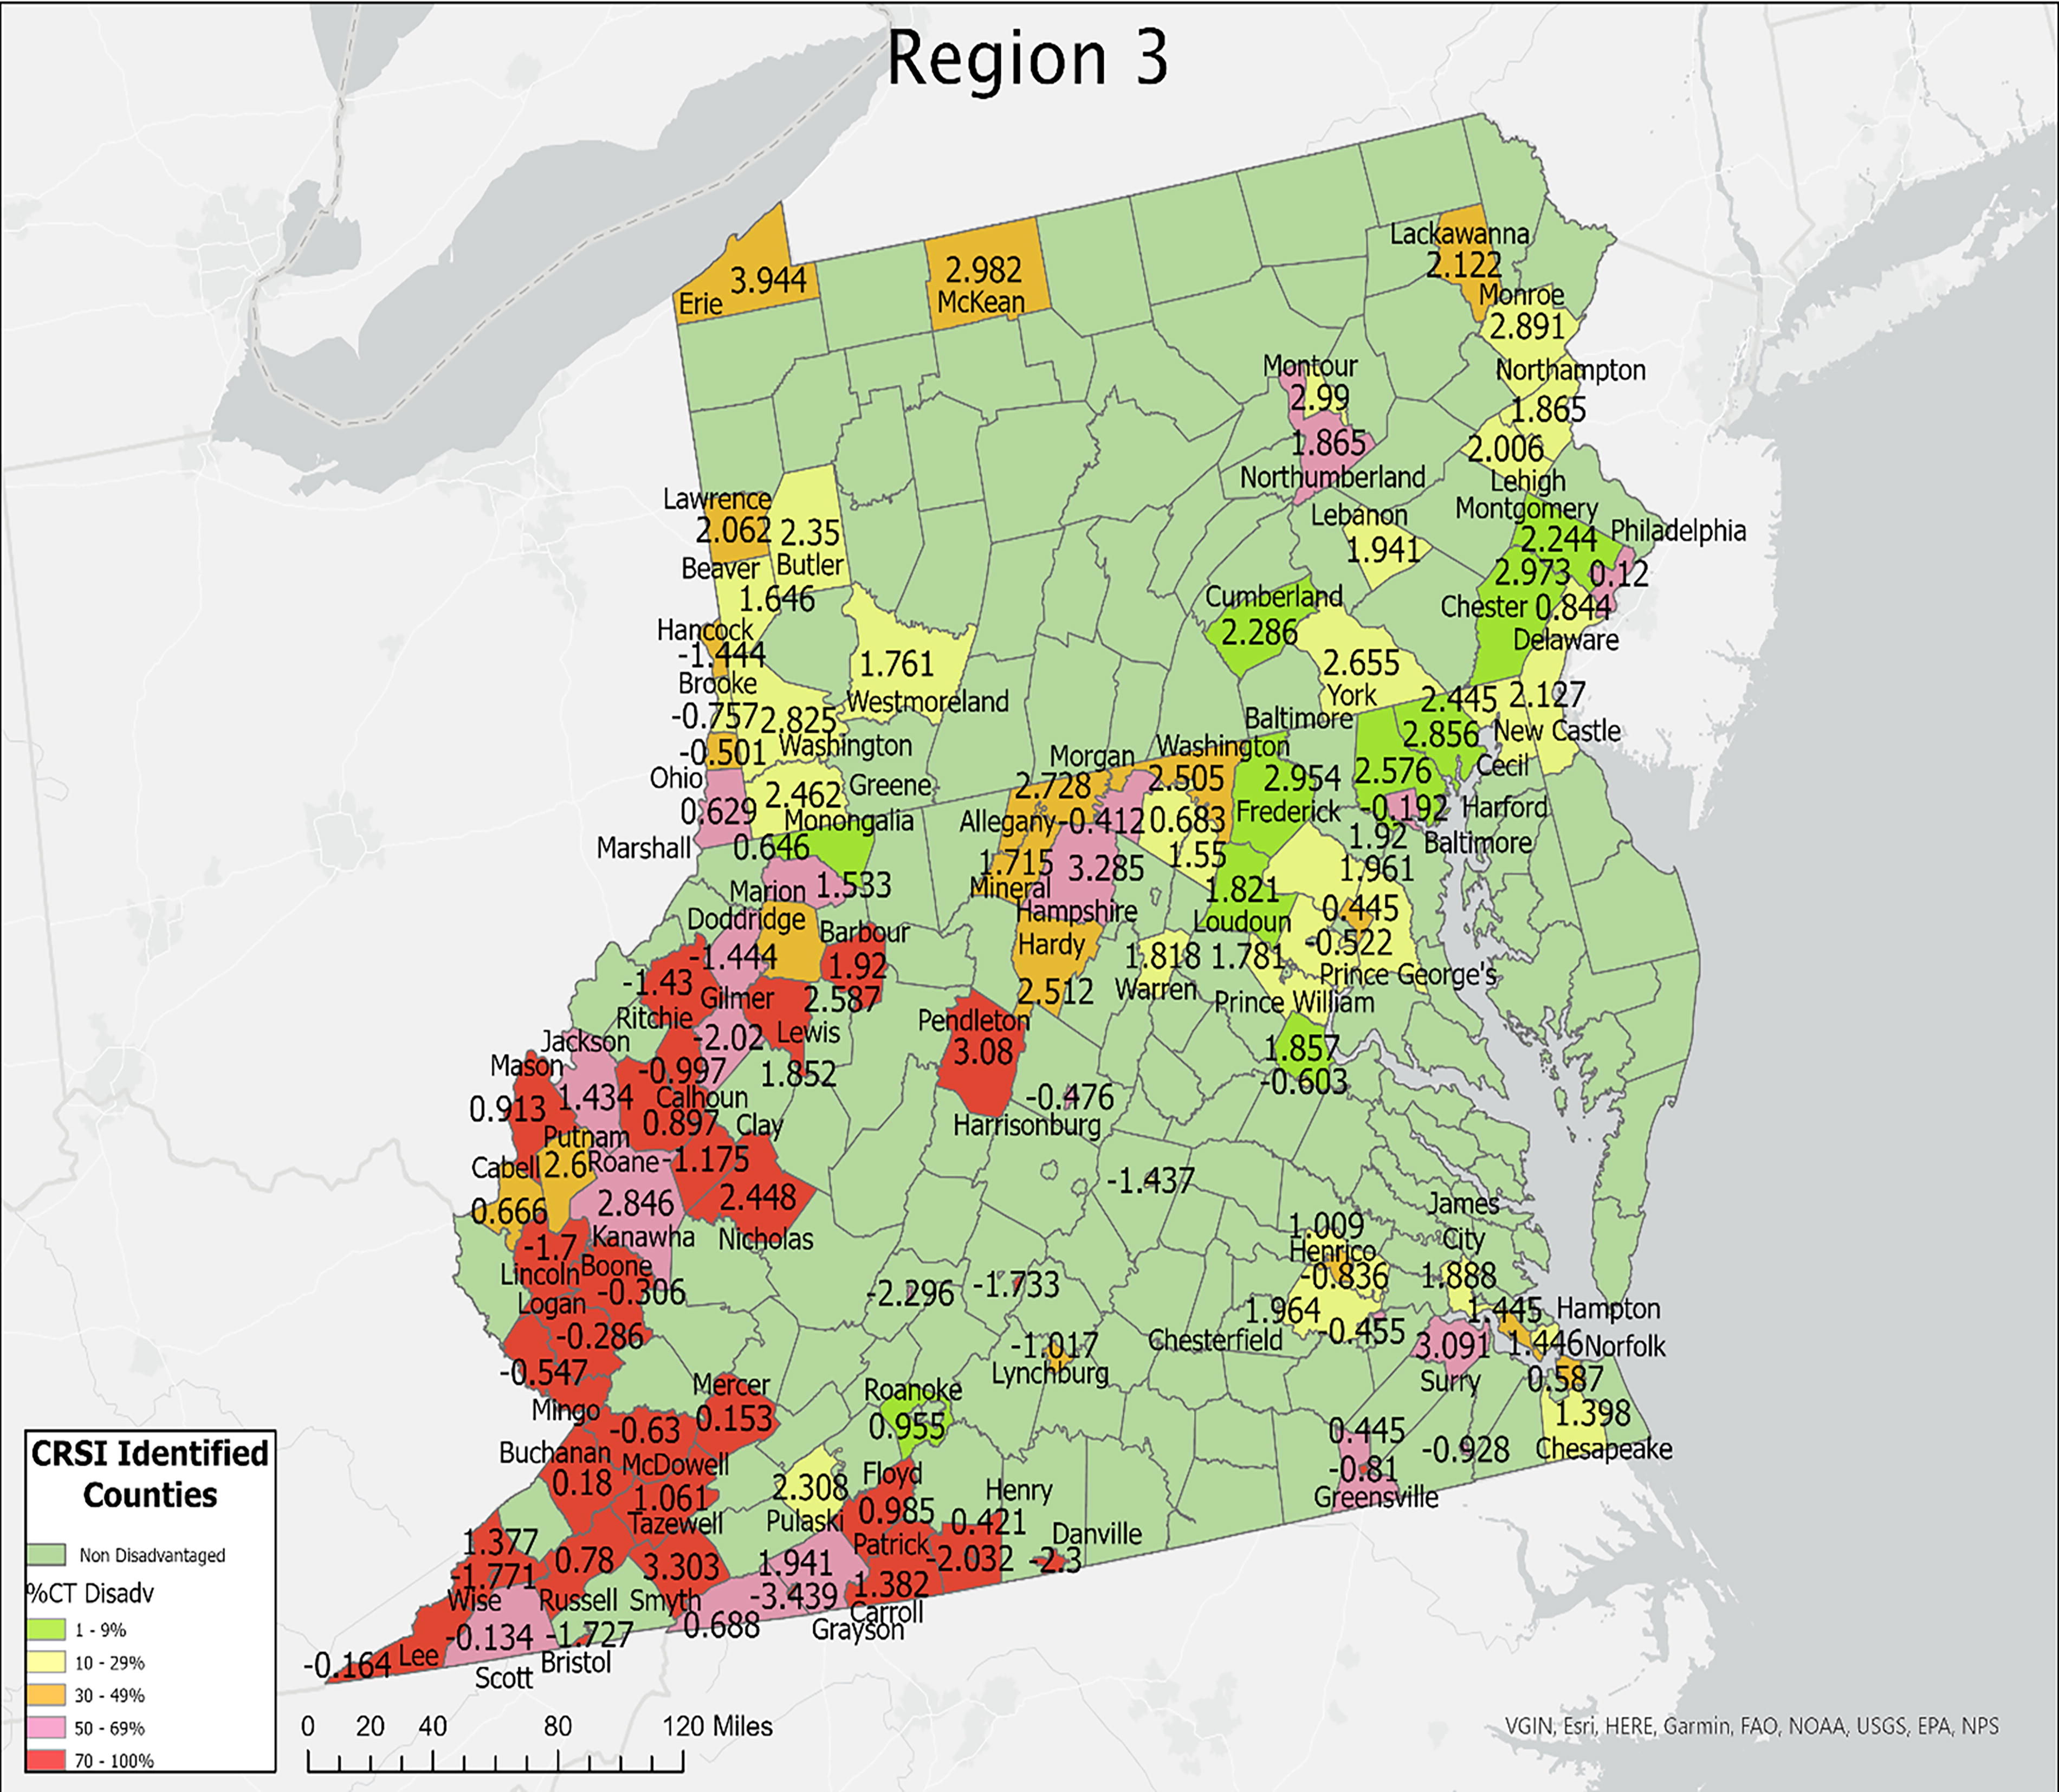
Mid-Atlantic Region showing Counties with CRSI scores less than the mean for the Region and the proportion of census tracts representing under-served communities vulnerable to climate and social issues.
CEJST scores in counties/cities with low CRSI scores showed greater than 70% of the census tracts in many counties throughout West Virginia and in southwestern Virginia showed high climate and economic inequity levels. These areas and some areas in southeastern Virginia, western Maryland, Baltimore, and Philadelphia, showed only 50–70% of its census tracts with this level of inequity. Many counties in West Virginia showed that 100% of their census tracts were listed as disadvantaged by CEJST, exposed to toxic substances, experienced high climate justice inequity, and had poor socioeconomic conditions.
Based on the scores shown in Figure 4, four communities (two eastern and two western with a combination of major urban, smaller urban, and rural county/community combinations) were selected for further assessment as requiring significant resilience capacity building—Elmwood, Philadelphia County, PA; Brentwood, District of Columbia; Keystone, McDowell County, WV; and, East Huntington, Cabell County, WV. These counties have extremely poor resilience levels (Philadelphia County—0.395, District of Columbia—0.501, McDowell County—0.548, and Cabell County—1.109) as determined by CRSI and moderate to high levels of climate and socioeconomic inequities (District of Columbia—35%; Cabell County—48%; Philadelphia County—60%; and McDowell County—100%) as determined by CEJST. However, targeting the selected communities in these counties showed higher levels of inequity (Elmwood Community—> 50% of census tracts; East Huntington—> 75%; Brentwood Community—100%; and Keystone Community—100%). The CRSI, HWBI, CEJST, and EJScreen scores for the four candidate communities are shown in Table 1. Based on these combined scorings, Elmwood, Philadelphia County, PA, and Keystone, McDowell County, WV, were initially selected as primary communities in the east and west, respectively. Brentwood, District of Columbia, and East Huntington, Cabell County, WV, were selected as alternative locations. Discussions with Region III Community Coordinators and senior management raised questions about the capacity of the Keystone Community to engage on this project given their population (<100) and the development of a large water infrastructure project targeted for the Keystone area at this time. 41 (The project team agreed and moved to the alternate location and selected East Huntington, Cabell County, WV as the western location. The risk metric scores from CRSI for the two selected counties (Philadelphia County, PA, and Cabell County, WV) are shown in Figure 5. The primary risks associated with Philadelphia County include high temperatures, inland flooding, low temperatures, and high winds The major risks associated with Cabell County are landslides, high and low temperatures, inland flooding, drought, and high winds.
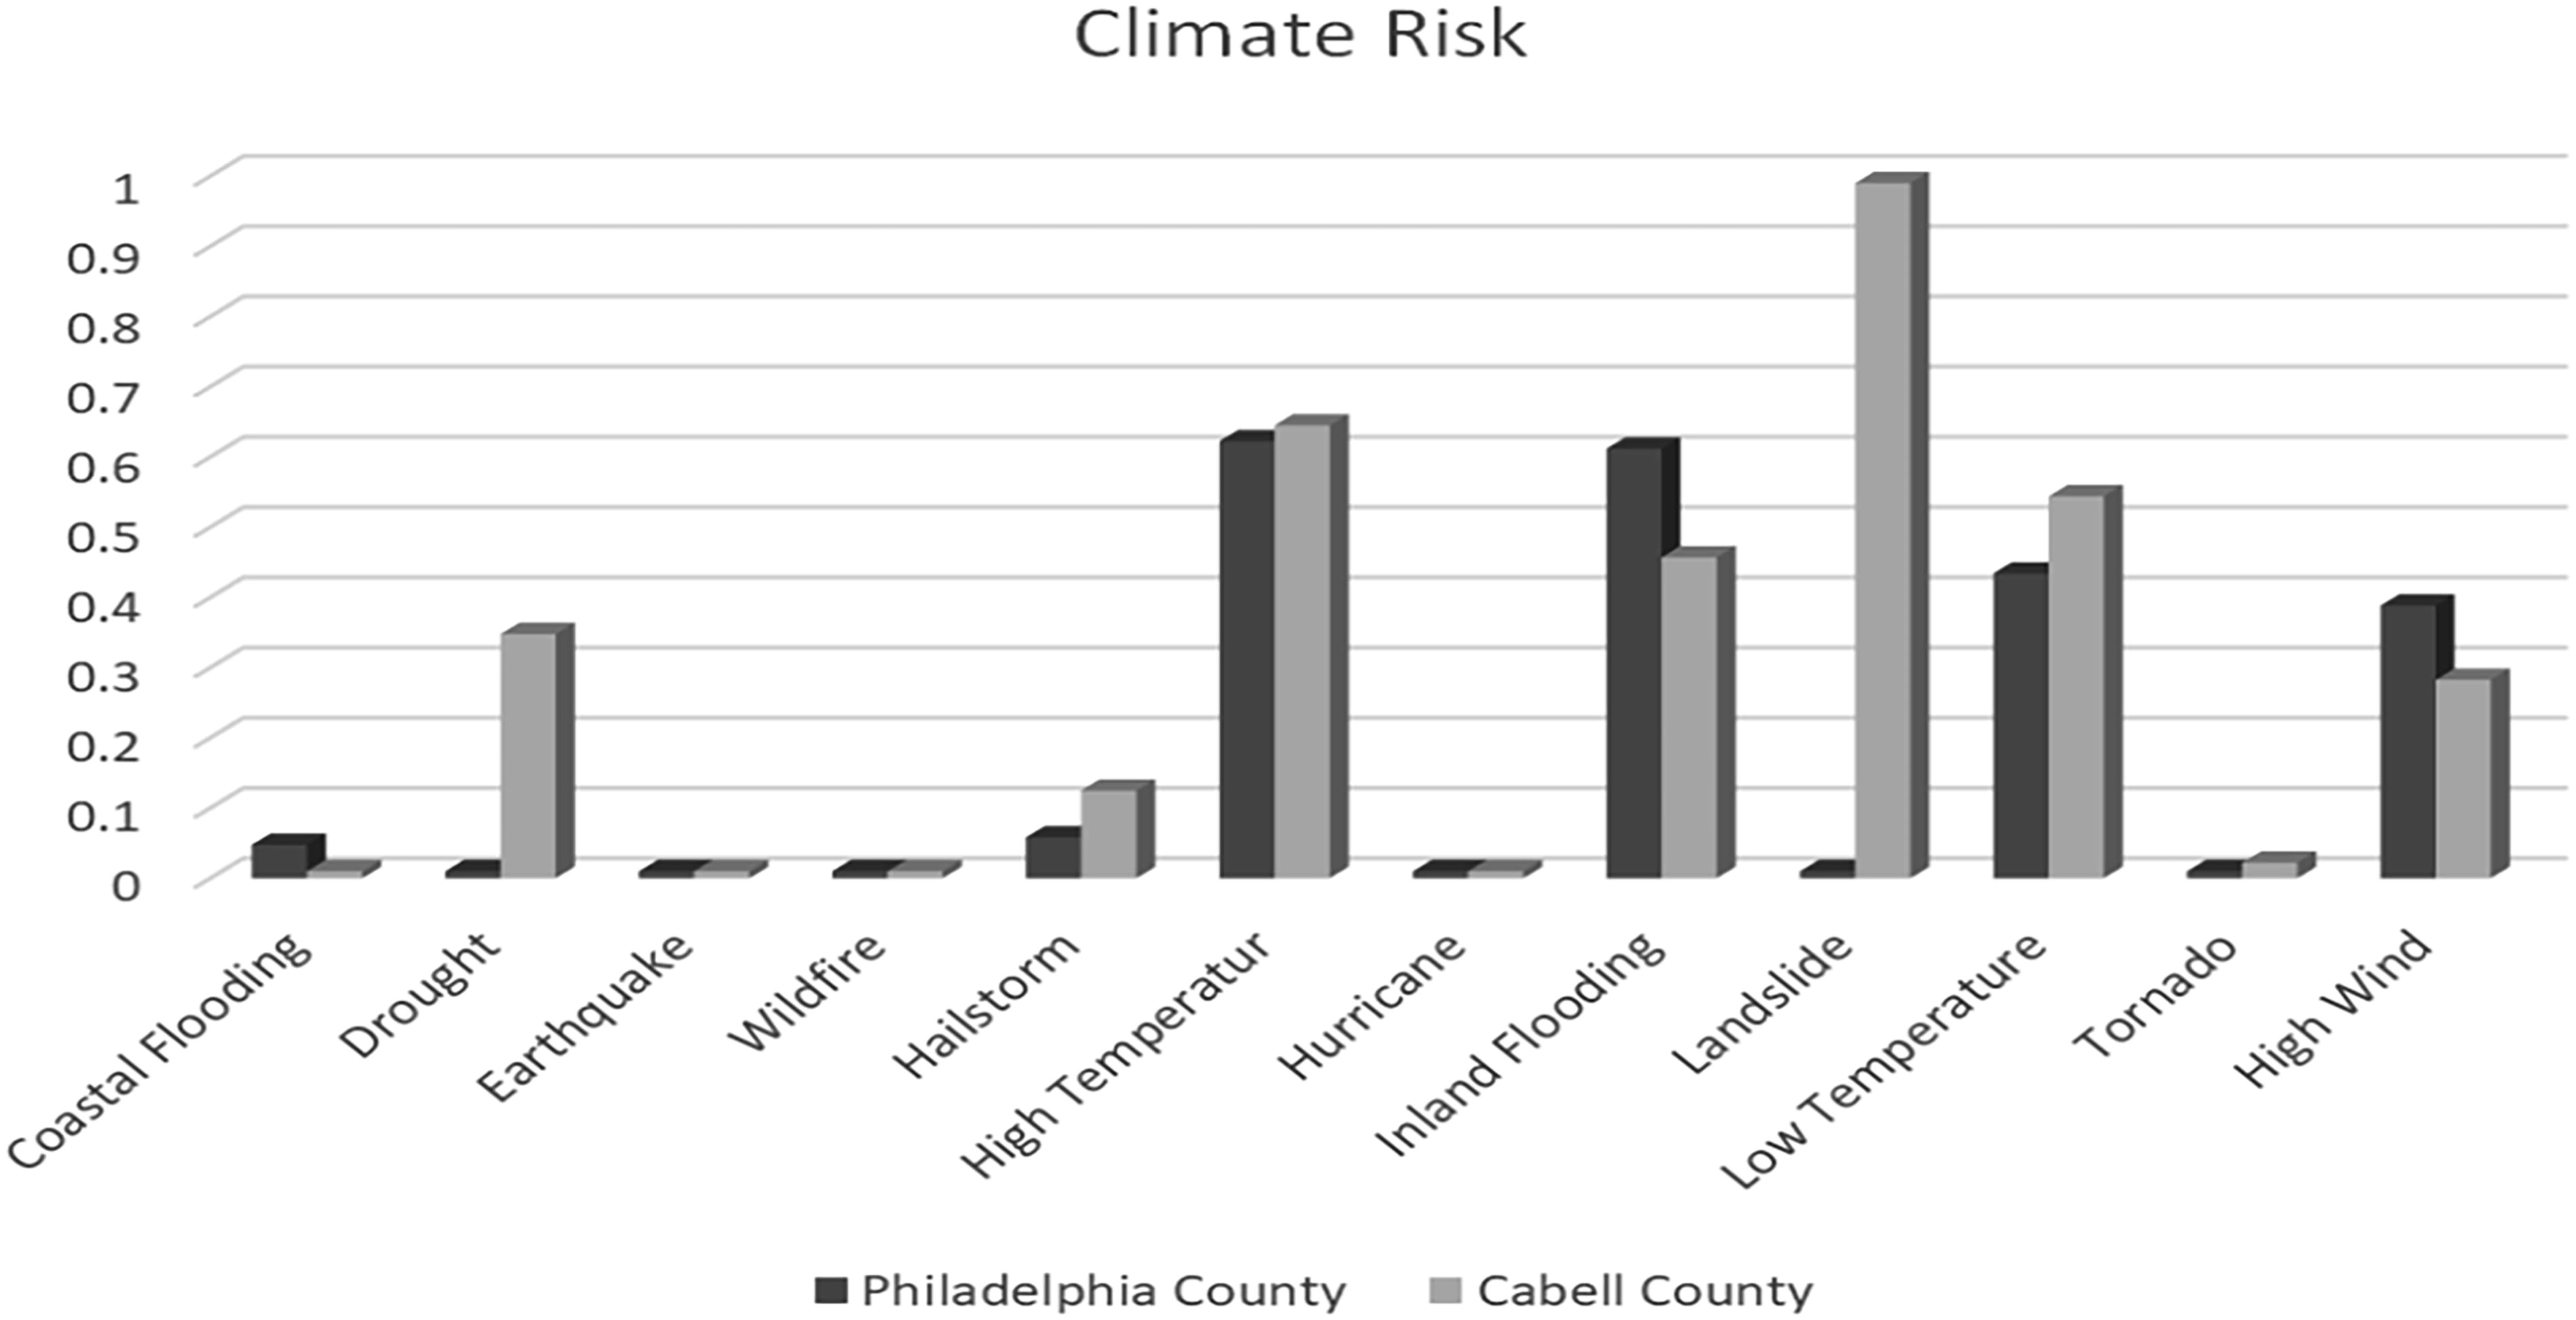
Climate-related natural hazard risks associated with Philadelphia County, PA and McDowell County, WV. Y-axis depicts proportional ranking of counties compared to the United States (i.e., 99% = among the top 1% of counties facing that indicated risk).
CRSI, HWBI, EJScreen and CEJST Scores for Candidate Counties
EJScreen score is a mean of multiple indices.
CEJST score of percentage of census tracts designated as “disadvantaged.”
CRSI scores generally range from 0 to 25; HWBI scores from 25 to 55; and EJScreen means from 0 to 100.
CRSI, the Climate Resilience Screening Index; HWBI, the Human Well-Being Index; EJScreen, the Environmental Justice Screening Tool.
Deconstruction of resilience indicators
The contributions of CRSI indicators to the five CRSI domains are shown in Figures 6 and 7 for counties that include the selected two communities. Both counties demonstrate significant contributions from several indicator areas, significantly reducing the counties’ CRSI overall scores. In Philadelphia County (Fig. 6), very low contributions from some demographic indicators, high vacant structure indicators, low utility infrastructure, and low metric scores for housing characteristics reduce Philadelphia County’s resilience score. Likewise, very low labor-trade services, safety and security indicators, and reduced social services and health characteristics represent societal indicators that impact local resilience. Low levels of ecosystem extent and condition and personal and community preparedness indicator scores further reduce the county’s resilience. In Cabell County (Fig. 7), high vacant structure indicator scores and extremely low built-environment infrastructure indicator scores (i.e., especially utility and transportation infrastructures) reduce the county’s CRSI score. These attributes, coupled with poor security and safety, labor-trade services, health characteristics, and personal/community preparedness indicators, result in a “very poor” resilience score for Cabell County.
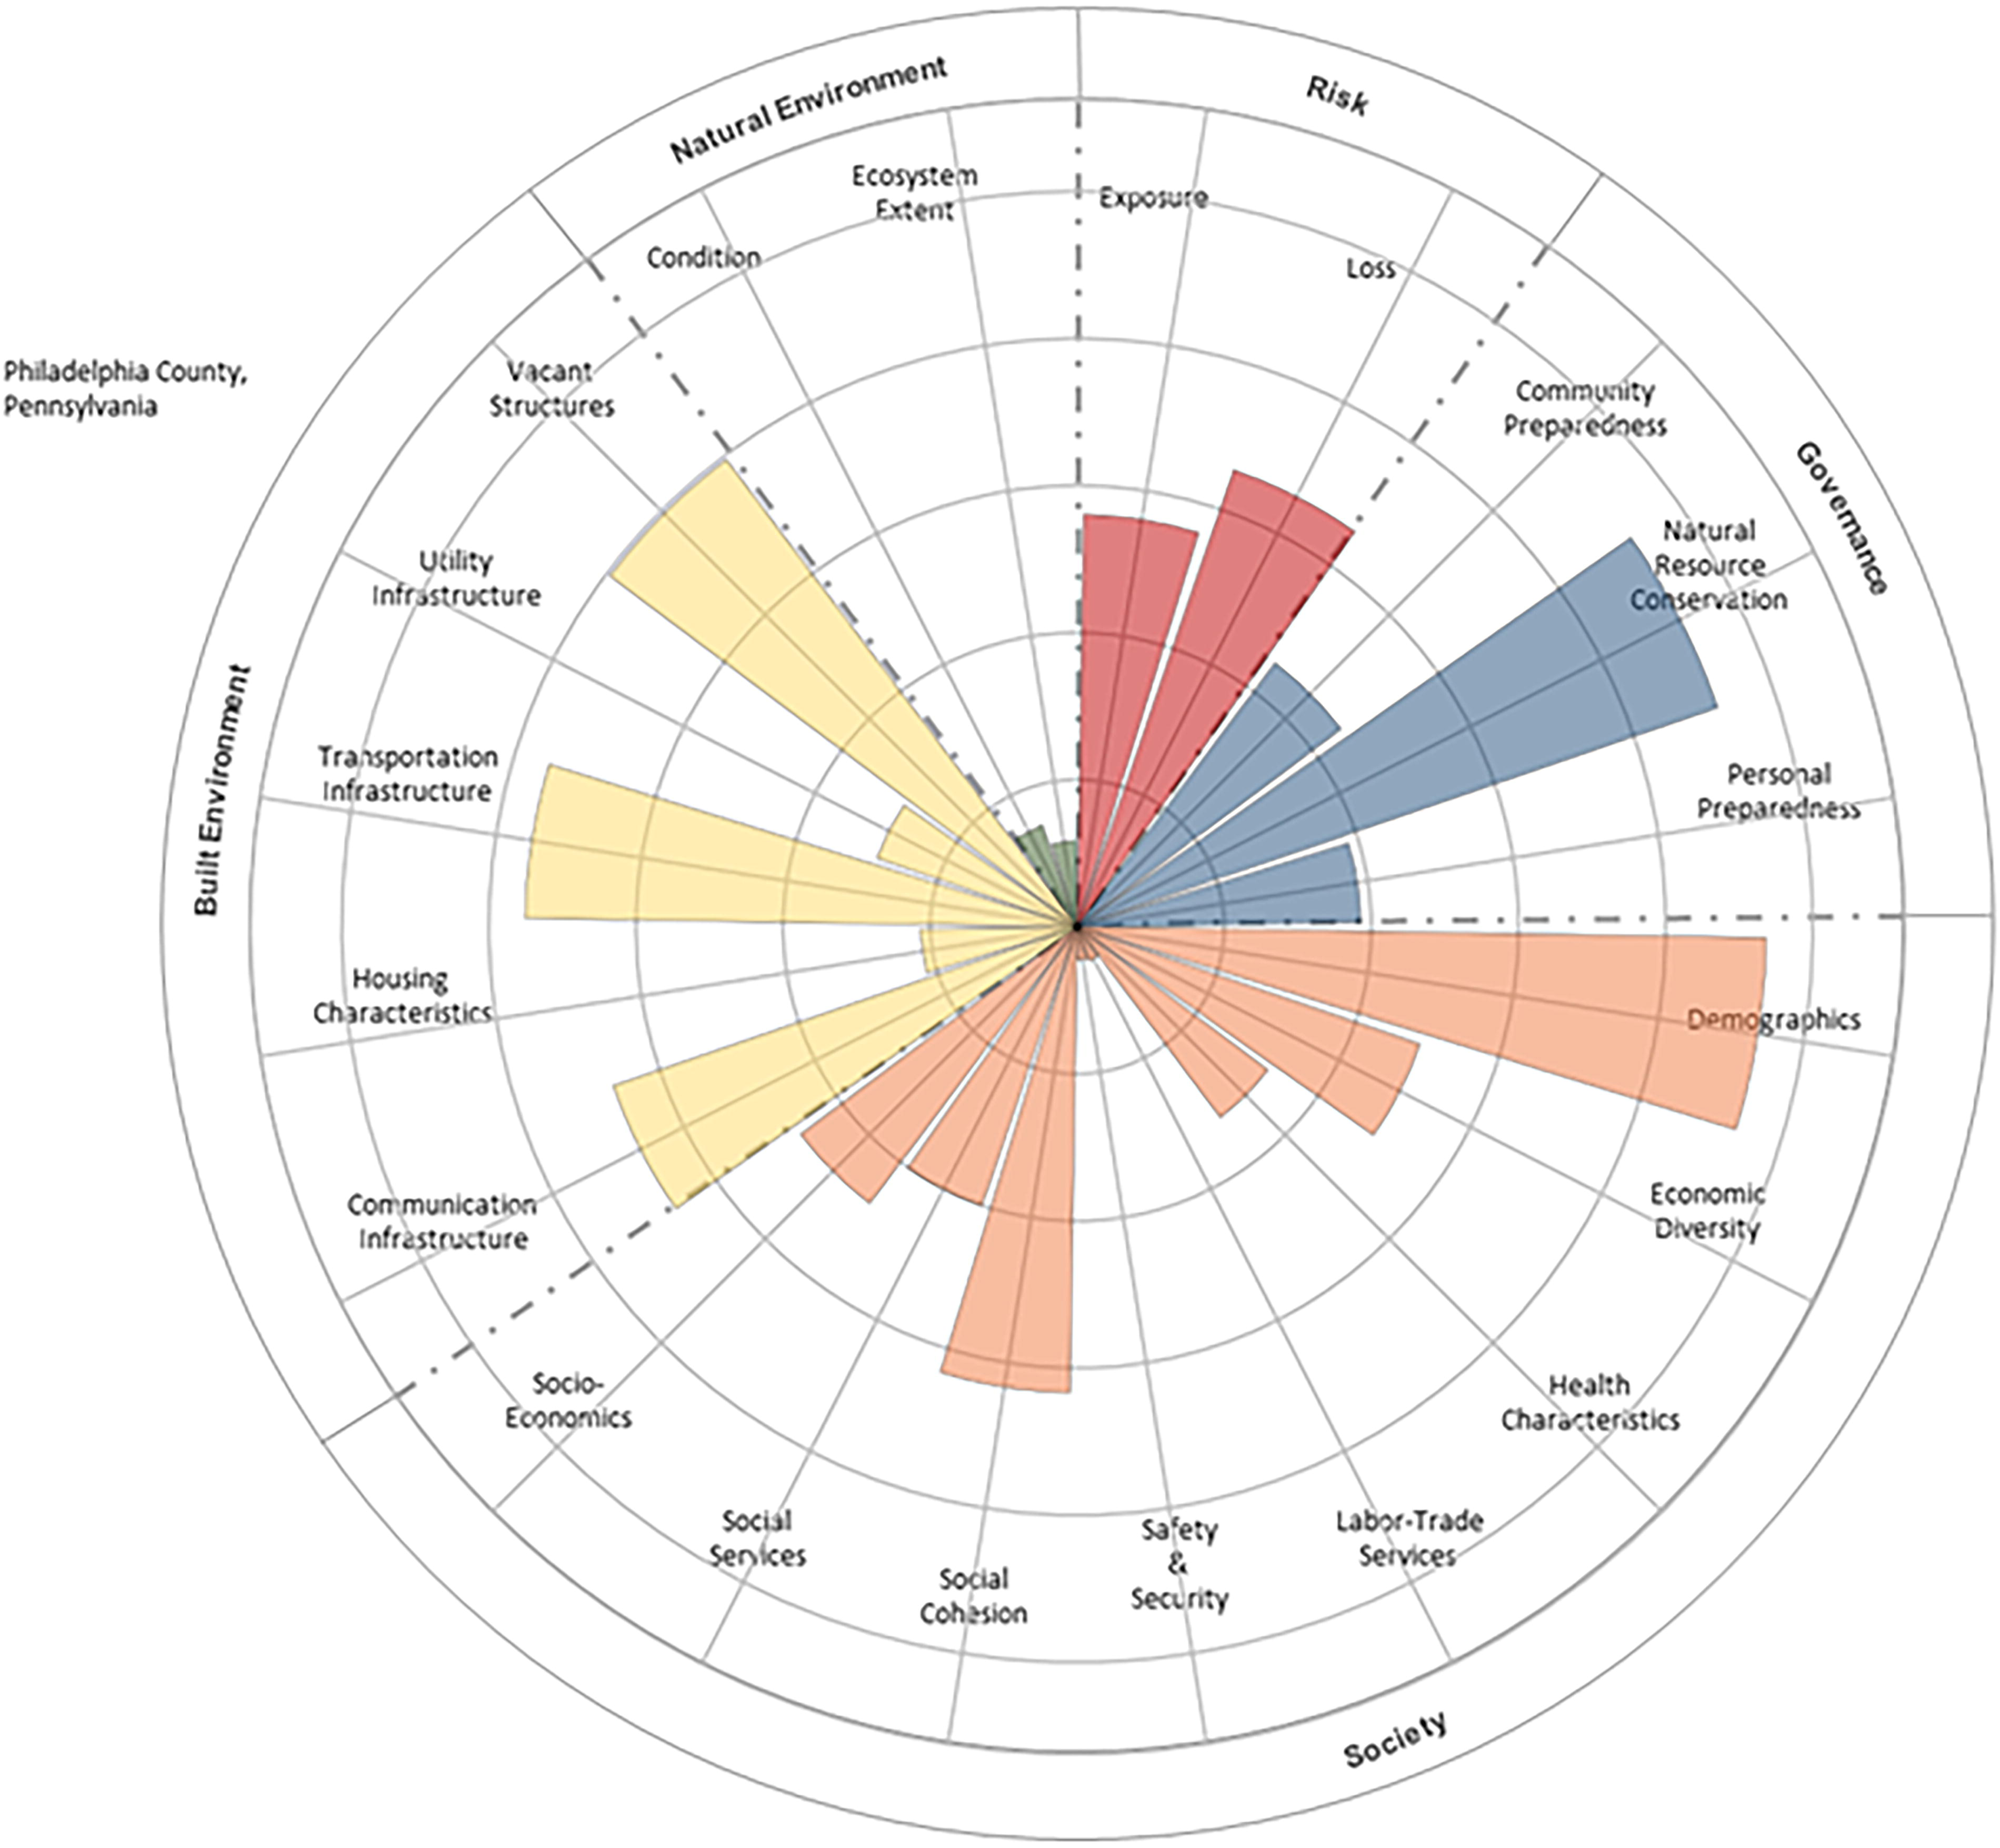
Polar plot of CRSI indicators for Philadelphia County, PA.
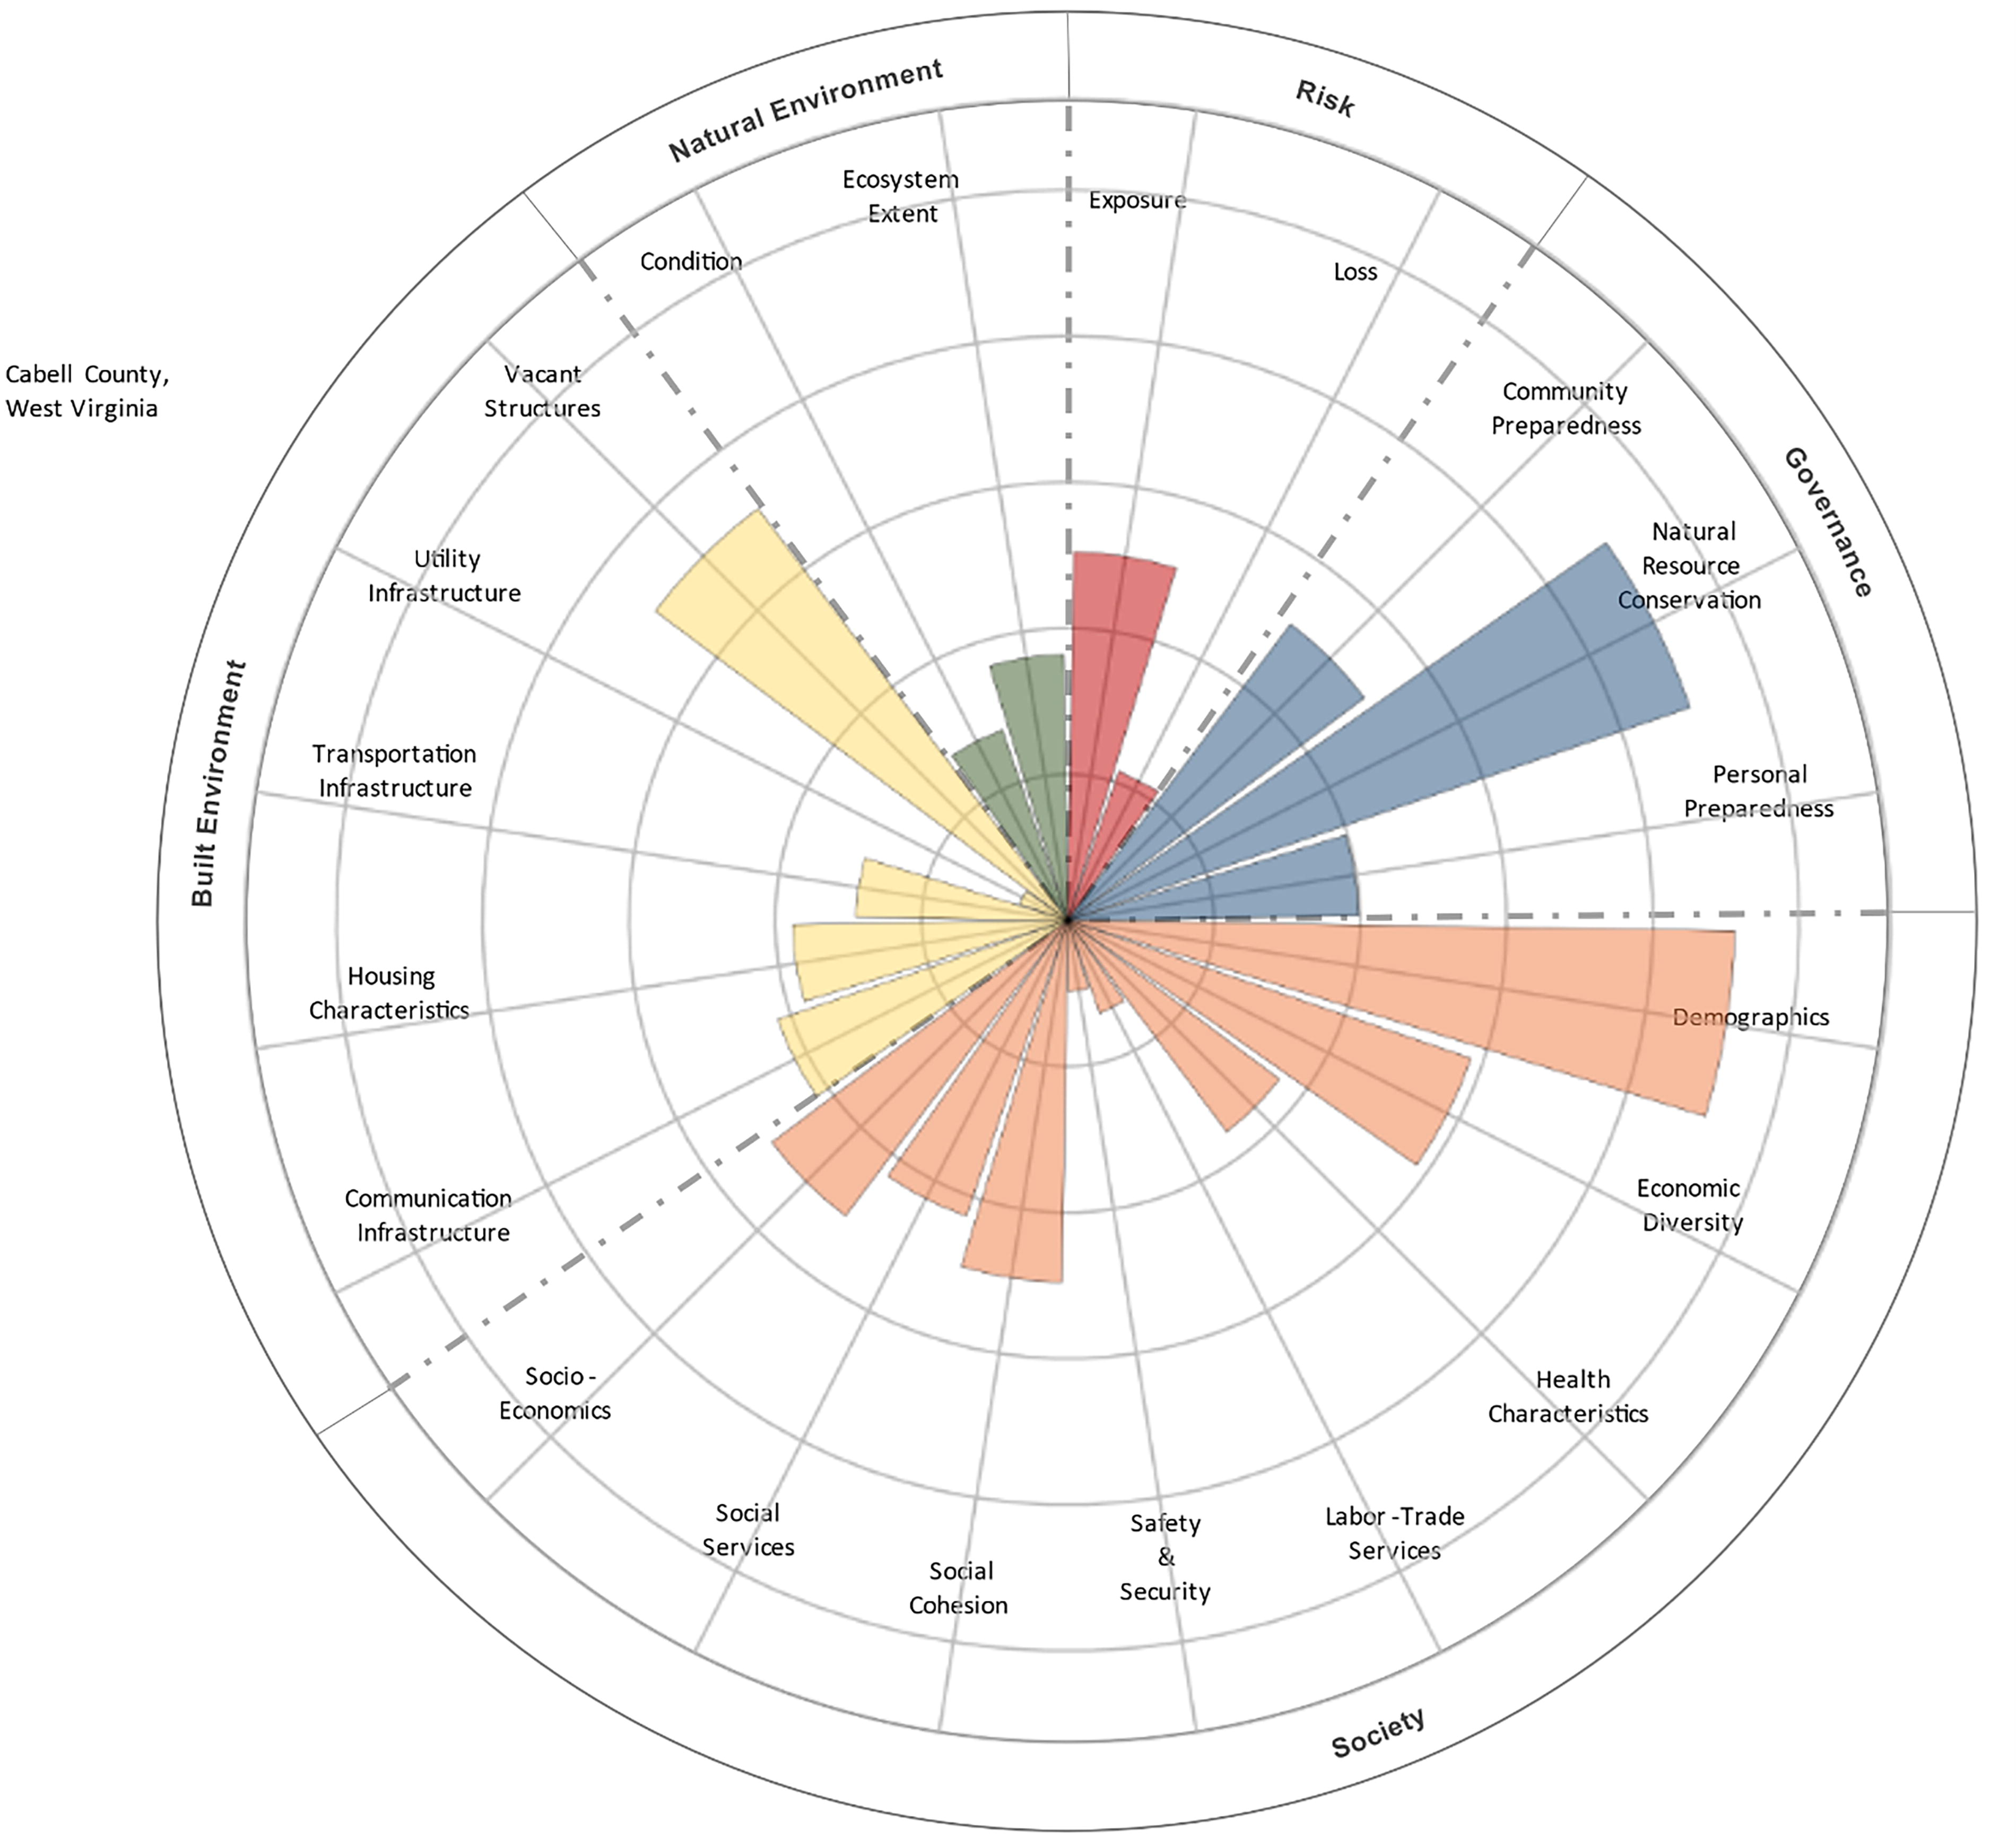
Polar plot of CRSI indicators for Cabell County, WV. CRSI, the Climate Resilience Screening Index.
Further metric deconstruction of indicator scores associated with these two counties (Table 2) showed many strongly negative contributions to each county’s low resilience score. These negative contributions potentially provide significant opportunities for resilience capacity building at the county and community levels. Both counties have several poor resilience metrics in common. For example, all generally have low levels of utilities infrastructure, while some also show lower levels of communications and transportation infrastructure. Large numbers of vacant structures and some poor housing characteristics characterize both counties. Both show a general lack of re-investment of Small Business Administration funding in mitigation activities. Generally, few households participate in the National Flood Insurance Program despite the potential risks of high flooding. The counties show mixed conditions associated with protecting natural lands and biodiversity and losses of agricultural and natural lands to impervious surfaces. Both counties display lower labor-trade services, particularly framing and water and sewer construction. Both counties show lower levels in several social services, especially blood availability. In contrast, Philadelphia County shows low numbers of food services for the needy and surgical services, and Cabell County shows low numbers of basic school facilities.
Select Deconstructed Metrics Important to the Very Low Resilience Scores for Philadelphia and McDowell Counties
Value shown in terms of percentage of counties in the United States with similar metric scores.
*SBA, the Small Business Administration;**NFIP, the National Flood Insurance Program.
Both counties appear to have some demographic and health characteristics in common. Both have high proportions of the population with limited English skills, high numbers without high school diplomas, and large numbers over 25 years of age with less than a 9th-grade education. Both counties appear to have higher proportions of their population who are elderly, as well as a large proportion of the population aged less than five years. Large numbers of people with asthma and diabetes populate both counties. Large numbers of special needs persons who cannot easily evacuate during natural hazard events populate Philadelphia County and, to a lesser degree, Cabell County. Both counties have high levels of deep poverty and high levels of economic inequity. All of these attributes can either make a community more vulnerable (poor health, lower levels of education, higher proportions of young and elderly) or less likely to be resilient (poverty, economic inequity).
DISCUSSION
The CSRI and CEJST results for the two selected counties/communities (Elmwood and East Huntington) within EPA Region III jurisdiction showed a distinct tendency toward disadvantaged communities with poor resilience. This poor resilience is driven by underdeveloped infrastructures, poor local preparedness, poor housing characteristics, poor economic conditions, and skewed demographics (i.e., poor health, reduced education, overabundance of elderly and young populations). Compared to the remaining counties comprising the United States, these two communities appear to be among the most at-risk for negative impacts from climate-sensitive hazards in the country.
The indicator information suggests that both counties suffer from poor communications infrastructure (including Internet access which in some communities is provided by local libraries). Enhanced public libraries and Internet access are well understood as positive contributors to community resilience.42,43,44 While internet access can be an issue even in larger urban areas (Philadelphia’s Elmwood community), smaller urban areas (like Huntington, WV) and rural areas like Keystone, WV are particularly susceptible to poor broadband service. This susceptibility can compromise their citizens’ ability to remain informed before, during, and after a natural disaster. Both Huntington, WV, and Elmwood, Philadelphia, PA, are among the lowest areas in the United States for number of microwave towers, and Huntington is in the bottom 13% of areas for number of mobile broadcast towers. There is no doubt that natural disasters can cause panic and disorder. While communications infrastructure and services are often not considered a priority when there is a lack of basic needs (e.g., food, clean water, shelter), communications often provide access to accurate information that calms societal turbulence. In order for information to be communicated, underlying networks must exist and function.
Cabell County displayed other low infrastructure scores including low transportation, wastewater treatment facility, drinking water facility, and energy-producing facility infrastructure scores. Philadelphia County displayed poor scores for wastewater treatment facilities and drinking water facilities. Community resilience can be easily impacted by the extent of its transportation network. 45 Improving community resilience relies on our ability to evaluate and understand the direct and indirect roles of transportation network. The impacts of poor transportation corridors are observed time and again in the wake of most disasters within a community, city, or region. Both wastewater treatment facilities and energy-producing facilities, as well as fail-safes built into both infrastructures, positively contribute to community resilience,46,47 particularly in their abilities to recover from natural disasters Poor scores were seen for these infrastructure groups in both counties. An abundance of vacant structures, whether residential or business, and impoverished housing conditions clearly can reduce a community’s resilience to climatic hazards.48,49,50 Both counties show large numbers of vacant structures (top 1-10% of all U.S. counties). These structures can contribute to high levels of property losses due to a natural disaster and provide poor conditions for re-entry and recover. Reclaiming vacant structure can be a major strategy of community revitalization. Preparedness by the community and individuals can play a similarly important role in community resilience. 51 Both Cabell and Philadelphia counties have poor records for participation in the National Flood Insurance Program (NFIP) even though both the Elmwood and East Huntington communities are flood prone. Similarly, both counties rank among the worst counties in the Unites States for reinvestment of Small Business Administration disaster assistance in mitigation efforts. Because these counties have low participation in the NFIP, they often do not qualify for SBA loans after flooding events. The very high proportion of area with impervious surfaces in Elmwood, Philadelphia, can contribute to flooding risks.
Demographic qualities like distribution of social services, poverty, and health can affect local resilience.52,53,54 Table 2 delineates that both Cabell County and Philadelphia County are among the lower 25% of U.S. counties in most social services (e.g., blood availability, mental health facilities and professionals, food services of the needy), Clearly, the diversification of labor-trade services within a county/community can play a decisive role in that community’s recovery from climatic events, 55 particularly in any recovery effort. While ranking in the middle of U.S. counties, the proportion of population below the poverty level is high in both Philadelphia County (top 51%) and Cabell County (top 43%). Similarly, measures of disparity of income (i.e., GINI Score), show Philadelphia County to display very high levels of income inequality. The roles of poverty and income disparity can be significantly in preparedness of natural climate events and recovery from them.
Next steps
It is relatively common to assess a community’s resilience using existing information.56,57,58 BRIC (Baseline Resilience Indicators for Communities)57 has been used since 2015 to compare differences in community resilience. Unfortunately, the assessed communities do not always confirm this type of available information. Confirmation of this public information is essential by using local knowledge59,60,61,62 and through community engagement.63,64,65,66
The results from the four tools used in this study (CRSI and CEJST scores used directly and supported by HWBI and EJScreen scores), coupled with local knowledge and community engagement, can be used to confirm available public data, initiate open discussions on approaches that can be used to build local resilience capacity and describe how changes in local policies that can foster improved resilience.
Community engagement is a critical follow-up step for developing and enabling community resilience. The discussion process is fundamental to community engagement.67,68 Engagement discussions should be inclusive of a diversity of local groups and describe the definition of resilience and how it could work in the local community. Introducing a bottom-up approach that meets top–down information ensures proper understanding. The approach anticipated for the Region III project relies on decisions based on existing information to provide a starting point for community engagement. Interaction with the Elmwood and East Huntington communities (government entities and the overall community) to assess how well current information matches local knowledge is critical for resilience capacity building. Similarly, adjusting our understanding, if required, based on differences in local knowledge and understanding will help develop strategic approaches to building community resilience capacity.
The intended community interactions can be focused on several questions designed to elicit local understanding to provide confirmatory information or the lack of it. Examples of these questions for citizen, NGO, and governmental entities could include:
Would the community benefit from resilience capacity building related to natural hazard events? In what way? What are the community’s greatest strengths regarding resilience to natural hazard events? Its most significant shortcomings? What community infrastructure needs improvement? Do a large number of vacant structures exist in the community? What types? How do they contribute to poor community-level resilience? Is the community at high risk for property loss or even human life due to increasing natural hazard events? How could the availability of labor-trade services and social services for the community be improved? Are there serious levels of health issues like asthma and diabetes that make community members more vulnerable to climate-related impacts like extreme heat and poor indoor air quality? How does poverty impact the community? Does the parish display environmental, economic, social, or climatic inequities?
These questions can provide a basis for engagement and discussion to determine the congruence of local knowledge and available public information. When an agreement can be reached among the community members (government, NGOs, and citizens), then the groups can begin jointly to develop and construct strategies to improve the resilience capacity of the Elmwood and East Huntington communities.
CONCLUSIONS
The information provided here represents the initial step in a multi-step approach for enhancing of resilience capacity to natural hazard events in two environmentally and socioeconomically challenged communities in the Mid-Atlantic region of the United States. This first phase of resilience capacity building has focused on selecting target communities with local (Region III) assistance. The project’s next phase—confirmation of the attributes associated with the selected communities and collection of local information through community engagement—has been outlined. Upon this confirmation based on local knowledge or its contradiction, the community and project members will develop approaches to build, enhance, and strengthen the overall resilience capacity of the counties and communities. If feasible, these strategies can be pursued and implemented to adapt the communities to changes in climate risk and its attendant hazards. The success of the communities’ resilience capacity enhancements can be monitored, and the transferability of their approach to other communities in the Mid-Atlantic Region of the United States (as well as elsewhere) can be evaluated.
Footnotes
AUTHORS’ CONTRIBUTIONS
J.K.S.: Data collection, analysis, manuscript writing, overall lead—50%. G.C.: Regional lead, manuscript editing—15%. M.K.: Regional climate lead, manuscript editing—15%. A.K.: Manuscript editing—3%. A.W.: Data analysis, graphics—10%. B.B.: Manuscript editing—2%. L.H.: Analysis, manuscript editing—5%.
AUTHOR DISCLOSURE STATEMENT
The views expressed in this presentation are those of the author and do not necessarily represent the views or policies of the U.S. Environmental Protection Agency. Any mention of trade names, products, or services does not imply an endorsement by the U.S. Government or the U.S. Environmental Protection Agency. The EPA does not endorse any commercial products, services, or enterprises.
FUNDING INFORMATION
There was no funding other than budget item in the Federal budget.