
Abstract
Background:
There has long been a call for metrics that effectively evaluate Indigenous community health based on an Indigenous community’s worldviews and priorities. Indigenous definitions of health are often not considered in decision-making, which contributes to environmental pollution disproportionately impacting American Indian and Alaska Native communities. The Indigenous Health Indicators (IHIs) were established by the Swinomish Indian Tribal Community specific to their knowledge of health and well-being, to better reflect the integral connections to coexistence with other humans, nature, and all animate beings. The IHIs combine elements of quantification and replicability while incorporating Indigenous priorities. This collaboration sought to evaluate an amended set of IHIs for a broader Coast Salish representation of Indigenous health values and priorities using four workshops, involving Tribal members from each participating Tribe: Lower Elwha Klallam Tribe, Port Gamble S’Klallam Tribe, Suquamish Indian Tribe of the Port Madison Reservation, and Stillaguamish Tribe.
Methods:
Workshop participants were asked to rank indicators during two hypothetical pollution scenarios that impacted traditional foods. Effectiveness was measured using statistical analyses and qualitatively by transcribing discussion.
Results:
The four workshops demonstrate that the IHIs are useful in communicating what participants feel are important regarding Indigenous and Coast Salish values of community health and well-being.
Discussion and Conclusion:
Workshop participants and Tribal leaders indicated an interest in exploring this tool for different contexts. Additional research is needed to evaluate whether these indicators would be useful in diverse geographic regions.
INTRODUCTION
Imagine that an oil spill occurs on an abundant shellfish beach near your home. You have gathered here with your relations for countless generations since time immemorial. You received place-based teachings at this beach, and you are passing these on to your children, your community hosts ceremonies here. The company responsible for the spill declared bankruptcy and does not have any money to address the contamination. You are worried about the pollution. Will your children and grandchildren ever be able to safely visit or harvest from the beach again? If so, how long will it take for the damage to be repaired? Will there ever be enough clams and oysters to support cultural practice? Will the salmon return to the nearby estuary, or will they turn away because they no longer recognize the smell of their natal stream? With limited time and money, how does your community prioritize what is most important?
There has long been a call for metrics that effectively evaluate Indigenous community health based on an Indigenous community’s worldviews and priorities.1,2 American Indian and Alaska Native communities experience disproportionate impacts from environmental hazards and pollution.3,4 Yet environmental health assessments by government agencies, industry, and researchers from outside the Indigenous communities fail to include Indigenous definitions of health and omit methodological guidance on how to evaluate Indigenous health.5,6 The lack of a replicable methodology has compromised the quality and consistency of results, and outcomes for Indigenous peoples. 7
In 2008, the Swinomish Indian Tribal Community (Swinomish) began sharing their work in developing a set of Indigenous Health Indicators (IHIs), specific to their knowledge of health and wellbeing, to better reflect the integral connections to coexistence with other humans, nature, and all animate beings. 8 From 2009 to 2013, Tribal representatives from other Coast Salish Tribes and First Nations in the Cascadia region collaborated with the Swinomish experts to expand the initial set of the IHIs to a broader Coast Salish representation of Indigenous health values and priorities (Fig. 1).9,10,11 We were investigating whether the communities’ perceptions of health are more accurately evaluated when the indicators reflect Indigenous definitions of health while also respecting each community’s worldviews and sovereignty. The research objectives were to establish IHIs that reflect each Coast Salish community’s meanings and priorities, assess the usability of the IHIs using hypothetical scenarios with workshop participants, and evaluate the IHIs’ efficacy by reviewing the results with participants and Tribal leaders. In this paper, we describe how we tailored the IHIs and then tested their validity in partnership with the Port Gamble S’Klallam (PGST), Suquamish Indian Tribe of the Port Madison Reservation (Suquamish/Suquamish Tribe), Lower Elwha Klallam (LEKT), and Stillaguamish Tribes (Stillaguamish).

Coast Salish Tribes and First Nations that have tested the Indigenous Health Indicators (IHIs).
METHODS
Swinomish developed the IHIs through a triangulation method to gather community health concerns and priorities: a review of archive materials, current Tribal documents, and interviews with Tribal members. The creation, development, and implementation of the IHIs at Swinomish have been previously discussed in detail elsewhere.12,13,14 Staff from each of the Tribes employed the same triangulation method Swinomish used to compare how each community defined and prioritized health and well-being to the initial set of Swinomish IHIs, looking for similarities and differences in word use, meaning, and emphasis. We did not want to assume that a regional set of IHIs was guaranteed, considering that even geographically close communities differ in their Indigenous knowledge, language, and values. While the Swinomish IHIs reasonably reflected community health and well-being goals in the other communities, and priorities stated in archives and recounted via interviews with current experts and Elders, there were some missing elements. The regional Coast Salish group amended some of the indicator names to more regionally acceptable names and added two indicators for a total of six IHIs: community connection, (natural) resources security, cultural use, education, self-determination, and resilience (Table 1).
Indigenous Health Indicators
Stillaguamish decided to use the words after the forward slash to describe these concepts more familiar in their culture.
Each indicator is composed of three parts called “attributes”. The attributes are the true “meat” of the indicators since the attribute connects terms used by community members and found in Tribal documents. For example, the attributes for the “resources security” indicator are the quality of the resource; access to the resource by harvesters; and the extent to which harvesting, consuming, and/or using the resource is perceived as “safe” by the community (e.g., absence of pollution). All three attributes are priorities to community members past and present and Tribal governments alike. The indicator names (such as “resources security”) are not commonly used language in any of the communities but instead created to group the attributes and provide terminology that those outside of the Indigenous communities can understand (in other words, “translations” for non-Indigenous peoples).
Once the staff amended the IHIs at these two levels—as indicators, and in terms of specific attributes—the next steps were to define each of the IHIs using constructed measures and scales and then to test the extent to which the measures were understandable to the community members and accurately conveyed their health concerns and priorities. To ground-truth the amended set of IHIs, staff from each participating Tribe organized a workshop for their community. 15 Staff recruited workshop participants by inviting Tribal members considered knowledge holders, specifically those who had familiarity with natural resources issues and community involvement. The recruitment goal was 15 participants across diverse ages, viewpoints, and family groups, but not to achieve representation of overall Tribal demographics. The primary workshop goals were to evaluate if the indicators resonated with participants and whether the ranking and weighting procedures were comprehensible and operational.
In September and November 2012 respectively, LEKT and PGST hosted their workshops. Suquamish Tribe hosted its workshop in March 2013 and Stillaguamish Tribe its workshop in November 2013. Workshop results were presented to the Tribal Council of each Tribe where the workshop occurred. Each Tribal Council was asked to approve sharing the workshop results in a published journal article.
Workshop discussions lasted about 3 hours, including a lunch of traditional foods. Each workshop hosted by each Tribe occurred at a communal space on the reservation. Swinomish experts J.D. and Swinomish Elder Wanaseah (Larry Campbell) facilitated each workshop along with at least one representative from the hosting Tribe. The Tribal representative was typically a political leader or an expert on cultural and natural resources. Each workshop participant received an honorarium for sharing their time and knowledge.
Every workshop began with an opening prayer and visiting experts giving thanks for being welcomed onto the Tribe’s lands. After introductions, we explained the purpose and how the handheld polling clickers would collect the participants’ answers. We emphasized that all answers are anonymous and that no data would be publicly released without prior approval by the Tribal Council.
Questions were projected in PowerPoint®, with TurningPoint® polling software used to collect and display results. The polling software allows answers to be collected anonymously, tallied, and recorded immediately via wireless, hand-held devices. Using simple statistics, the polling responses were collated and visually depicted in the PowerPoint presentation (e.g., bar graph). Each workshop used the amended IHIs (Table 1), with specific substitutions included and described. Indicators were modified slightly by Tribal staff to provide context and familiarity to participants. We added an illustrative photograph specific to the Tribe next to the name of each of the six IHIs to contextualize the indicator’s meaning and to visually aid in describing the indicator. The same statistical methods described in previous publications were employed in these workshops. 16 To briefly summarize: Four different types of questions were asked of each participant (Table 2). The first set of questions established a primarily demographic community health baseline: age, gender, and residential status on the reservation.
Indigenous Health Indicators Workshop Facilitator Questions
The second set of questions, called “Where are we now?”, established a baseline by scaling to rank each indicator individually using a four-point descriptive scale:
Things are very good Not very good Looking pretty good We’re doing great
Using a four-point scale compelled participants to think about their answers instead of picking a “middle road” option. 17 The scales allow for concerns and priorities to be demonstrated without releasing proprietary knowledge that may be driving the chosen ranking.
The third set of questions asked participants to rank the three attributes of each indicator, choosing them in order from the most to least important, while understanding that all are important overall. For example, for “resources security,” participants ranked in order of most important to least important the three attributes of “access,” “quality,” and “safety.”
The fourth set of questions prompted participants to rank indicators from most to least important during two scenarios, knowing that all are important but ranking them based on the Tribe’s limited time and resources to address each attribute one at a time. The scenarios contextualize ranking and weighting the indicators. Facilitators presented the group with two hypothetical yet realistic scenarios of local pollution events (Table 3). Participants first used direct ranking and then criteria weighting which indicators would be most important to address first considering the contamination and potential threat to Tribal resources. Tribal staff slightly changed the scenarios to make them unique and relatable, for example, including place names specific to each Tribe.
Scenarios Presented to Workshops
After lunch, the facilitators shared the results with the workshop participants. Seeing the results on the screen sparked conversation and stories. One of the experts transcribed notes of the qualitative discussion dialogue for each workshop. The participants offered their interpretations of how the results reflected community health and well-being meanings and priorities in the community. The effectiveness of each indicator was gauged by its ability to stimulate discussion and how well the indicators resonated with participants.
RESULTS
Both the quantitative and qualitative results are detailed in the “Results” section. All participants who volunteered were enrolled in the workshops. 65% of the participants at the workshops were women. The age group with the most participants was 51–60 years of age having 15 participants across all four workshops (Fig. 2). The majority (over 60%) of respondents from Tribes surveyed in the workshops lived on the reservation.
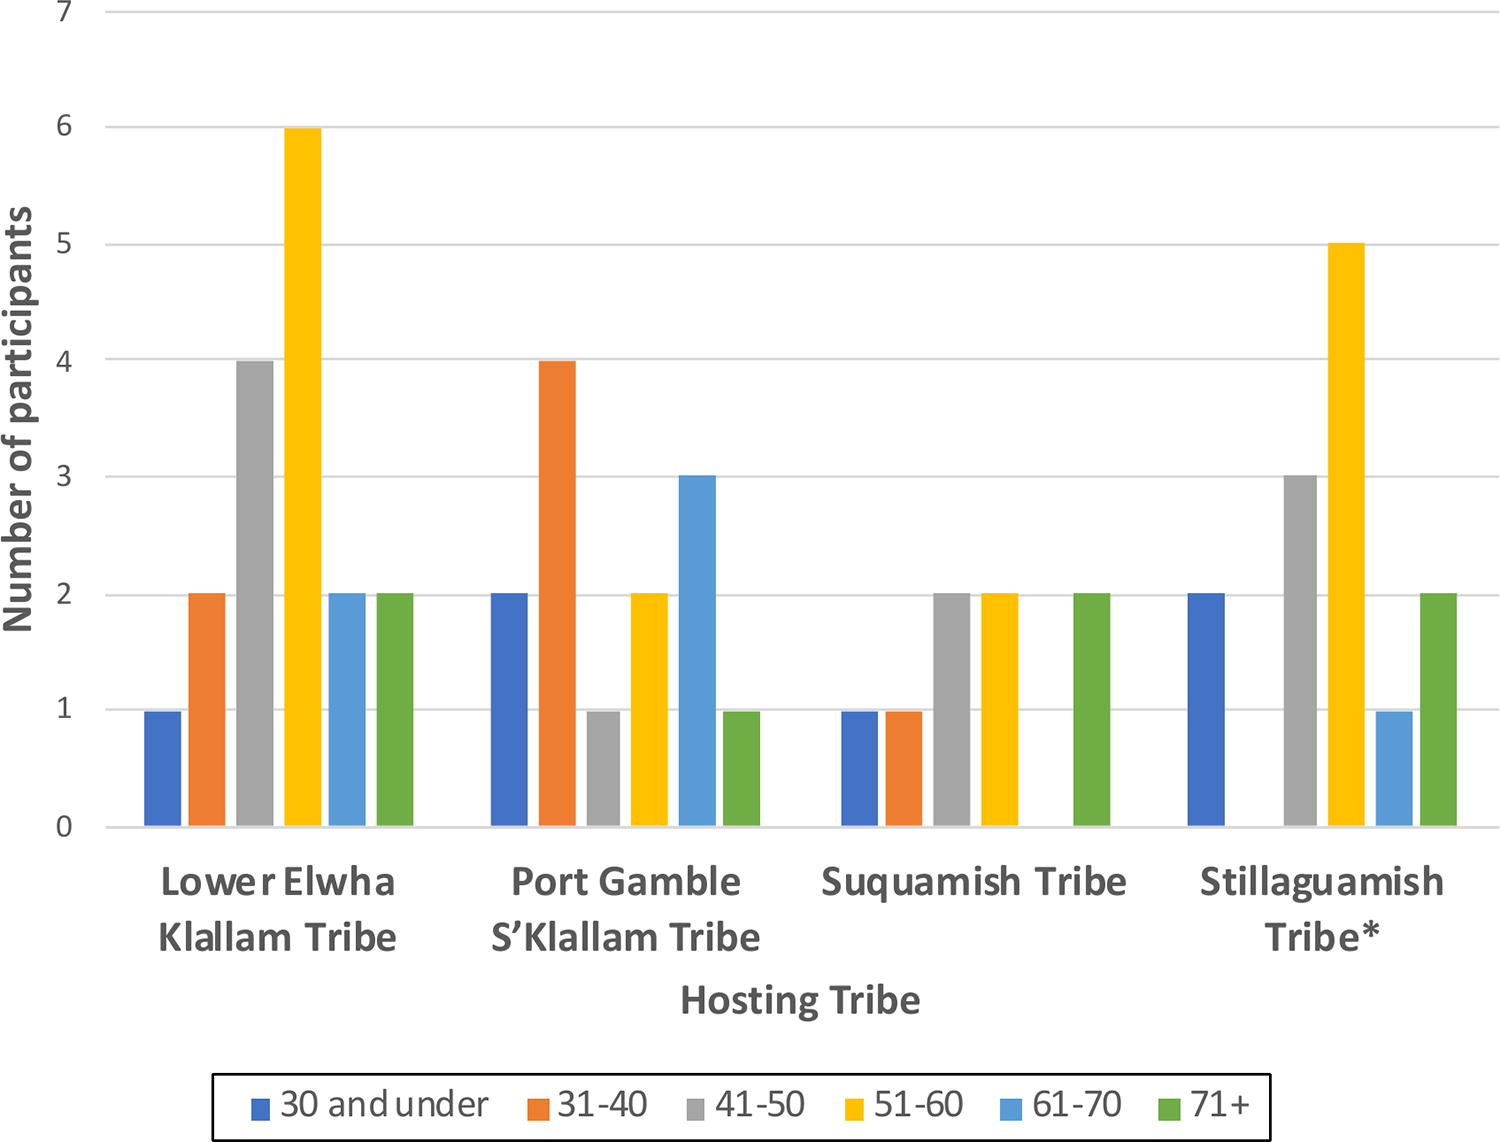
Age demographics of workshops from participating tribes. *Two Stillaguamish Tribe workshop participants did not respond to the question about age.
Workshop participants from all four Tribes had different perceptions of the overall community health when asked “On a scale of 1–4, in general, how are things now in terms of the overall health of the community?” 18 Suquamish participants responded the most to “Not very good” at 71%. For Stillaguamish participants, the largest response was “Not very good” at 50%. PGST participants were evenly split between “Looking pretty good” and “Not very good.” LEKT participants responded the most to “Looking pretty good” at 65%.
Participants next ranked each indicator after being presented with Scenario 1 then Scenario 2. Resources Security was commonly weighted as the most important indicator in both scenarios (Tables 4 and 5). Three of the four workshops ranked “Resources Security” or “Natural Resources Security” as the most important indicator in Scenario 1. Workshops most frequently ranked “Resources Security” as the most important indicator for Scenario 2. When Resources Security was not weighted as the most important, it was weighted as the second most important indicator. Cultural and ceremonial use was commonly prioritized by workshop participants across all four Tribes. Community connection was frequently weighted as the second most important indicator during the scenarios.
Health Indicator Ranking by Workshop for Scenario 1: Oil Spill Cleanup
Health Indicator Ranking by Workshop for Scenario 2: Bay/River Pollution Cleanup
There was substantial variability between weighting the “Well-being” indicator. PGST and LEKT workshops weighted this indicator as least important in Scenario 2. The Suquamish workshop weighted “Well-being” as the most important for Scenario 2. The Stillaguamish workshop gave “Well-being” a middle priority.
No indicator was unanimously ranked as least important in either scenario.
Qualitative
The indicator ranking spurred discussion among workshop participants about natural resource issues. Participants across all workshops had concerns about resource availability for another seven generations impacting Tribal members’ ability to pass down cultural heritage to future generations. Across all four workshops, participants voiced concerns about how to best allocate diminishing natural resources between Elders, youth, and families.
A common theme across all workshops was the importance of continuing intergenerational knowledge transfer between youth and Elders. All four workshops discussed passing down knowledge to youth and future generations through the Elders. While participants generally agreed with the importance of reclaiming and continuing cultural teachings, there was also a more nuanced discussion regarding the necessity of reciprocal relationships. The youth cannot learn if the Elders do not teach, and the Elders cannot teach if the youth do not want to learn. Each is necessary for the other and has limited effect without the other. All workshops shared some level of dissatisfaction with how well these reciprocal relationships functioned in their communities.
Community connection
Discussion around this indicator demonstrated differences among workshops. At LEKT, some participants felt that fishers were good about sharing their catch with the cooks for community events and celebrations such as Canoe Journey. At PGST, a participant expressed frustration with the level of sharing.
Suquamish workshop participants felt that participation (roles) was difficult to evaluate because of differing views on how to define community. One participant commented that it is always the same community members who show up even though notice goes out to all. Canoe Journey has enormous participation with a commitment over multiple days, which many workshop participants viewed as an example of Community Connection.
For the Suquamish workshop, coming to a common understanding of the word “community” seemed to be needed not only for the community connection indicator but for the overall discussion. Participants offered several different definitions of “community,” all of which had relevance in specific contexts. Does “community” include those who live far away and only collect per capita? Is it based on geographical location or a smaller percentage of people who are active as a community? If the perception and definition of community affect how other indicators and attributes are valued, it may be important to bring this forward in the process.
Suquamish participants indicated they have seafood at gatherings but lack plants, elk and deer meat, and other traditional gathering items. “Fishermen are independent here, they provide for family and events but that’s it.” There was discussion about using the workshop methodology to help identify ways to improve access to and sharing of traditional foods.
At Stillaguamish, a participant noted that fish consumption is low due to poor access to harvest areas. “Many tribes have 400–800 grams of fish per day. All we have is a small coho [salmon] run and shellfish beds which are not established. Our fish consumption rate is low because of poor access. Many in our Tribe are turning to hunting.” Another participant stated, “Tribes eat the highest rate of fish [in Washington State]. We want our food to be safe to eat and we take pride in our fish.”
Resources security
The indicators promoted discussion among PGST participants about who should participate in a limited harvest. Some felt that Tribal members with family to support should get priority, while others felt that the youth should get a chance. There was discussion on how the harvesters need to be more engaged in natural resources decision-making through more surveys and interviews on the issues of resource security. Some participants expressed frustration with the process of negotiating with other Tribes for harvest quota. One participant voiced frustration about the pace of the Port Gamble Bay cleanup, and the ability to fish the bay and how that was impacting his income.
Some PGST respondents had difficulty weighing sharing against access and abundance. They felt sharing was not less important than access or abundance, but dependent on access and abundance. There were concerns about too many harvesters relative to the abundance of seafood. “It’s harder to make money on the beaches. Quotas are low on good beaches and high on beaches with almost nothing to harvest. Clams are too small and scarce; I have to dig a long time and have to travel farther and farther.”
Some LEKT tribal members felt that if they had more input, there would be enough resources.
Suquamish participants struggled with how to answer, “Where are we now?” Participants talked about the cultural and spiritual importance of water to the Tribal community and identity. The workshop participants then recommended that the term “resources” in resource security be expanded to include water. Suquamish participants remarked that water is a natural resource too, and that the health of water itself should be included in natural resources security.
Ceremonial use
Some LEKT participants felt that community participation in ceremonies was increasing. However, even if resources are available, there are issues with accessing fishing grounds and plant gathering areas for ceremonies. One reason is the difficulty of coordinating with non-tribal governments or private property owners.
“Some of us go to our areas and get cops called on me. Good thing I know our area, treaties, and laws. The person who thought they owned the whole ocean would chase away Indians from their own area.”
At PGST, respondents acknowledged having polluted foods at some gatherings and ceremonies.
Suquamish participants are starting to see respect for their culture and traditions grow especially among the youth. Basket weaving has seen a return to traditional thanking the cedar, wrapping the bottom with part of the cedar bark, and offering tobacco to the cedar for its sacrifice. There was much positive response on “Cultural Use-Spiritual/Cultural needs” being included.
Education
The discussion around the Education indicator captured the differences in perceptions among the four workshops. LEKT workshop participants discussed misconceptions and prejudice against Native Americans that are reflected in schools. Some participants felt that Native children are questioned about the validity of their sources when presenting their oral histories at school.
At PGST, one participant was pleased with youth getting involved with their culture. “Our kids view clam digging and shellfish harvesting as our cultural tradition more than other neighboring Tribes.”
At Stillaguamish, one participant noted the lack of youth involved in the survey. “The current generation has eyes closed and ears shut. Those under 18 are vocal and I would be interested to see how they view these questions compared to older ones’ responses.” One participant noted how the youth are not learning the traditional ways, and how it impacted the community’s physical health. Technology, fast foods, lifestyles, and economics were discussed as barriers to learning traditional ways.
Self-determination
The Elwha River dam removal 19 has been positive for self-determination for LEKT, and many LEKT participants were proud to see it has become an internationally recognized fish habitat restoration project.
“When I was a kid in summer school, Elders would take us to get seafood we no longer eat or gather like octopus, Chinese slippers—teaching how to do it. Now in marine science class, kids say ‘Oh gross.’ We need to take kids and teach them about gathering again.”
Even if there is an interest in gathering seafood or traditional foods, many find it hard to find the time to fit it into their schedules. “We started working and didn’t have time to get seafood like we were used to, it ended up being a treat. I realized the kids were missing out and tried to do more gathering so children could eat more traditional food.”
Suquamish participants remarked that “Economic” needs to be taken out of the development attribute.
Well-being
Many participants were concerned about seafood quality affecting their well-being. A participant remarked that their connection to the environment was impacted by access, as they “could no longer camp in places that they could in their youth.”
One participant remarked on resilience “As long as Tribal people stay strong and support each other it will be OK. Follow our regulations then the resources might be there for the future. Tribes keep over-harvesting—limited dam removal—we will die trying.”
The IHIs received some critical feedback from participants. One PGST Elder noted, “I don’t know what to think about what we just did. Is the community represented? Did we understand the questions?” Some participants noted they had difficulty evaluating some of the indicators because of unclear definitions. Some participants thought that the indicators needed to better incorporate upland knowledge into the scenarios and questions such as traditional plants (e.g., cedar, nettles, and berries).
DISCUSSION/CONCLUSION
We developed the IHIs to help bridge the divide between Western science health assessments and how Indigenous worldviews evaluate health and wellbeing. Results from the IHIs could be employed in parallel with conventional assessments to increase understanding of impacts and priorities in Indigenous communities and improve decision-making. A large measure of the IHIs’ success lies in the ability to engage community participants in deliberating common understandings and definitions of Indigenous community health. Based on participants’ willingness to complete the questions and the positive feedback received after the workshops, the rankings/weightings appear to resonate with Coast Salish Tribal members.
The results of the four workshops demonstrate that the indicators and attributes are useful in communicating what participants feel are important in the context of health and well-being. Some indicators were commonly ranked as most important across all workshops. There were common themes discussed in all four groups. There are common values and concerns among workshop participants from all four Coast Salish communities such as resources security, cultural and ceremonial use, restoration, community connection, and improved access to resources.
However, priorities differed even though the same scenarios were presented. Participants engaged with each other to understand and define the indicators and attributes through the lens of personal, family, and community experience and history. Through the discussion, participants considered what factors can be used to assess the overall health of the community and how the indicators and attributes may influence each other. The differences demonstrate that each community has unique worldviews and priorities, therefore, one cannot draw generalizations across even neighboring Indigenous communities. The differences found between scenarios highlight that the IHIs can distinguish aspects of health and well-being specific to that scenario, therefore it is not possible to generalize a set of IHIs for all possible scenarios.
The results from the workshops indicate that the IHIs can bring decision-making power back to the community (Fig. 3). The format allows the community to interpret their results and reflect on priorities of how to address the issues rather than placing the decision-making power with an outside researcher, who may have limited understanding of the community or hold (often unknown, or unrecognized) biases. Incorporating the IHIs can provide both a more comprehensive understanding of Indigenous health concerns and a means for Indigenous peoples to become more equitably involved in health evaluations. To the authors’ knowledge, there are no other recognized indicators of Indigenous health that are in use today.

Steps to tailor and test the effectiveness of the Indigenous Health Indicators (IHIs). Modified with permission from Figure 3 in Donatuto et al. 2020.
A further measure of the usefulness of the IHIs is their adaptability to a wide array of decision-making and priority-setting contexts. The indicators can be amended to reflect each Tribe’s worldview. Each time the indicators are used, they will be informed and refined by the individuals’ and community’s history and current experiences, as well as their visions and hopes. Developing shared expressions of value, whether within a Tribe or representative of collective Tribal values, provides a strong base for Tribes to establish priorities in allocating, protecting, and restoring resources.
Workshop participants and Tribal leaders indicated interest in further exploring how this tool may be used. PGST has used the IHI methodology to evaluate community perceptions of climate change risk assessment. Several Suquamish Tribal Council members voiced interest in how the indicators could be used to identify and express community concerns and priorities. Suggestions included allocating harvesting and staff resources, establishing cultural program priorities, and negotiating environmental remediation and restoration actions. The Stillaguamish Chairman suggested using the IHIs to help with community planning for ceremonies and a youth program.
These workshops were part of a refining process for the IHIs and we are thankful for the Tribal community members who participated. The IHIs have since been tailored and employed in diverse locations across North America by Indigenous communities evaluating a broad range of contexts. One community in North Carolina has considered the IHIs as a foundation to demonstrate health from a positive point of view to uplift community members in prioritizing their health and well-being and to offset the slew of negative metrics publicized by the local county health department. An Indigenous community has adapted the IHIs to assess the impacts of oil tanker traffic in British Columbia, Canada. 20
Additional research evaluating whether these indicators would be useful in diverse geographic regions is needed. The work has only yet begun.
Footnotes
ACKNOWLEDGMENTS
The authors would like to thank Chairman Shawn Yanity and Pat Stevenson for hosting the workshop at Stillaguamish Tribe. The authors acknowledge that all they have learned has been taught to them by their Elders. This knowledge is both a gift and a responsibility of good stewardship. This paper is dedicated in loving memory to Swinomish Elder Wanaseah (Larry Campbell), who walked on February 1, 2023. He helped provide resources and supported in conceptualization, methodology, investigation, supervision, and validation.
AUTHORS’ CONTRIBUTIONS
R.O’R.: Resources, writing—original draft, writing—review and editing, visualization, formal analysis, and investigation. L.D.: Resources, writing—review and editing, and investigation. D.T.: Resources, writing—review and editing, investigation, and methodology. A.O’S.: Writing—review and editing. J.D.: Resources, conceptualization, methodology, investigation, formal analysis, supervision, project administration, funding acquisition, and writing—review and editing.
AUTHOR DISCLOSURE STATEMENT
All authors declare that they have no conflicts of interest.
FUNDING INFORMATION
This work was funded by EPA Science to Achieve Results (STAR) grant #RD-83479101-0 awarded to the Swinomish Indian Tribal Community (SITC). Funds were distributed to each participating Tribal government through subawards with SITC. Research reported in this publication was supported by the National Institute of Environmental Health Sciences of the National Institutes of Health under Award Number P42ES016465. The content is solely the responsibility of the authors and does not necessarily represent the official views of the National Institutes of Health.