
Abstract
Racial gerrymandering has been an ongoing problem when redistricting efforts are undertaken. Previous research has shown strong relationships between gerrymandering, racial diversity, and the presence of superfund and other toxic waste sites. In this study, we build off these studies and analyze the relationships that exist between gerrymandering, toxic waste sites, and the Supplemental Nutrition Assistance Program (SNAP). This work, in part, builds off the original United Church of Christ research conducted in 1987, which indicated that 60% of Black people lived in proximity to toxic waste facilities. By including SNAP, we offer an additional layer of understanding to environmental inequities in the United States. Using measures of geometric complexity as a surrogate for gerrymandering, we find that gerrymandering, in conjunction with socioeconomic variables (children receiving SNAP, number of carcinogenic toxic waste sites, and number of individuals younger than 18 years), represents ∼79% of the variance explaining the percent of Black individuals in a given congressional district in our study area (R2 = 78.6). We find similar results when describing the White population, although the relationships are inverse (R2 = 81.4).
INTRODUCTION
The environmental justice movement in the United States gained significant traction in the late 1980s. In 1987, the Commission for Racial Justice of the United Church of Christ (UCC) published a report on hazardous wastes and race that linked environmental injustices to race, specifically Black people and other ethnic minority groups, nationwide. 1 Since this report, there has been an increase in literature that documents environmental injustices and the resultant impact of those injustices on vulnerable communities. For example, Bullard 2 and Adeola 3 both noted that there were ongoing challenges facing minorities due to institutional racism, with those challenges occurring in housing, employment, and access to public services. Despite the interest that the 1987 UCC study generated, Bullard et al. 4 found that hazardous waste facilities are still disproportionately placed near racial and ethnic minority communities. Adeola 5 found similar disparities through research conducted in Baton Rouge, Louisiana, which indicated that Black people were more likely than their White counterparts to live near hazardous waste facilities. In addition to finding that Black people and ethnic minorities are more likely to be placed near toxic waste facilities, research has shown that there were negative responses in health 6 and mental health 7 because of exposure to contaminants from these facilities. This exposure to contaminants associated with toxic waste facilities helps explain the health disparities that are often found in minority and low-income communities. 8
At a regional level, and not dissimilar from findings at a national level, environmental injustices are repeatedly shown to disproportionately impact communities of color, low-income communities, and children. For example, Rosner documented extensive environmental injustices in Flint, Michigan, spanning decades. 9 More recently, Rudden examined the inequalities found in Flint, Michigan’s, handling of the water emergency that occurred between 2014 and 2016. 10 Flint is not the only city in Michigan that has been found to marginalize minority populations. Arab Americans in Detroit have faced environmental injustices, and it has been suggested that there is a link between low-income Arab American communities and increased instances of hypertension, asthma, and obesity-related health problems. 11 In Illinois, Maranville et al. analyzed not only the racial dynamics of communities near superfund sites but also socioeconomic indicators and found similar patterns regarding the environmental inequities faced by minority populations. 12 Yet, another study found that concentrated animal feeding operations associated with industrial chicken production were also located in close proximity to vulnerable populations in Maryland and Delaware. 13
In addition to analyzing how minorities and toxic waste facilities are spatially interconnected, there is compelling research that shows institutional forms of marginalization, such as gerrymandering, are also significant when describing the location of both minorities and toxic waste facilities. For example, Kramar et al. found that the extent to which a congressional district was gerrymandered was a robust indicator of distance from superfund sites, as well as racial composition. 14 Furthermore, gerrymandering provides a mechanism that exacerbates racial inequalities by reducing the political power of certain groups, which is in stark contrast to the goal of the Voting Rights Act of 1965. 15 In this context, it is not difficult to interpret current gerrymandering (or redistricting) practices as a way to circumvent the Voting Rights Act and prevent or minimize the political power of a group or groups of people. 16 Racial gerrymandering, as the term is referred to, has the effect of creating geometrically complex voting districts and ensuring that better schools, amenities, and other community advantages go to whiter, less ethnically diverse districts, 17 as well as insuring that one voting perspective is favored while marginalizing others. 18 Defined as “expressive harm aimed at preventing jurisdictions from sending an impermissible message by separating voters on the basis of race without adequate justification,” 19 racial gerrymandering remains at the forefront of political discourse with recent examples manifesting themselves between 2010 and 2020 redistricting efforts of numerous states. 20 One of the more pressing questions facing the role that gerrymandering plays in marginalizing minority populations is how to quantify the extent to which a district is gerrymandered.
Historically, the primary criterion for establishing districts was focused on an equal proportion of individuals while ignoring the spatial aspects associated with the districts. The interest in quantifying the extent to which a district has been gerrymandered has increased, and the idea of spatial compactness was one of the concepts that some of the earliest attempts at quantifying shape complexity used. 21 Building off these early attempts, Niemi et al. examined 25 different measures of compactness, 22 and more recently, Kaufman et al. presented a statistical model that predicts compactness based on the geometric complexity of compactness evaluations by individuals responsible for redistricting efforts. 23
Another, less studied variable that plays a role in racial inequity is the Supplemental Nutrition Assistance Program (SNAP). SNAP was initially established as the Food Stamp Program in 1939 but was discontinued in 1943. In 1961, the program was revitalized as a pilot program. The pilot was deemed successful, so the Food Stamp Act of 1964 officially established the federally funded program. Its overall objective has been to ensure access to food for low-income individuals and families; it became nationwide on July 1, 1974, under the Johnson administration. Before 1977, accessing food stamps had been a challenge to some individuals who qualified because they were required to purchase the stamps. Thus, removing this requirement under the Agriculture Act of 1977 removed this barrier. The latter half of the 1980s was characterized by a “severe domestic hunger problem.” 24 Three significant acts were passed during this decade: the Food Stamp Act of 1985, the Hunger Prevention Act of 1988, and the Mickey Leland Memorial Domestic Hunger Relief Act of 1990. Two major provisions under the Food Stamp Act of 1985 are the elimination of sales tax on items purchased using food stamps and mandating that all states implement an Employment and Training (ET) program intended to help SNAP participants gain skills and training that will help them in becoming self-sufficient. Notwithstanding the benefits of SNAP, there has also been research showing that SNAP recipients may still suffer from food insecurity and the lack of available healthy options. 25
In this study, we expand on the current body of literature that addresses environmental inequities with toxic waste facilities but introduce another, less studied variable—SNAP and how it is distributed relative to the proximity of racial and ethnic minorities to toxic waste sites, particularly those characterized as “carcinogenic.” In doing so, we build off previous research that has shown the prevalence of superfund locations in, or around, minority and vulnerable populations. Furthermore, we build off work by Kramar et al. 26 by looking at the role that gerrymandering plays in SNAP distribution and the relationship that gerrymandering exhibits to both superfund location and SNAP distribution.
Specifically, we investigate the following questions:
Is there a relationship between toxic waste sites, gerrymandering, and SNAP distribution as it pertains to the racial makeup of a congressional district? Which is the strongest predictor of race in congressional districts? SNAP, toxic waste facilities, gerrymandering coefficient, and the like? What is the disparity between those districts with a higher minority population and those with a higher White population?
METHODS
Study area
The study area consists of a five-state region in the Midwest United States, including Ohio, Indiana, Michigan, Illinois, and Wisconsin (Fig. 1). This region was selected because of ongoing issues pertaining to social and environmental justice. Michigan, for example, has a long-standing history with environmental injustice. 27 Specifically, this region exhibits a high concentration of industry, coupled with a large number of toxic and environmental waste sites, as indicated by the Toxic Wastes Inventory (TWI) dataset.
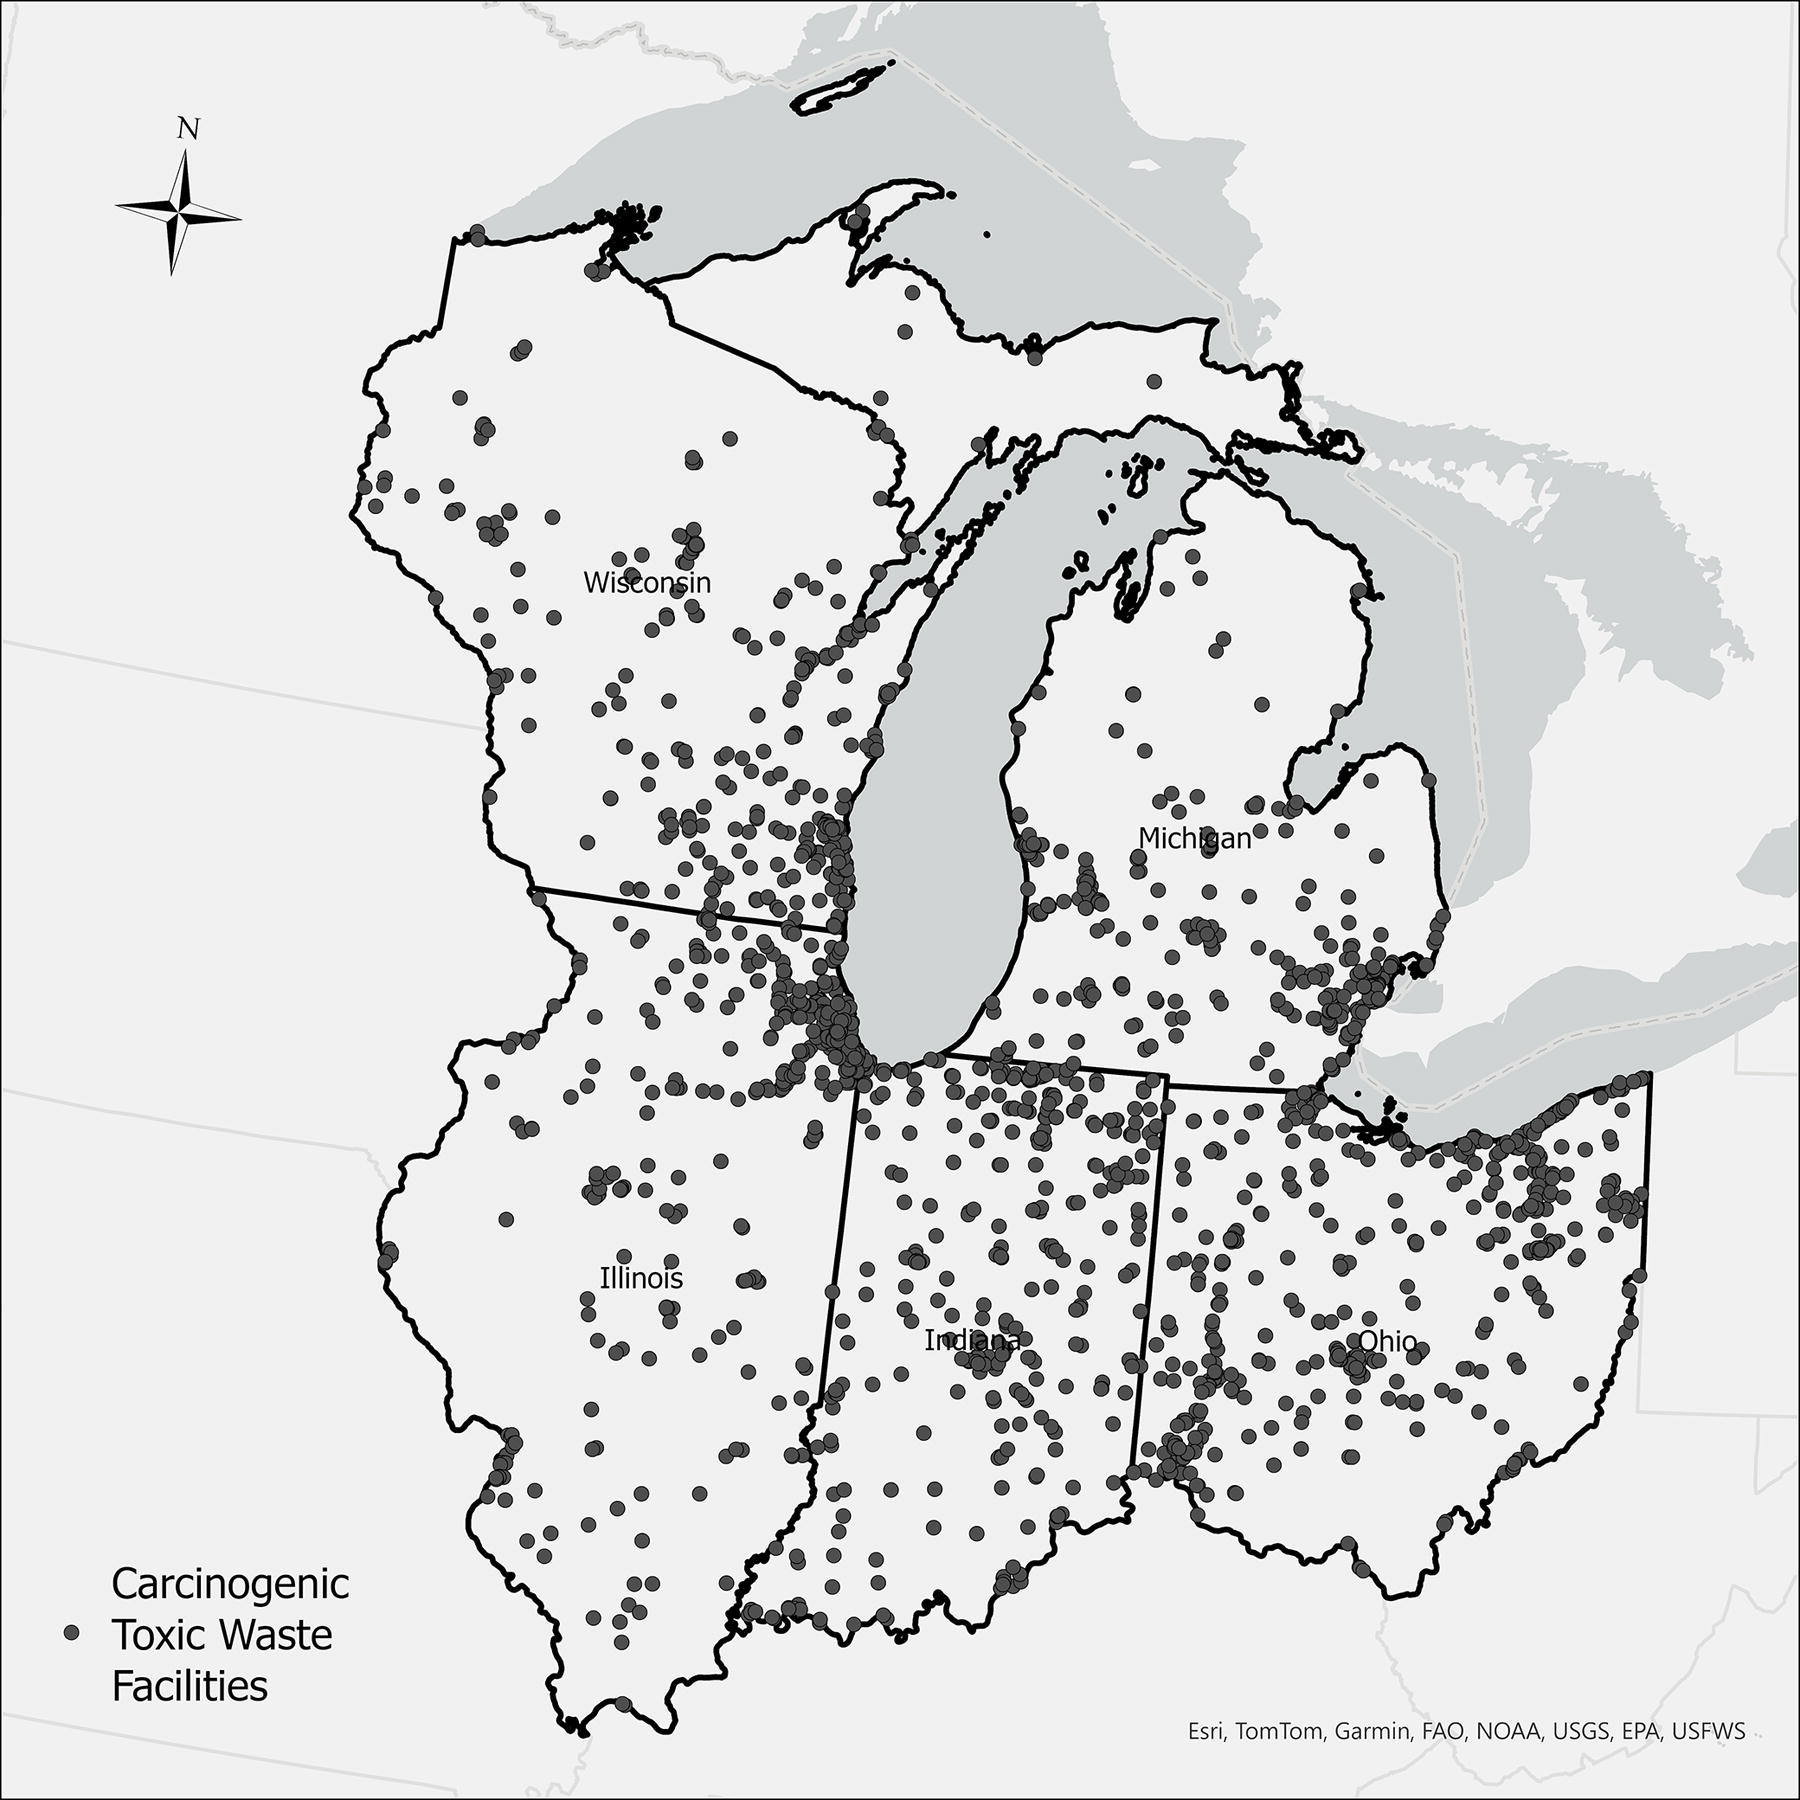
Study area with the carcinogenic toxic waste locations plotted.
Spatial data and analysis
Data for this study were acquired from the American Community Survey, the U.S. Census Bureau, and TWI. Specifically, the SNAP data were obtained for 2019 from the American Community Survey. Population estimates were obtained from the Census Bureau Summary File 1 (SF1) table. Spatial data for the 116th Congress congressional districts were obtained from the U.S. Census Bureau Topologically Integrated Geographic Encoding and Referencing files. Once the data were obtained, we imported the spatial data into ArcGIS Pro 2.8. The tabular data pertaining to SNAP were joined based on a one-to-one table cardinality to associate the SNAP and population information with each of the congressional districts in the study area. The gerrymandering coefficient was calculated following Kramar et al. (2017) and further building off the work of previous studies. 28 Specifically, we calculated the gerrymandering coefficient using p2/a where,
p = the perimeter in miles of the congressional district, and a = the square miles of the congressional district.
For the purpose of this analysis, we did not account for mutable versus immutable boundaries as Kramar et al. (2017) found that, overall, the presence of geometrically complex immutable boundaries did not significantly affect the overall model performance. 29
The TWI dataset was summarized to the congressional district unit of analysis using the “Summarize Within” tool in ArcGIS Pro. This process provided a count of the number of TWI sites within each congressional district in the study area. In addition to the count of TWI sites, we calculated a mean from the distances of each TWI within a congressional district to the geographic center of that congressional district.
Statistical analysis was conducted using R 4.0.5. 30 We used random forests as the analytical method to determine the relationships between the extent to which a congressional district was gerrymandered, the location of toxic waste sites, and SNAP benefits within the five-state study area as they relate to the percent of Black population or White population. We partitioned the data into training (70%), validation (15%), and testing (15%) datasets. Model fit was evaluated using the mean decrease in importance graphs, error graphs, and probability versus observed graphs.
RESULTS
Summary and descriptive statistics
The study included 67 congressional districts that spanned five states. The districts exhibited variation in the percent of Black population, number of toxic waste sites deemed carcinogenic, and the extent to which a district was gerrymandered (Table 1). The distribution of the independent variables ranged significantly across all values. For example, the median income ranged from a minimum of $39,005 to a maximum of $105,292. Likewise, the percent of households that were considered below poverty for the previous 12 months ranged from 5.6% to 27.7%. Dependent variables included in the analysis were the percent of the congressional district that was designated as Black/African American, and the percentage of the congressional district that was designated White/Not Latino or Hispanic. Additional independent variables used in the analysis are found in Table 2.
Summary Statistics for the 67 Congressional Districts in the Study
The percentage of Black population ranged from 0.4% to 56.9%. The number of TWI sites designated as carcinogenic ranged from 0 to 159. The G-coefficient ranged from a low value of 21.25 to 230.99, where lower values indicate larger and less geometrically complex districts, and the higher values indicate smaller, more compact, more geometrically complex congressional districts.
TWI, Toxic Wastes Inventory.
Additional Independent Variables Used in the Models
Attempts were made to select variables that represent differing levels of socioeconomic status while not effectively “closing” the variable—for example, percent of houses below poverty and percent of houses above poverty. Those variables together would equal 100%, leaving no room for variability (as one increases, the other decreases).
SNAP, Supplemental Nutrition Assistance Program.
Random forest models
The random forest model stabilized after 200 trees (Fig. 2). Of the independent variables used in the analysis, those contributing the most to understanding the percentage of those identifying as Black/African American were found to be the percent of households receiving SNAP benefits that had children younger than 18 years, the total percent of households with children younger than 18 years, the number of TWI sites designated as carcinogenic, and the G-coefficient. These four variables contributed to both the Inc Node Purity and the increase in mean square error (Fig. 3). We found that when using this approach to estimate the percentage of White population, the top variables included the percentage of households receiving SNAP benefits that had children younger than 18 years, the percent of households receiving SNAP benefits that were designated as below poverty in the last 12 months, the percent of households with children younger than 18 years, and the number of TWI sites designated as carcinogenic. (Fig. 4). For both dependent variables, the testing and validation datasets exhibited pseudo-R2 values of high predictive capability (Black/African American: 0.695 and 0.86; White: 0.625 and 0.92). A comparison of the observed versus predicted for the full models (pseudo-R2) indicates an inverse relationship between Black/African American and White populations based on the distribution of predicted values (Fig. 5).
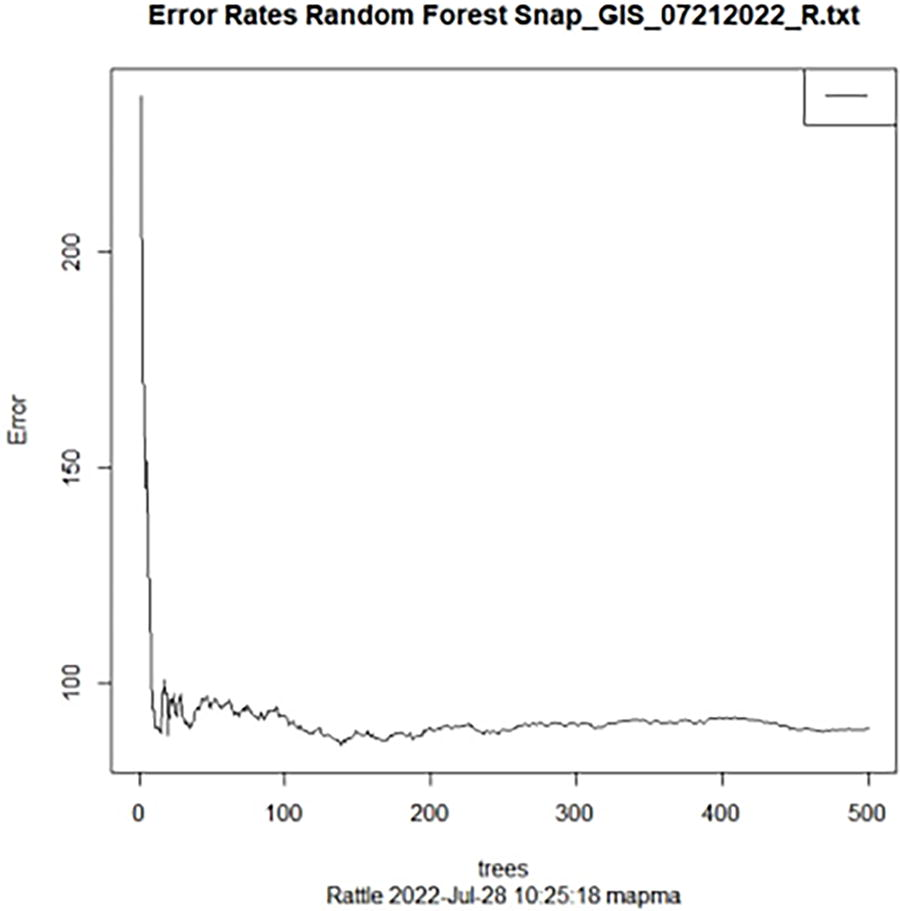
Error rates for the random forest model indicating stabilization of 200–300 trees.
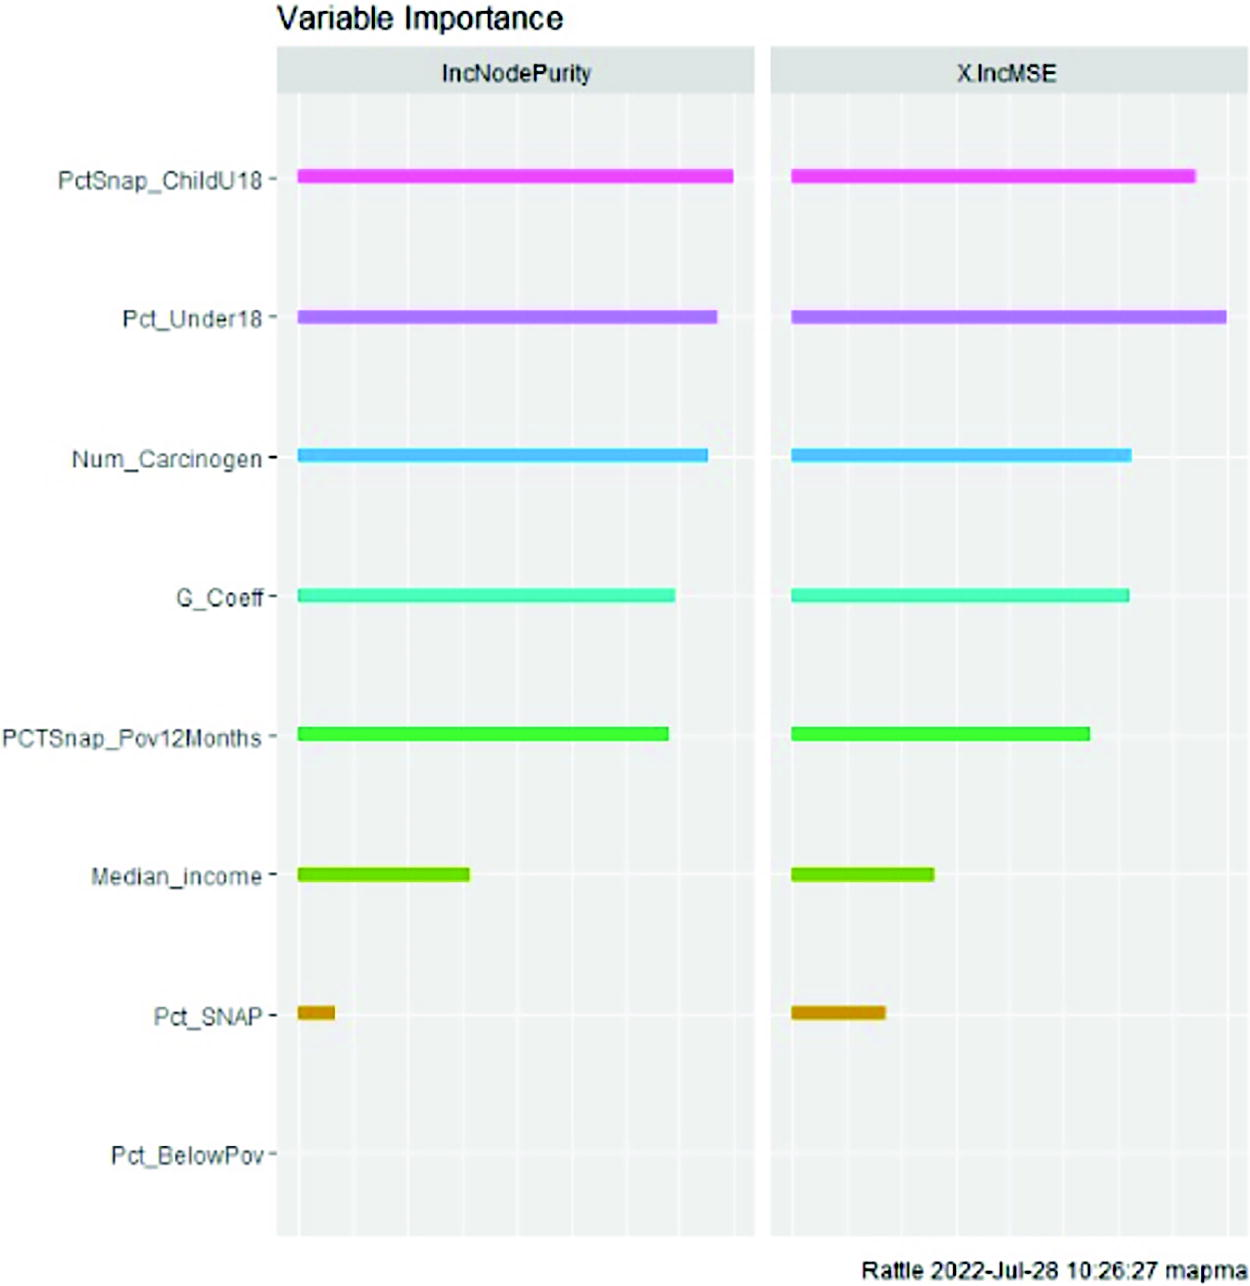
Variable importance for determining the percent of Black/African American households in a given congressional district.
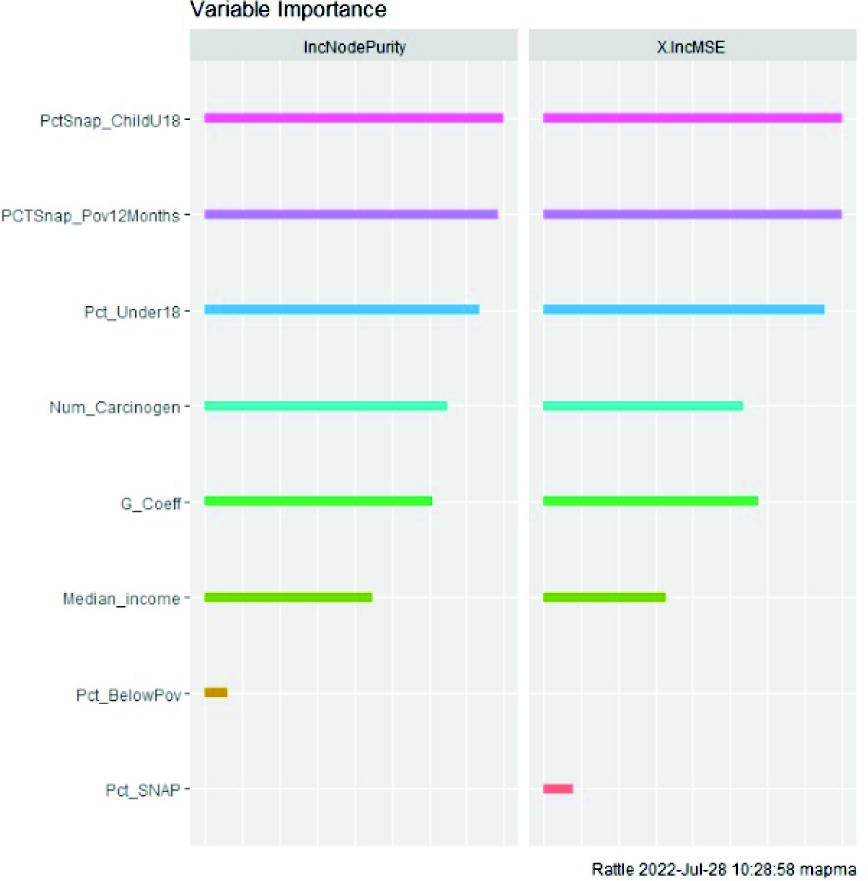
Variable importance for determining the percent of White population for a given congressional district.
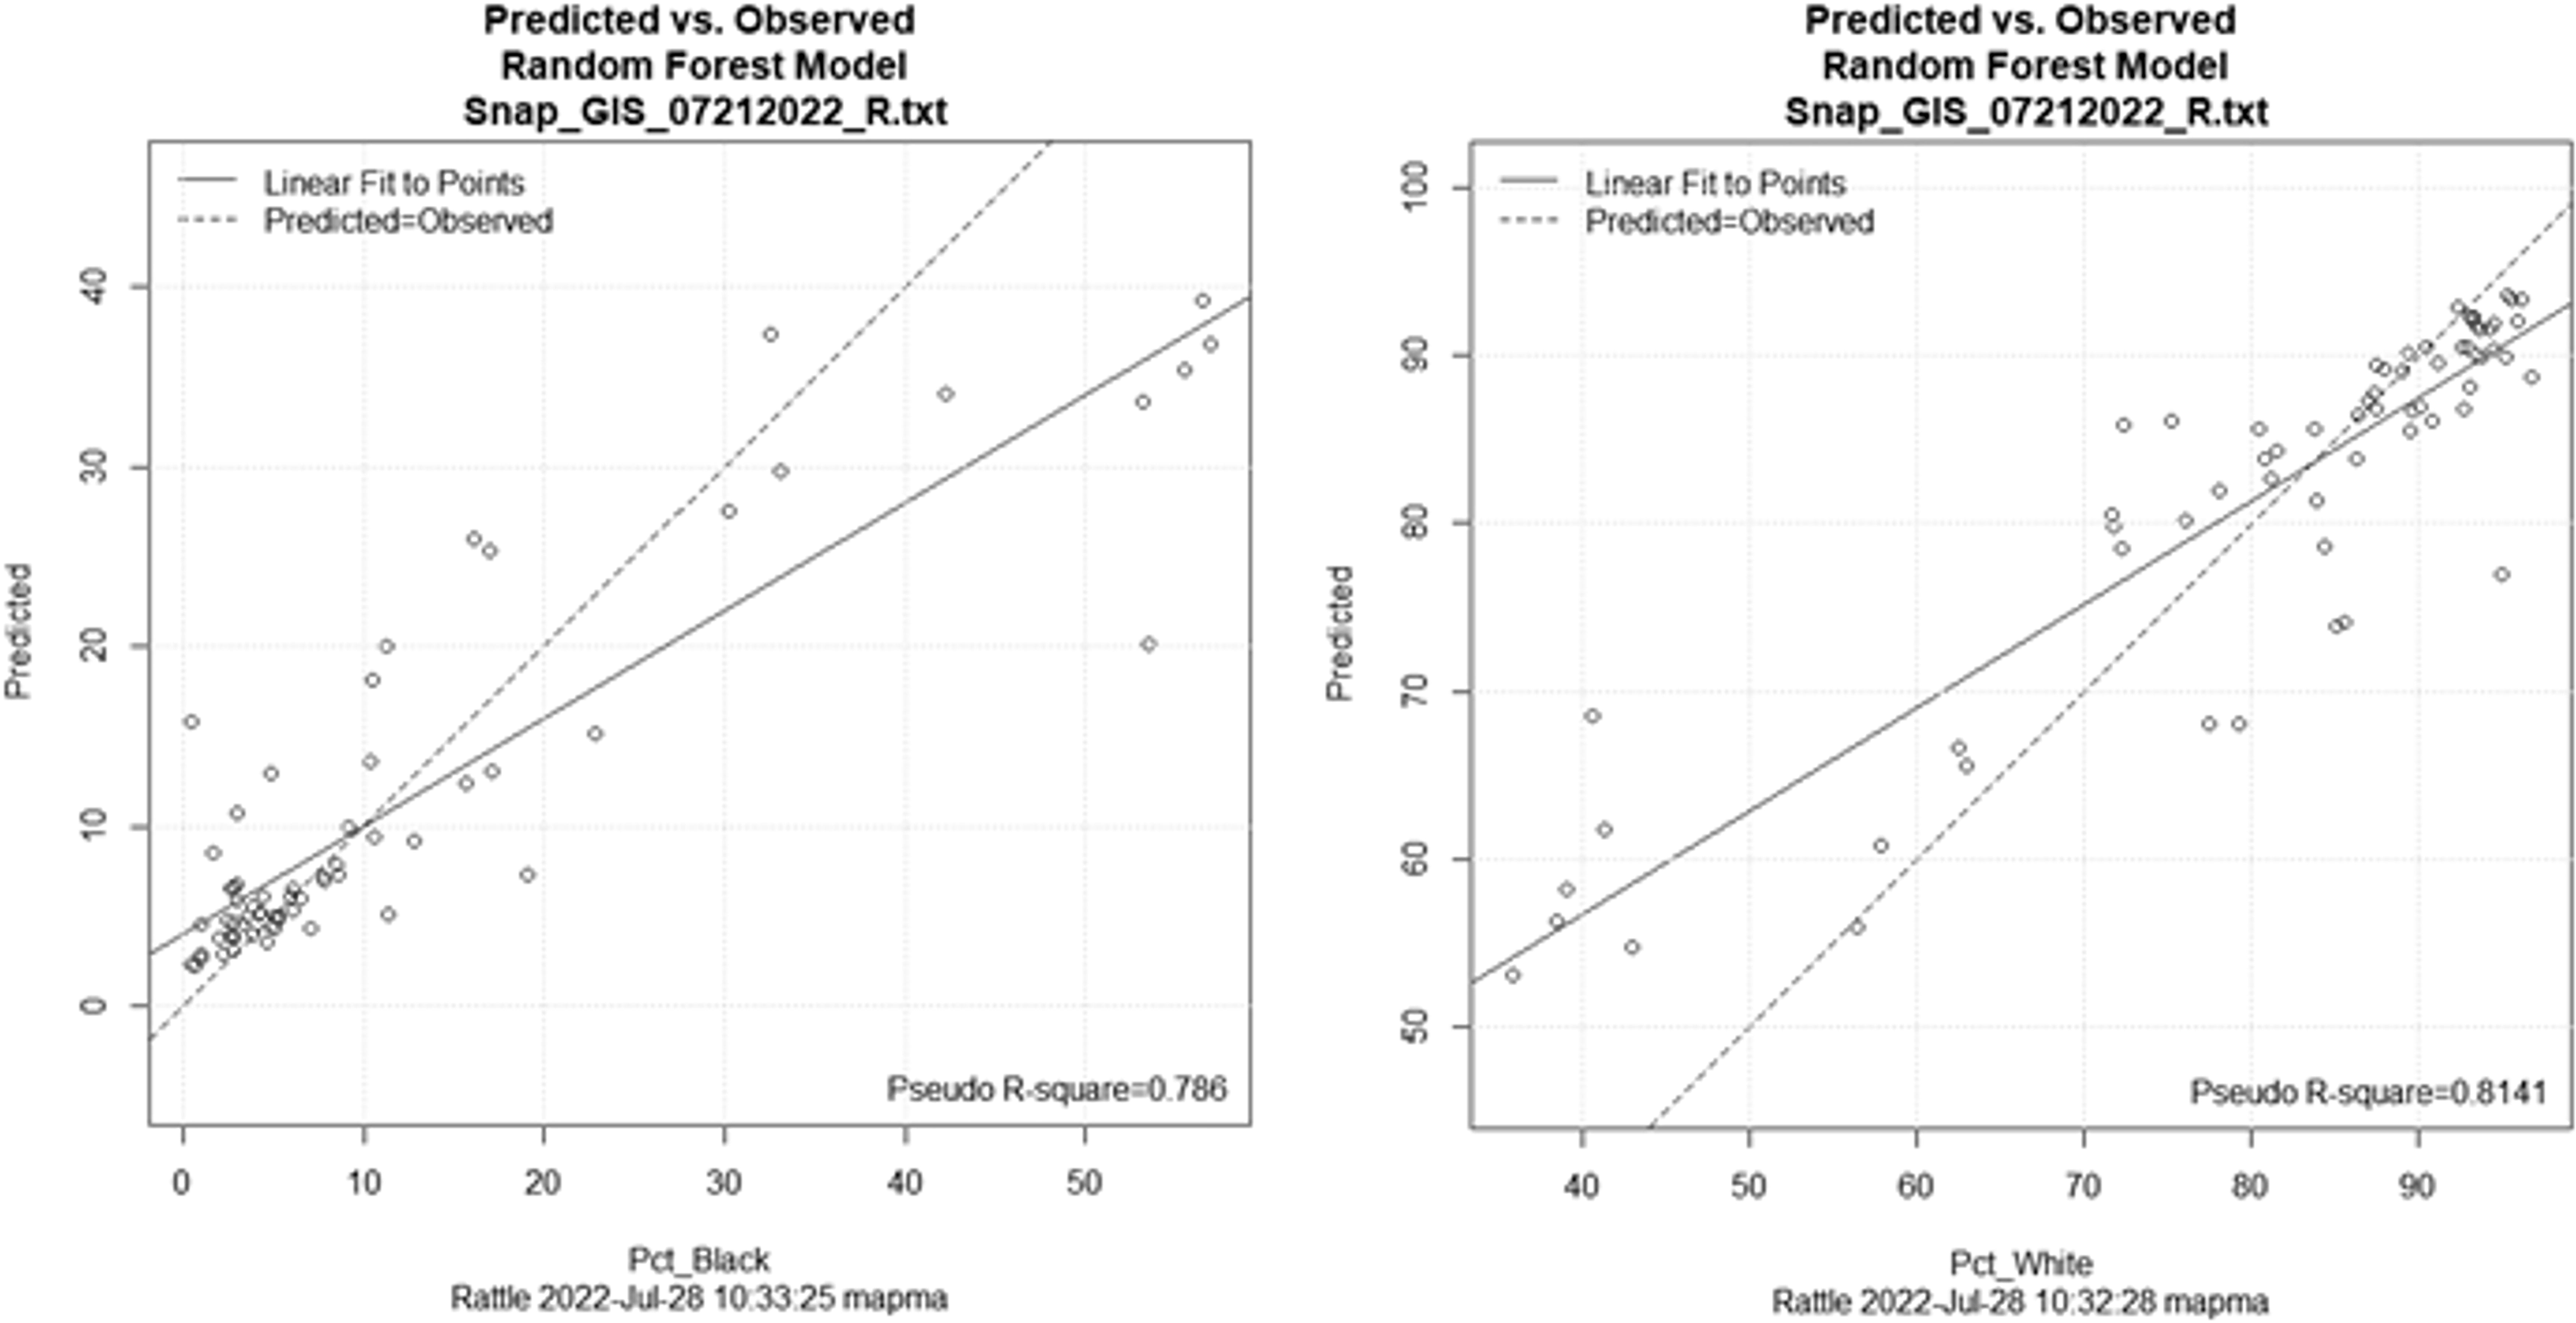
Predicted versus observed for Black/African American (left) and White (right). The inverse nature of the two plots is indicative of the influence that the independent variables exhibit over each of the dependent variables. In both cases, the pseudo-R2 values exhibit strong predictive capability suggesting that ∼79%–81% of the total variance is being explained by the models.
DISCUSSION
This research has further investigated the relationships between gerrymandering and SNAP distribution as it pertains to the locations of carcinogenic toxic waste facilities in the Midwest United States. Our findings indicate that gerrymandering, the presence and number of carcinogenic waste facilities, and SNAP distribution predict the percentage of Black people within a given congressional district, specifically within the following five-state rustbelt region: Ohio, Illinois, Michigan, Wisconsin, and Indiana. These findings provide further insight into environmental injustices that disproportionately impact Black people in the United States.
We further show that there is not one factor but rather multiple factors working to disenfranchise this population in various ways. This includes access to voting (gerrymandering) and access to quality food (SNAP), both of which can be construed as basic human rights that impact one’s physical and mental health. 31 Furthermore, it is important to note that Black people are disproportionately impacted by poverty 32 and are overrepresented in SNAP benefits relative to their composition of the U.S. population. 33 Moreover, studies have indicated that chronic diseases result from the impact of various factors, including diet, environmental agents, and genetics. 34 Examining the interrelationships between nutrition and environmental agents associated with toxic waste facilities and the proximal population is of particular interest. Researchers in the nutritional sciences, medicine, and environmental toxicology concluded in a 2005 workshop, “Nutrition and Environmental Toxicity,” that the interrelationships defined earlier should be further examined in future studies. 35 Given that Black families receive SNAP benefits at a heightened rate and are more likely to live near a toxic waste facility than their White counterparts, future studies should examine if such benefits are distributed equitably and if nutritional foods that can modulate the effects of environmental toxin exposure as a secondary intervention are accessible. 36 For example, several studies have found that foods rich in antioxidants, omega-3 and omega-6 fatty acids, and plant-derived flavonoids can aid in protection against persistent organic compounds such as polychlorinated biphenyls. 37 This is particularly important given that communities of color are more likely to live in a food desert. 38
Furthermore, Kramar et al. 39 found that predominantly White congressional districts are more likely to be gerrymandered than their Black counterparts; however, this study suggests that cities like Detroit (Michigan) and Chicago (Illinois) consist of predominantly Black congressional districts that are considered gerrymandered based on the associated gerrymandering coefficient. The question then becomes whether the gerrymandered nature is a result of the delineation of that district or the result of larger surrounding districts being gerrymandered and the compact ones simply sharing that boundary, resulting in a higher level of gerrymandering. Given that the literature has indicated that predominantly White congressional districts are more likely to be considered gerrymandered, it is likely that the high gerrymandering coefficient associated with predominantly Black congressional districts in this study is a result of the surrounding districts being heavily gerrymandered. This is a type of racial gerrymandering that results in majority–minority districts. In some cases, racial gerrymandering may positively impact Black populations, but in other cases, it can promote voter suppression. 40
CONCLUSION
In conclusion, further research that addresses inequities in policy is crucial to addressing the relationship between gerrymandering and SNAP benefits relative to proximity to toxic waste facilities by race. As a means to support Black populations within the five-state region of interest most impacted by this environmental injustice, we recommend implementing policy that is both reactive and preventative. Henderson and Wells assert that, in some cases, the environmental justice policy changes merely widen environmental inequities. 41 The policies referenced presented a pattern of “delayed responses, misinformation, weak enforcement of regulations, and inadequate solutions.” 42 Thus, we urge that policy aimed at addressing the environmental injustices presented in this article to be intentional in avoiding the oversights of their predecessors. Finally, this literature recommends collaborative work to identify the best solutions.43,44,45 This includes the communities most impacted, namely Black communities, and local grassroots organizations. In fact, in 1991, the First National People of Color Environmental Leadership Summit was held, in which participants created a detailed list of principles that they recommend to reference when addressing environmental injustices. 46
It is important to note that there are certain limitations that should be further investigated in future work. We specifically look at Black communities rather than all communities of color. As such, results from this study should not be extrapolated to assume similar racial inequities regarding different minority populations without further investigation. Furthermore, it can often be difficult to determine which district was gerrymandered to achieve a particular result. It is important to note that those districts could have been intentionally gerrymandered, given the racial makeup and compact nature of high population districts in urban areas. Regardless, the effect of gerrymandering is quite evident with regard to social and environmental justice.
Footnotes
ACKNOWLEDGMENTS
The authors would like to thank the reviewers for extensive editorial recommendations. We would also like to thanks all of our friends and colleagues that provided modeling insights, variable suggestions, and general support through the duration of this project.
AUTHORS’ CONTRIBUTIONS
D.K. was responsible for the analysis portion of this article and extensive writing, editing, and formatting. T.M.P. was responsible for extensive writing and editing of the article. K.S. provided extensive review and editing throughout the duration of the research project.
AUTHOR DISCLOSURE STATEMENT
The authors have no conflicts of interest as pertaining to this research.
FUNDING INFORMATION
No funding was received for this project.