
Abstract
The study investigates the intersectionality between underutilized, contaminated land and environmental justice (EJ) focusing on funding allocations for environmental cleanup of brownfield sites by the United States Environmental Protection Agency (U.S. EPA) Brownfields Program in the fiscal year 2023. The study analyzes grant applications submitted by Massachusetts municipalities and non-profit organizations to reveal EJ concerns, as perceived by brownfields practitioners. A systematic content analysis of practitioner knowledge and awareness of EJ issues was conducted and cross-referenced with disadvantaged communities as designated by the Climate and Economic Justice Screening Tool, the EPA Inflation Reduction Act, and the state-designated EJ populations. By comparing the concerns highlighted in the applications with those identified by the federal and state tools, this study showcases discrepancies between federal and state designations and perceived concerns of the communities. However, these discrepancies did not impact funding allocations, aligning with the findings of the EPA’s Brownfields Program audit conducted in September 2024. Addressing displacement concerns and lack of proactive planning to resolve EJ issues in general are some of the main topics where knowledge gaps exist. The results of the research reveal significant insights and highlight the need for additional research and technical assistance support to address the needs of vulnerable populations.
INTRODUCTION
Brownfields are vacant or underutilized properties where the process of redevelopment or repurposing is complicated by existing or suspected hazardous materials or pollutants. 1 As remnants of the industrial past, these sites often sit idle due to the high costs and complexities associated with their assessment, cleanup, and redevelopment. Brownfield sites differ from Superfund National Priorities List (NPL) sites, which are highly contaminated locations requiring long-term remedial action, regulated under the Comprehensive Environmental Response, Compensation, and Liability Act. Brownfield sites are smaller in scale compared with NPL sites, and a liable party for the contamination may or may not be identified. A typical brownfield site is often described as an “orphan” where no existing party is liable for the contamination, making it eligible for public funding under the Environmental Protection Agency’s (EPA’s) program. In addition to brownfields and NPL sites, grayfields are underutilized properties where contamination is not a concern, but redevelopment is hindered by economic or infrastructure-related barriers. 2 Brownfield sites are directly linked to environmental injustice issues as these sites are often located in poor neighborhoods that disproportionately affect low-income communities and communities of color, exacerbating existing inequalities.3,4,5,6,7,8,9,10,11,12 The cleanup and redevelopment of brownfields in these areas is critical for promoting equitable access to a cleaner, safer, and healthier environment.
Since the Small Business Liability Relief and Brownfields Revitalization Act in 2002, EPA’s Brownfields Program has provided various opportunities for funding and assistance to assess and cleanup brownfield sites. To date, Massachusetts has received over $130 million in federal Brownfields Program funding, representing 5.9% of all funding awarded nationwide. 13 Given that these grants are competitive, a set of criteria are used to score the applications based on the community’s need, the description of revitalization plans, budget, and scope of the work. In recent years, the program has integrated environmental justice (EJ) as a way to focus on projects that would alleviate injustices and prioritize disadvantaged and underserved communities. 14 Another important consideration, which is acknowledged by the agency, is the potential risk of neighborhood change that can trigger gentrification processes when there is significant public and private investment toward infrastructure upgrades. This process can potentially perpetuate the displacement of vulnerable populations in the area. Anti-displacement policies such as tenant protection policies, affordable housing, and community ownership models should be considered to prevent involuntary displacement in areas of high risk.15,16,17,18
EJ, broadly defined as “the just treatment and meaningful involvement of all people, regardless of income, race, color, national origin, Tribal affiliation, or disability, in agency decision-making and other federal activities that affect human health and the environment” is currently at the forefront of federal and state agencies including the U.S. EPA. 19 Since the Warren County protests,20,21,22,23,24 the EJ movement continued to grow in the 90s with the First National People of Color Environmental Leadership Summit, and President Clinton’s Executive Order 12898 in 1994 that required federal agencies to address adverse impacts on minority and low-income populations and create a plan to implement EJ policies. 25 EJ goals were then integrated into policies such as the National Environmental Policy Act that mandated the assessment of environmental effects of proposed actions. 26 More recently, President Biden’s Executive Orders 14096 and 14008 emphasized the commitment to EJ for all and provided an action plan to tackle the climate crisis at home and abroad. As part of EO 14008, the Justice40 Initiative stated that 40% of the overall benefits from federal investments should go toward communities historically marginalized and overburdened by pollution and underinvestment. 27
With the primary goal to incentivize public investment in underserved communities, several federal and state EJ designations and mapping screening tools have emerged. EPA’s EJScreen tool identifies areas with higher levels of environmental and public health burdens and at-risk populations. A total of 13 EJ indexes are combining environmental indicators with the demographic index, which includes the percentages of low-income and minority residents located within the same geographic unit. EJScreen’s environmental indicators include particulate matter 2.5, ozone, nitrogen dioxide, diesel particulate matter, toxic releases to air, traffic proximity, lead paint, superfund proximity, risk management plan facility proximity, hazardous waste proximity, underground storage tanks, wastewater discharge, and drinking water non-compliance. 28
The Climate and Economic Justice Screening Tool (CEJST) was more recently created to primarily locate areas that would benefit from the Justice40 Initiative. CEJST encompasses parameters including climate change, energy, health, housing, legacy pollution, transportation, water and wastewater, and workforce development at a census tract level. These categories are divided into subcategories and characterized by specific cutoff thresholds. Communities are classified as disadvantaged if located in a census tract that meets or exceeds the threshold for one or more environmental, climate, or other EJ burdens and an associated socioeconomic variable, such as low income and people aged 25 or older with less than a high school diploma.
CEJST also recognizes areas within Federally Recognized Tribes as disadvantaged, as well as census tracts surrounded by disadvantaged communities and with a low-income percentage at or above 50%.29,30 It should be noted that CEJST does not include race as one of the socioeconomic variables, which has previously received criticism. 31 Race/ethnicity has been proven to be one of the most important factors associated with environmental burdens. 32 A more inclusive definition of disadvantaged communities under the EPA Inflation Reduction Act (IRA) combines the disadvantaged census tracts designated by CEJST with census block groups that are at or above the 90th percentile for any of EJScreen’s supplemental indexes, and/or located in a geographic area within Tribal Lands. 33 Given the broad scope of EJ definitions, many communities qualify under at least one designation, though the criteria vary slightly across federal and state tools, leading to the potential for differences in classification. These federal tools were crucial in identifying EJ issues but have since been taken down. To continue this type of analysis, scholars and practitioners can also explore state-specific EJ mapping tools and publicly available datasets provided by the Census Bureau as alternative sources for EJ assessments In addition, other platforms (i.e., PolicyMap) could allow users to analyze, overlay, and visualize various datasets related to demographics, housing, health, the environment, the economy, and education at multiple geographic scales. Some of these tools may require a subscription, which may limit accessibility for some users.
Several state tools have been developed in recent years to capture EJ populations and cumulative health impacts in local communities.34,35,36,37,38 As more states adopt and refine these tools, they can help improve data accessibility and provide valuable insights into EJ concerns at the regional level. In Massachusetts, the Executive Office of Energy and Environmental Affairs has created an interactive map to indicate EJ populations. 39 According to the state designation, an EJ population is defined by criteria including an annual median household income at 65% or less of the statewide median, a population where 40% or more are minorities, or 25% or more of households identify as speaking English less than “very well.” Additionally, a neighborhood qualifies if minorities make up 25% or more of the population and the annual median household income of the municipality in which the neighborhood is located does not exceed 150% of the statewide median. 40
In this study, we examined previously submitted EPA Brownfields grant applications through systematic content analysis, using a dataset compiled in September 2024. We assessed EJ concerns raised in these applications with the main objective of investigating the intersection of EJ with brownfields redevelopment and highlighting discrepancies between federal and state designations. Lived experiences of community members as reflected in some of the applications were also taken into consideration; however, we acknowledge that genuine community engagement is often lacking to capture how communities experience these burdens. The main objective of the study is to provide insights of criteria for funding allocations to EJ communities and identify strategies to better address local EJ needs.
METHODOLOGY
The study focused on previously submitted EPA Brownfields Program grant applications by Massachusetts municipalities and non-profits during the fiscal year 2023. The applications are typically publicly available on the EPA’s website during a 3-month period after the award announcement. The Brownfields Program offers different types of grants depending on the stage of the environmental due diligence and includes assessment (community-wide and coalition), cleanup, multipurpose, and revolving loan fund grants. Community-wide assessment grants are aimed at sites in the initial steps of environmental investigation and pre-remedial planning. This type of grant allows applicants to request up to $500,000 to assess brownfield sites contaminated by pollutants including hazardous substances and/or petroleum, targeting multiple sites within their community. Cleanup grants are geared toward communities that have already assessed their brownfield sites and are in the cleanup process. This grant allows applicants to request up to $500,000, $2,000,000, or $4,000,000 to conduct cleanup activities at one or more brownfield sites in the community. 41 Our dataset included 21 grant applications from MA, with 15 community-wide assessment grants and 6 cleanup grants.
As part of the grant narrative, applicants are requested to describe the extent to which the EJ issues disproportionately affect underserved populations in the target areas by providing data that demonstrates the threats posed to sensitive populations. Typically, this evidence is disseminated by demographic data for vulnerable populations such as seniors, children, and people of color, and additional socioeconomic indicators such as low-income and poverty levels, unemployment rates, linguistic isolation, and the percentage of the population with less than a high school education. While EJ considerations were taken into account in the review of the applications, the allocation of brownfields funding also considered additional factors including suitability of the site, programmatic capability, and other criteria demonstrating the need for the public investment. Greater than normal incidence of disease and adverse health conditions that may be associated with the exposure to environmental pollution are also included in the narrative such as asthma rates, cancer rates, and/or birth defects. All 21 grant applications included in the dataset highlighted at least one, and up to six, priority brownfield sites, with a total of 66 sites. The location of the 21 entities that applied for the funding and the 66 brownfield sites mentioned in the applications were mapped to visualize their geographic distribution (Fig. 1).
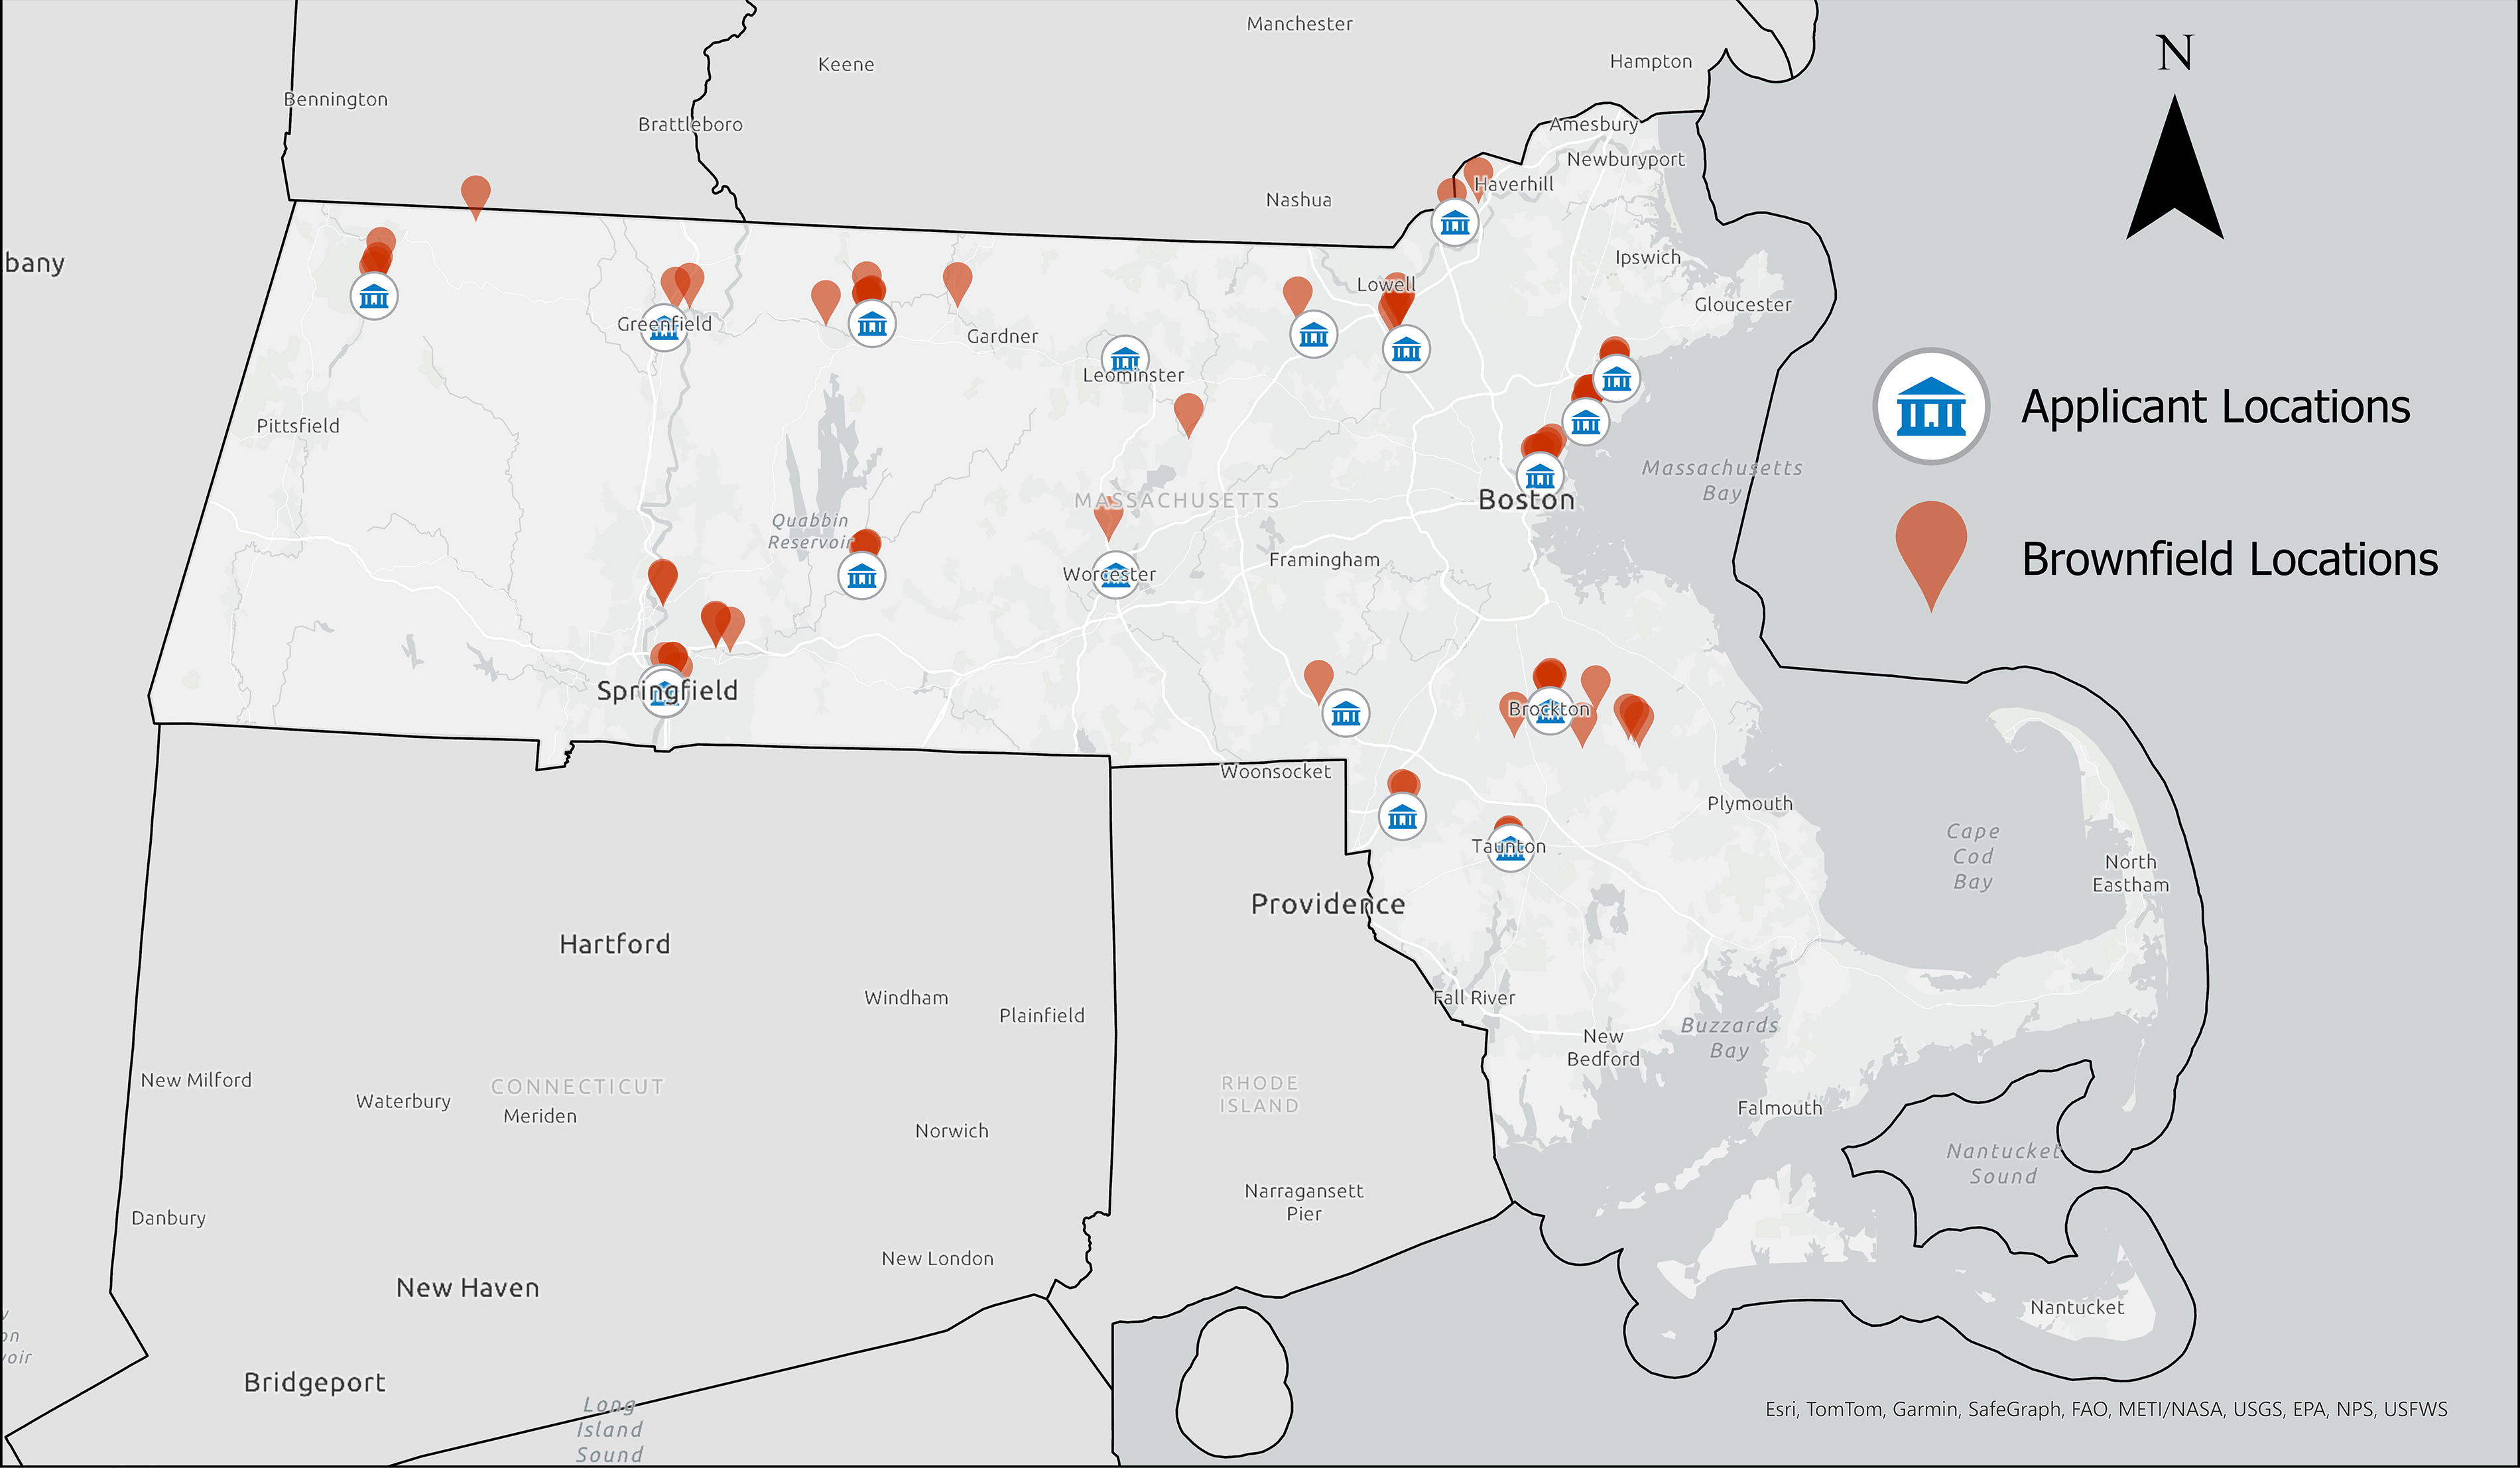
Distribution of applicant and brownfield site locations in Massachusetts from FY23 EPA Brownfields grant competition. EPA, Environmental Protection Agency.
The applications were categorized in terms of application type, funding selection, entity, and applicant location (Fig. 2). Out of the 21 applications, 15 applications were selected for funding totaling $9,240,000 in federal funds toward brownfields. This accounted for 4.0% of the total funding awarded nationwide for FY23. However, funding levels and program support vary significantly across states. Massachusetts has a significant number of brownfield sites and state initiatives that support brownfield redevelopment and EJ efforts. Differences in state policies, funding availability, and the role of EPA regional offices contribute to these variations, affecting how communities access brownfields resources.
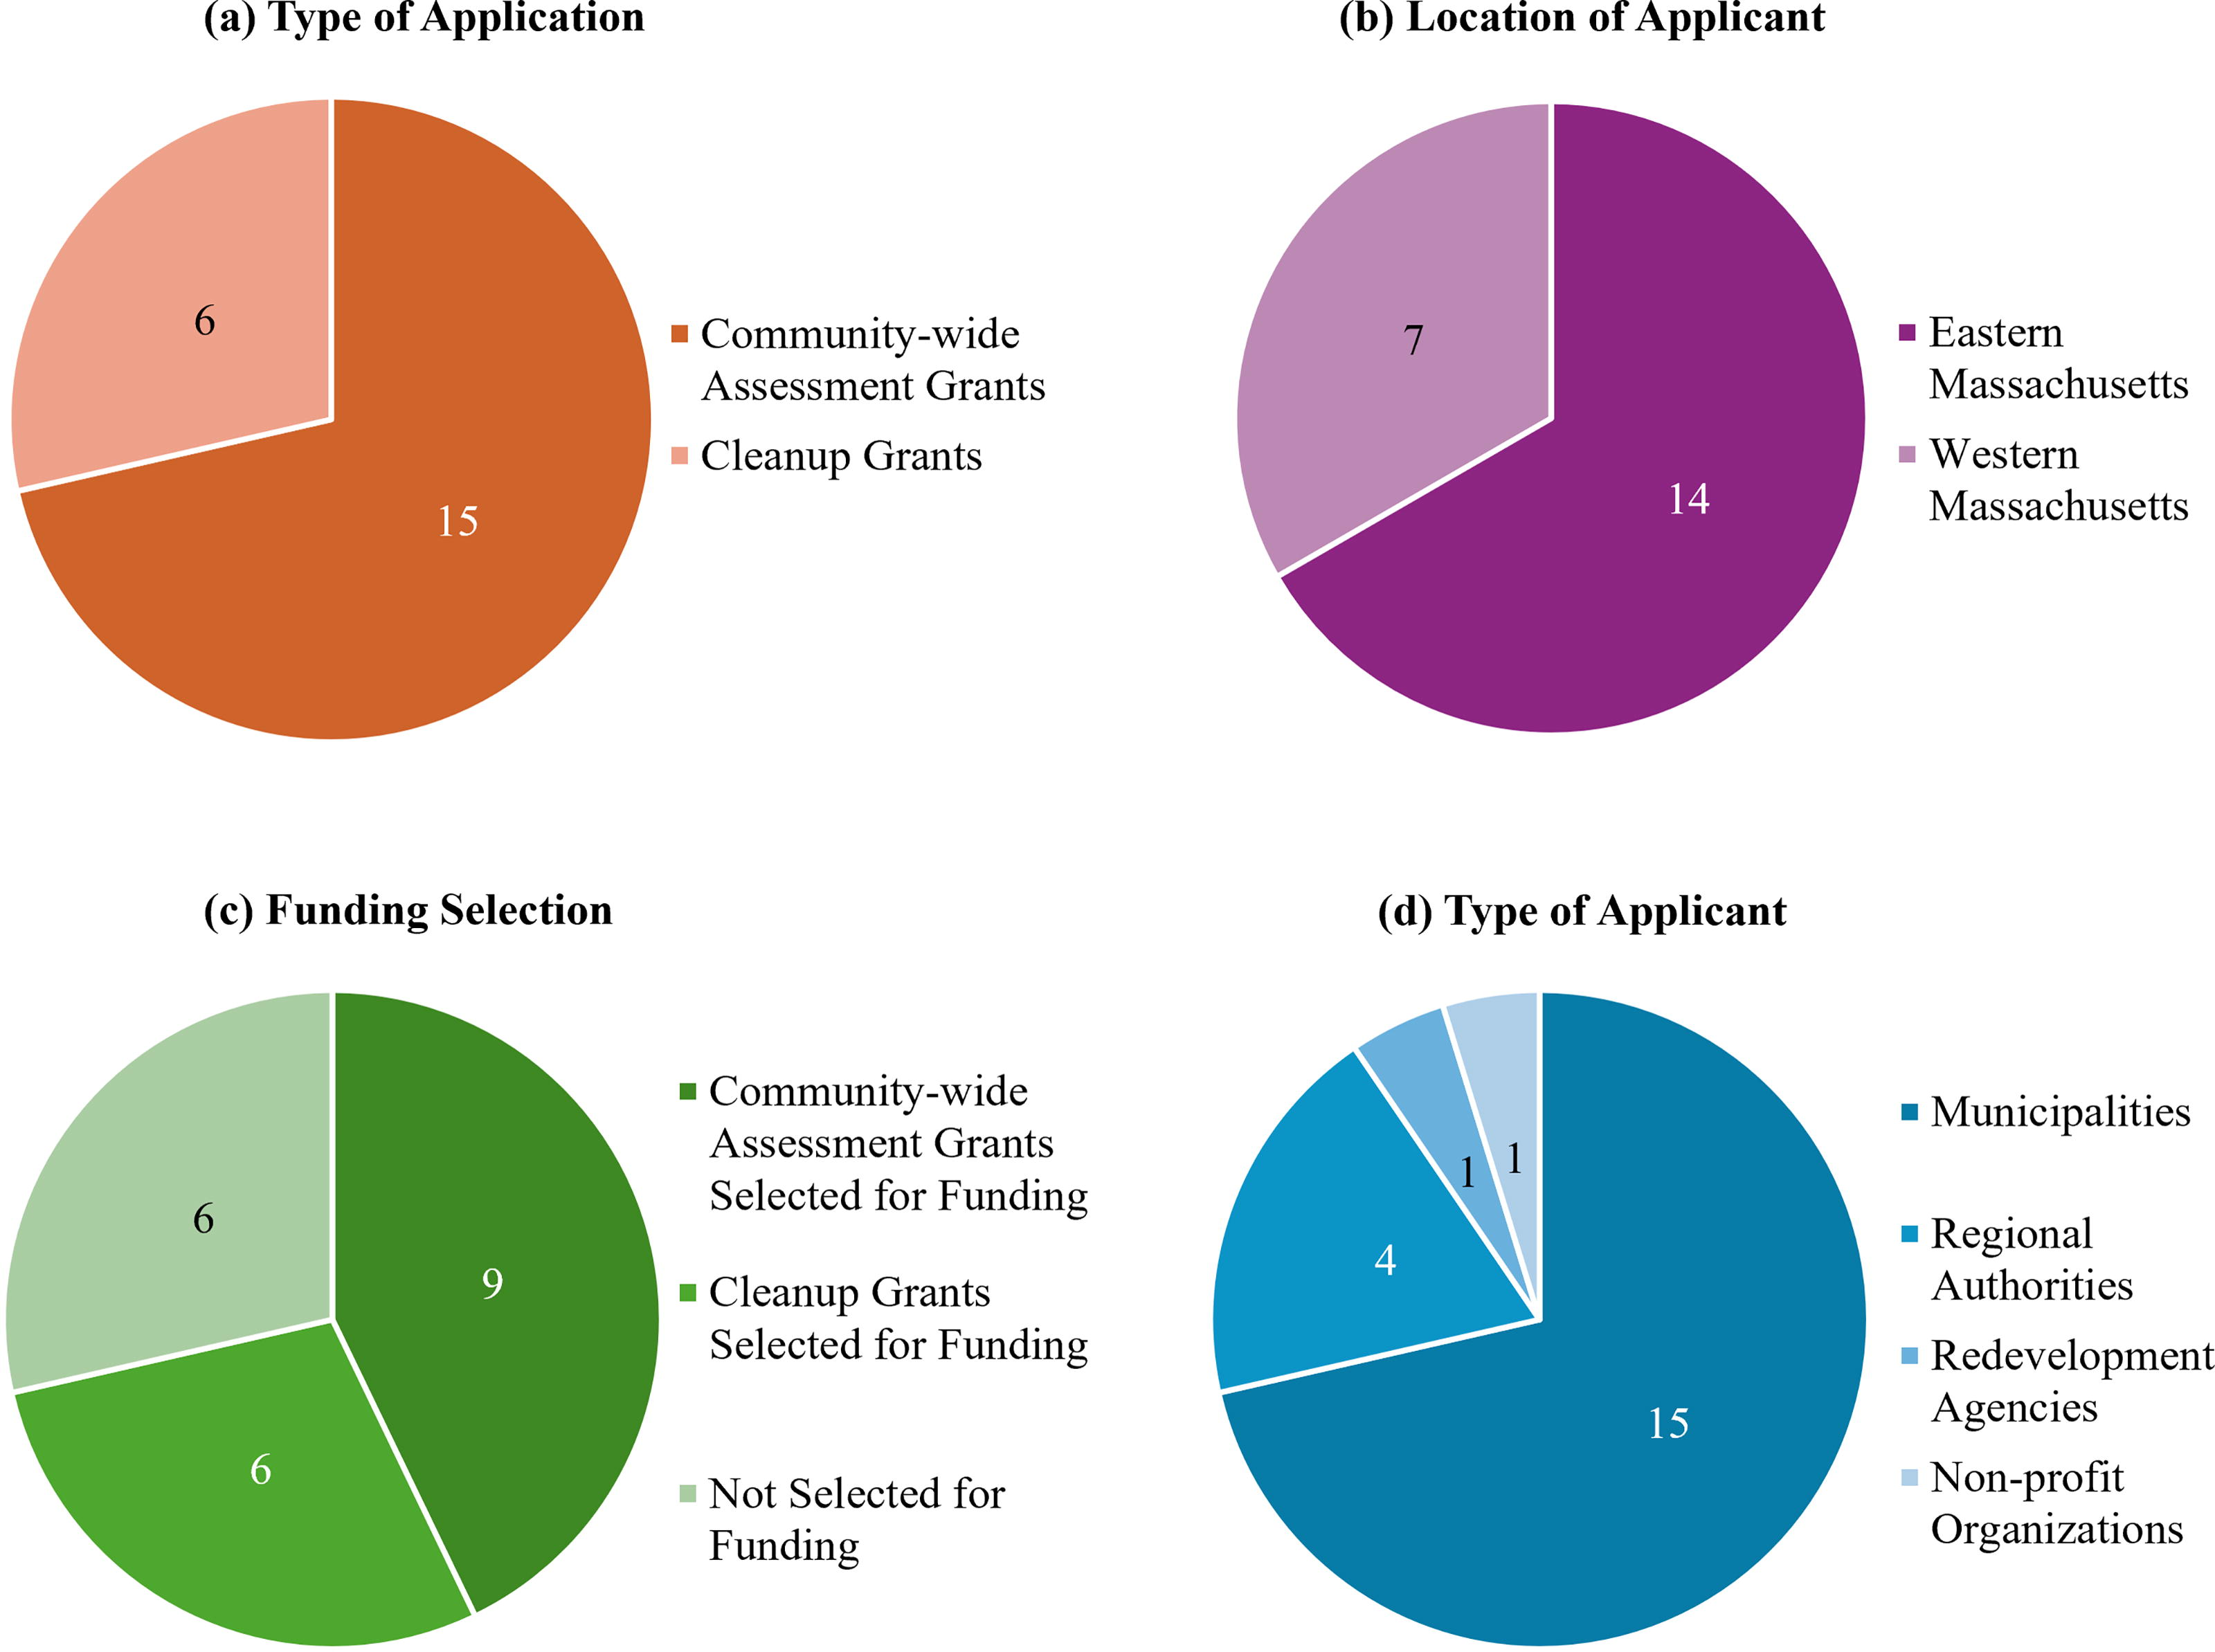
Results for breakdown of applications for the EPA Brownfields Program by type of application, location of applicant, type of applicant, and funding selection.
Most of the applications were submitted by towns and cities (15), some by regional authorities (4), and fewer by redevelopment agencies (1) and a non-profit organization (1). The analysis of the dataset focused mainly on cross-referencing the location of the brownfield sites with the EJ-designated areas in the federal and state levels, and EJ concerns reported both in the databases and in the application narratives. The location of each site was used to determine their corresponding census tract and block group, which are then used to determine specific EJ concerns using CEJST, EJScreen and the EPA IRA disadvantaged communities, and the MA EJ populations. The purpose of this quantitative and semi-qualitative analysis was to determine differences between EJ designations and implications for funding allocations and investigate EJ concerns that may not be captured by the federal and state designations.
RESULTS AND DISCUSSION
Out of the 66 brownfield sites, a total of 45 sites, or nearly 70%, that were prioritized in the EPA grant applications were in block groups considered EJ or disadvantaged by at least one screening tool (Table 1). Of the prioritized sites, 19 of them were designated as disadvantaged by CEJST. They were distributed across 12 different census tracts, leading to 28% of the funded census tracts having been designated as disadvantaged by CEJST. The 2022 audit conducted by the EPA Office of Inspector General found that approximately 60% of Brownfields Program benefits were expected to reach CEJST-designated census tracts nationwide. 42 Given that income percentiles (compared with the nation) were one of the main criteria for the CEJST disadvantaged designation, Massachusetts may have had fewer census tracts designated as disadvantaged compared with other states. The Commonwealth ranks among the top three states in median household income according to 2023 U.S. Census Bureau data, and hence, fewer tracts in the state met the threshold for the disadvantaged designation. However, other EJ definitions, including the state and EPA IRA, confirm site prioritization and funding allocations toward underserved communities.
Breakdown of Grant Applications, Funding, and Brownfield Sites in EJ Communities
Note that the community-wide assessment grant total amount awarded is composed of nine $500,000 awards, four cleanup grants of $500,000 awards, one $740,000, and one $2,000,000 award.
EJ, environmental justice.
For the applications that received funding, most of them had at least one site in an EJ community designated by at least one tool, with 73% of the funded applications prioritizing sites in EJ communities, which is an encouraging outcome for underserved communities. For the remaining 26% of the applications (four applications) that received funding and did not include sites in EJ communities, we further explored the main reasons for these allocations. However, it should be noted that all applications that did not receive funding also had at least one site in an EJ community. Although most of the applications that received funding prioritized underserved communities, EJ concerns were not the only drivers for funding allocations.
Additional parameters that are weighted equally or more during the scoring of the application seem to play a significant role in the selection process. One application had all their sites in EJ communities, yet still did not receive funding. Based on a thorough examination of the grant narrative, we concluded that the main reason for that was the lack of redevelopment plans for the target sites, failure to address potential displacement concerns in their EJ communities, omission of how they intended to incorporate input from community engagement, and the absence of a dedicated community liaison to facilitate engagement efforts. These are all significant and justifiable reasons for not allocating funds. This further highlights the need for technical assistance to better prepare communities to establish their brownfields programs and address these issues in EJ communities. Technical assistance must be tailored to the needs of each community to have a strong understanding of what the barriers are and be provided by a team of experts that have the expertise and real-world experience to be able to help others.
Furthermore, three applications received funding despite none of their sites being in EJ communities. Based on our analysis, this was attributed to their robust and detailed redevelopment plans for their target sites, methods for community engagement, coupled with their strong grant writing skills. This highlights that while prioritizing EJ communities is important, the comprehensive quality of the redevelopment strategy and addressing EJ concerns through community engagement and anti-displacement plans are also critical factors in securing funding. Another important finding through this analysis is an application that received funding and discussed EJ concerns experienced by the target areas, labeling them as “environmental justice communities,” despite none of their sites being in EJ communities designated by the state, EPA IRA, or CEJST. There were, however, several environmental and socioeconomic burdens in the area that the applicant had described in the application, but the sites were not flagged by the EJ databases. This indicates the importance of state and federal EJ screening tools capturing the full range of concerns experienced by communities to ensure all disadvantaged communities are recognized and local needs are reflected and met in environmental policy.
When further investigating the differences between EJ concerns as identified by the federal and state designations, 47 sites (or 71% of sites) showed consistency in their EJ designation, either designating communities as EJ or not (Fig. 3a). For the most part, there is consistency with regards to which communities are considered EJ by federal and state tools. However, there were several cases (19 sites or 29% of the sites) where the EJ designation did not match, and that was for various reasons. Of these 19 sites, most of them received funds (12 of them received funds and 7 of them did not), which implies that the mismatch in EJ definitions did not impact funding allocation for the majority of the sites.

Results of analysis for EJ designations across investigated communities based on federal and state EJ criteria.
Nine sites were designated as EJ populations only by the state of MA. Based on the most recent map update, Massachusetts has 2604 EJ-designated block groups (51% of total block groups in the Commonwealth). 43 Most of them (six sites) met the state minority threshold of having more than 40% or more minorities within the block group, while three met the income threshold with 65% or less of the statewide annual median household income (Fig. 3b). Since CEJST and EPA IRA do not explicitly include minority population criteria when designating disadvantaged communities, it is expected that the state designation captures additional minority communities that may be experiencing disproportionate burdens. The other three sites exceeded the 90th percentile in various categories such as climate change, energy, transportation, and housing, but were not identified as disadvantaged by the EPA IRA or CEJST because their low-income populations ranged from the 44th to 47th percentile compared with the nation, which is below CEJST’s threshold of 65th percentile for low-income populations. The main difference stems from the socioeconomic variables and thresholds included in federal tools compared with state tools. Specifically, the use of federal poverty levels versus the state median household income, as well as the inclusion of minorities in the state designation.
There are also three sites located in a community that were identified as disadvantaged by CEJST and the EPA IRA, but not the state (Fig. 3b). For one of these sites, under CEJST and the EPA IRA, the community met more than one burden threshold (climate change, housing, legacy pollution, transportation, and workforce development) while at the 86th percentile for low income. In addition, the community was also categorized as disadvantaged for workforce if it ranks above the 90th percentile for linguistic isolation, low median income, poverty, or unemployment, in addition to having high school educational attainment rates. Linguistic isolation measures the “share of households where no one over age 14 speaks English very well” and the low median income burden is the “comparison of median income in the tract to median incomes in the area.” 44 Even though the community met the federal thresholds, it was still not identified as an EJ population by the state. This finding reiterates the discrepancies between the state and federal designations of EJ communities as it relates to income, language isolation, and workforce development. In the other two sites, the community was in the 71st percentile for low income under the federal tools, but not flagged under the state.
There are two sites located in communities identified as EJ by the EPA IRA only; in these cases, it was because they are above the 90th percentile in at least one of EJScreen’s supplemental indexes. There were also five sites where the state and the EPA IRA designated an EJ community according to low-income or minority criteria while also being above the 90th percentile in at least one of the EJ Screen supplemental indexes. The supplemental indexes “combine data on percent low income, percent persons with disabilities, percent less than high school education, percent limited English speaking, and percent low life expectancy with a single environmental indicator.” 45
We further investigated the extent and type of disproportionate burdens as identified by CEJST (Table 2) to examine community needs and how these needs were addressed in the applications. In the communities that we were designated as disadvantaged, housing and workforce development are the most prominent issues across the Commonwealth. According to CEJST, a community is deemed disadvantaged for housing if it exceeds the 90th percentile for housing costs, lacks green space, lacks indoor plumbing, or has lead paint presence in addition to having a low-income population above the 65th percentile compared with the nation.
EJ Issues Identified in CEJST Disadvantaged Communities for the Total Number of Sites
Note that indicators are reported at the census tract level.
CEJST, Climate and Economic Justice Screening Tool.
Many of the housing issues identified in these communities relate to increased housing costs, with 16 out of the 24 sites having the “share of the households making less than 80% of the area median family income and spending more than 30% of income on housing.” 46 This issue is frequently recognized in many of the grant applications, with applicants proposing the construction of affordable housing as the main revitalization plan for the sites. Lead paint is identified as a significant concern in six sites/areas highlighted by EJScreen, but an additional six applications mention similar concerns about the presence of lead paint even when the areas were not flagged as disadvantaged. For most of the applications that got the funding, the lead paint indicator did not exceed the 90th percentile, and ranged from the 43rd to the 85th percentile with an average being at the 68th percentile. In the other instance where they did not get the funding, the threshold was exceeded in all household criteria (housing cost: 92nd, lack of green space: 94th, lack of indoor plumbing: 91st, lead paint: 95th) but not low income, and thus was not flagged as disadvantaged. Based on this analysis, there is some perceived risk at the community level that is not captured by the designations, which has also been discussed in previous studies.47,48
In communities where workforce development is the predominant issue, it was also reflected in the majority of the applications. Applicants were aware of their communities having high unemployment rates and wanted to implement workforce skills training and well-paying jobs after the redevelopment of the site. While they are acknowledging the higher unemployment rates, the vast majority of these communities also have high percentages of linguistic isolation. This is noteworthy because, despite the focus on job creation, linguistic barriers may prevent residents from securing higher-wage jobs. The applications often mention that their communities face language barriers and propose translation services at community engagement activities, which is an important approach to inclusion of diverse audiences. There is, however, a need for additional plans to reduce linguistic isolation to enable community members to find higher wage jobs.49,50,51 An equally important consideration as suggested by one of the applications, is to promote more Spanish language business owners that could provide employment opportunities for linguistically isolated individuals.
Applications that did not have EJ communities focused mostly on unemployment rates and vulnerable populations such as children under 5 years old, the elderly, the disabled, civilian veterans, and residents without health insurance coverage. Other concerns not encompassed by the tools include the percentage of cost-burdened households and the increased wait time for housing for elderly, veterans, and low-income residents. They also brought up additional concerns related to various indicators, such as low income (70th–89th percentiles), unemployment (50th–89th percentiles), traffic proximity (70th–95th percentiles), lead paint prevalence (80th–95th percentiles), superfund proximity (60th–80th percentiles), and high school education (68th–81st percentiles) even if the community was not designated as EJ. A summary of the EJ issues identified by the state of Massachusetts, based on the MA 2020 EJ populations map is provided, with minority and income being the most prominent issues in communities identified as EJ populations (Table 3).
EJ Issues Identified by the Massachusetts 2020 Environmental Justice Population Map
Note that indicators are reported for each census block group. A total of 40 sites are designated as EJ by the Commonwealth of MA. (A community is labeled as an EJ population under the minority criteria if 40% or more of the census block group’s population are minorities. A community is labeled as an EJ population under the income criteria if the annual median household income of the block group is 65% or less of the statewide median. English isolation is less prominent of an issue, but still notable. A community is labeled as an EJ population under the English isolation criteria if 25% or more of the households within the block group identify as speaking English less than “very well.”)
“Environmental Justice Populations in Massachusetts | Mass.Gov.”
The criteria used to identify EJ communities by the state were widely discussed by applicants. Out of the 21 applications investigated, 18 of them mentioned low income, 10 mentioned minorities, and 13 of them mentioned limited English proficiency/linguistic isolation as areas with vulnerable populations. Many of the applications referencing low income as a concern discussed their community’s median household income and compared it with that of the state or country. Others discussed per capita income in the same manner, as well as poverty levels or the percentage or percentile compared with either the state or country as stated by EJScreen. In the applications that included minority populations as an indicator of vulnerability, they mention the percentage of their population that are people of color or Hispanic and/or Latino. The applicants discuss how these low-income, minority, and linguistically isolated communities are more vulnerable to health and socioeconomic threats posed by environmental concerns.
When examining the applications through the lens of potential risks of displacement, it was found that 14 out of the applications acknowledged displacement risks, while 7 did not. Of the 14 that addressed displacement, 6 applications mentioned that the redevelopment will not cause displacement because the brownfield sites are vacant and there are no residents residing at the site. This is a common misconception, which highlights the lack of awareness on gentrification and displacement topics at the practitioner level. In many cases, infrastructure upgrades and significant investments can lead to gentrification, which can perpetuate indirect forms of displacement in communities with vulnerable populations52,53 Additionally, five applications acknowledged the possibility of displacement, despite not expecting it, and indicated they have plans or can create plans to mitigate it. Anti-displacement policies such as tenant protection and community benefit agreements are some of the potential solutions to help prevent displacement in brownfields and EJ communities. Two applications, from the same town, recognized that indirect displacement could occur, even though they do not anticipate it. One applicant took a proactive approach by outlining policies and programs to minimize displacement, a critical step for communities seeking to protect residents in brownfield areas. There were only a handful of applications where municipal officials recognized the risks of displacement and had a plan to address those risks in their brownfields programs. To fulfill this need, the Brownfields Revitalization Anti-Displacement Strategies program was created out of the University of Massachusetts Dartmouth in collaboration with the University of Louisville and Florida State University to address those needs in communities nationwide through research and technical assistance. The program operates at the intersection of academic expertise and practitioner knowledge to help communities understand the convoluted topics of gentrification and displacement while advancing their anti-displacement strategies.
One component that is, however, not captured in this analysis is the true lived experiences of community members. We observe that for most of the applications, there is an agreement between the issues identified by the databases and the issue the municipal officials discuss in the applications. It is unknown whether community concerns were excluded from the narratives due to the absence of additional issues or the lack of engagement and development of trustful relationships with community members.
While EJ concerns were discussed in many applications, genuine community engagement is often limited. However, direct outreach to affected communities remains essential throughout project implementation. Meaningful engagement not only ensures that brownfields redevelopment aligns with community priorities but also builds trust, fosters transparency, and provides an opportunity to address concerns such as displacement risks, health impacts, and economic benefits. Strengthening community involvement in brownfields projects can lead to more equitable and sustainable redevelopment outcomes.
CONCLUSION
The study explores the connections between brownfield sites and EJ, investigating federal and state EJ policies and community perceptions as reflected in brownfield grant narratives. We analyzed EJ concerns discussed in 21 grant applications submitted to the EPA Brownfields Program in the fiscal year 2023 by MA municipalities and non-profits. Within the 21 applications, 66 priority brownfield sites were identified for which the EJ status of each was determined using three different designation tools: CEJST under the Justice40 Initiative, the EPA IRA using EJScreen, and the MA 2020 EJ populations map. Out of the 66 sites, 45 were in block groups considered EJ disadvantaged by at least one screening tool, with most applications funded to have at least one site in an EJ community. The three EJ designations agreed for 71% of the sites, with 39% labeled as disadvantaged by all three tools and 32% not labeled as disadvantaged by all three tools. The three EJ designations did not agree for the remaining 29% of the sites, with 14% only recognized by the state of Massachusetts, 7% recognized by the state and the EPA IRA, 5% recognized by CEJST and the EPA IRA, and 3% only recognized by the EPA IRA as disadvantaged. These findings reflect similarities and discrepancies within the three screening tools, which, however, do not impact the funding allocations toward EJ communities.
The major EJ concerns identified by the screening tools and discussed in the applications included housing, workforce development, minority and low-income populations. One of the main findings of the study is a lack of preparation and planning to address EJ issues including displacement risks of vulnerable groups and businesses located near brownfield sites. Another finding of this study is the necessity to deeper understand the needs of the community through genuine community engagement, which may be limited in many communities. Although some applicants acknowledged the potential for displacement, many did not fully address how redevelopment would indirectly contribute to it, highlighting the need for greater education, proactive planning, and technical assistance.
Footnotes
AUTHORS’ CONTRIBUTIONS
O.S.: Conceptualization, methodology, formal analysis, writing—original draft, writing—review and editing, and visualization. M.G.: Conceptualization, methodology, formal analysis, writing—original draft, and writing—review and editing. N.B.: Conceptualization, methodology, writing—review and editing, supervision, project administration, and funding acquisition.
DISCLAIMER
The content is solely the responsibility of the authors and does not necessarily represent the official views of the Environmental Protection Agency.
AUTHORS DISCLOSURE STATEMENT
No competing financial interests exist.
FUNDING INFORMATION
Funding for this research was provided by the U.S. Environmental Protection Agency “Minimizing Displacement Resulting from Brownfields Assessment, Cleanup, and Redevelopment,” Award Number: 84074501.