
Abstract
The existence of two separate genetic lineages of Escherichia coli O157:H7 has previously been reported, and research indicates that lineage I could be more pathogenic toward human hosts than lineage II. We have previously shown that lineage I as a group expresses higher levels of Shiga toxin 2 (Stx2) than lineage II. To help evaluate why lineage II strains do not express appreciable levels of this toxin, whole-genome microarrays were performed using Agilent custom microarrays. Gene expression of the two representative bovine lineage II strains (FRIK966 and FRIK2000) were compared with gene expression of E. coli O157:H7 EDL933 (lineage I clinical type strain). Missing or differentially expressed genes and pathways were identified. Quantitative reverse transcription–polymerase chain reaction was performed to validate the microarray data. Draft genomes of FRIK966 and FRIK2000 were sequenced using Roche Applied Science/454 GS-FLX technology shotgun and paired-end approaches followed by de novo assembly. These assemblies were compared with the lineage I genome sequences from E. coli O157:H7 EDL933. The bacteriophage 933W, which encodes the Stx2 genes, showed a notable repression in gene expression. Polymerase chain reaction primers, based upon EDL933 genomic information, were also designed against all of the potentially missing genes of this bacteriophage. Most of the structural genes associated with the bacteriophage were found to be absent from the genome of the two bovine strains. These analyses, combined with evaluation of the genomic information, suggest that transposon (IS629) rearrangements may be associated with disruption of the bacteriophage genome in the FRIK strains. The results support the hypothesis that lineage II strains may be less of a risk as human foodborne pathogens. The microarray and genome data have been made available to the scientific community to allow continuing analysis of these cattle-isolated lineage II genomes and their gene expression.
Introduction
Stx2 is composed of a single enzymatic A subunit and five smaller receptor-binding B subunits (Donohue-Rolfe et al., 1984, 1989; Jacewicz et al., 1986; Waddell et al., 1988; Muhldorfer et al., 1996). The genes encoding Stx2 are thought to be located solely within lamdoid-like prophage, and these phages are all thought to share similar genome organization and regulation (O'Brien et al., 1984; Huang et al., 1986; Datz et al., 1996; Karch et al., 1999; Unkmeir and Schmidt, 2000; Johansen et al., 2001). Stx2 production is tied to regulation of the phage lifecycle. Transcription of stx2 genes are believed to be a result of phage induction through activation of the inducible DNA repair system, the bacterial SOS response (Tyler et al., 2004). Although there is pathogenic potential for E. coli O157:H7, which do not express or encode Stx2, epidemiological analyses have correlated increased disease potential with E. coli strains that do express the stx2 gene and its toxin (Boerlin et al., 1999; Donohue-Rolfe et al., 2000).
Previously, octamer-based genome scanning of EHEC serotype O157:H7 strains revealed the potential existence of two genetically distinct lineages, which grouped primarily bovine strains into lineage II, whereas human clinical strains fell into lineage I (Kim et al., 1999). Subsequent research has supported the concept that lineage II strains may be less pathogenic or have less potential for transmission to humans (Dowd and Ishizaki, 2006). Two E. coli O157:H7 lineage II strains originally isolated from cattle were chosen for the current study. The purpose of this study was to generate draft genomes of two bovine lineage II strains and compare this draft assembly with two lineage I clinical strains, namely, E. coli O157:H7 EDL933 (Perna et al., 2001) and E. coli O157:H7 Sakai (Hayashi et al., 2001). We also used whole-genome microarrays, quantitative reverse transcription–polymerase chain reaction (qRT-PCR), and PCR-based screening for potentially missing genes, to compare the genomes. These analyses provided more detailed information on those changes that might differentiate lineage I from lineage II. More specifically, we were interested in investigating why these two bovine strains, FRIK966 and FRIK2000, which are PCR positive for stx2, do not express this toxin in notable quantities (Dowd and Williams, 2008). We hypothesized that genome plasticity and disruption of the shiga-toxin-encoding bacteriophage have rendered these strains without an effective expression system for the toxin.
Materials and Methods
Bacterial strains
Two lineage II strains of E. coli O157:H7, designated FRIK2000 and FRIK966, originally isolated by Charles Kasper (University of Wisconsin) and generously provided by Andrew Benson (University of Nebraska), were used in this study. Lineage II strains have been submitted to the American Type Culture Collection (ATCC, Manassas, VA). Lineage I strains were acquired from ATCC. E. coli O157:H7 FRIK966 (ATCC BAA-1882), E. coli O157:H7 FRIK2000 (ATCC BAA-1883), E. coli O157:H7 EDL933 (ATCC 43895), and E. coli O157:H7 Sakai (ATCC BAA-460) were grown in the tryptic soy broth (TSB; Sigma Chemical, St. Louis, MO) medium at 37°C for 16 hours.
Microarray design
Based upon the transcriptome of E. coli O157:H7 EDL933, an oligonucleotide microarray made up of 60 mers was designed with a total of 4873 unique genes in an 8 × 15K format. Gene-specific oligos were designed using a custom script, based upon various design characteristics, such as melting temperature, 3′ location, specificity, and lack of repeat nucleotides (Charbonnier et al., 2005). Arrays were manufactured using Agilent Sure-print technology. Each array consisted of duplicate elements for each gene randomly distributed with Agilent control elements. The array platform and associated data have been submitted to NCBI GEO under accession GPL8845.
Microarray protocol
All procedures were performed according to respective manufacturer's protocols. Lineage I and lineage II strains were grown overnight as described; a total of 107 cells were washed twice in fresh TSB, normalized based upon optical density (OD), inoculated into fresh TSB, incubated at 37°C, shaked 120 g for 3 hours, and then suspended in RNAprotect bacteria reagent (Qiagen, Valencia, CA.). Total RNA was extracted using RNeasy Bacteria Mini Kit (Qiagen), and trace amounts of DNA were removed using RNase-Free DNase Set (Qiagen). RNA was quantified using a spectrophotometry system (NanoDrop Technologies, Wilmington, DE), and RNA quality determined by electrophoresis on a BioRad Experion system (BioRad, Hercules, CA). For each sample, 10 μg of RNA was converted to CyDye3-dCTP or CyDye5-dCTP (PerkinElmer, Waltham, MA)–labeled cDNA using the LabelStar kit (Qiagen) and random nonomers (Integrated DNA Technologies, Coralville, IA). Labeled cDNA was hybridized to the microarray using Agilent Hi-RPM hybridization solution in an Agilent Hybridization chamber (Agilent Technologies, Santa Clara, CA). A total of eight arrays, each with duplicate elements for each gene and alternating dye swap for each replicate (four biological replicates), were analyzed using Acuity 4.0 after Lowess normalization to obtain genes that were consistently and differentially regulated in comparison to EDL933, while limiting false discovery rate (FDR) below 5% (Benjamini and Hochberg, 1995).
Microarray validation
qPCR results for 30 induced and repressed genes were used as a validation of the microarray results. Measurements of relative transcript amounts were performed by qRT-PCR with the QuantiTect SYBR Green RT-PCR kit (Qiagen) according to the manufacturer's instructions. Cycling conditions were based upon the standard settings recommended for the 7500 Sequence Detection System (PE Applied Biosystems, Foster City, CA). In all cases the same RNA samples used for cDNA synthesis and microarrays were subsequently used for qPCR validation. Specific primer pairs were designed using integrated DNA technologies (IDT) online Scientific tools primer design software (
Microarray analyses
Microarray images were captured using a Genepix 4000B (Molecular Devices Corporation, Union City, CA) laser scanner, and images processed using GenePix 6.0 software (Molecular Devices Corporation). Microarray data analyses were performed using Acuity 4.0 software based upon standard methods. Slides were Lowess normalized to control for systemic variations. To ensure that genes missing from FRIK isolates (preserve low intensity signals) would be seen, the baseline and threshold values were set at (100, 1) to prevent their filtering out during preprocessing. Data were analyzed based upon log ratio (635cy5/532cy3) values. The fold change is calculated by the following formula: Fold change = 2(signal log2 ratio) (if signal log2 ratio ≥ 0); Fold change = − 1 × 2(−1×signal log2 ratio) (if signal log2 ratio < 0). Genes were included in the final dataset that exhibit at least |2.0|-fold comparative regulation. Relative significance was determined using t-tests corrected for multiple comparisons using FDR calculations with a final FDR <5% (Benjamini–Hochberg p < 0.05).
Functional enrichment analysis
The differentially regulated genes revealed by the microarray study were mapped to functional classifications schemes, such as Swiss Prot–Protein Information Resource keywords, gene ontology molecular function terms (Ashburner et al., 2000), and Kyoto Encyclopedia of Genes and Genomes (KEGG) pathways (Ogata et al., 1999). This was done through the use of Kraken (
Stx2-specific ELISA
FRIK966, FRIK2000, and EDL933 were cultured to log phase in LB broth, their OD normalized (OD600 = 0.35), and then centrifuged at 3000 g for 10 minutes. One milliliter of supernatant was transferred to a fresh 1.5 mL microcentrifuge tube. Triton X-100 was added to a final concentration of 0.1% and vortexed to disrupt Stx2-containing membrane vesicles (Yaron et al., 2000). A custom Stx2-specific ELISA (SafePath Laboratories, Carlsbad, CA) was conducted following the protocol recommended by the manufacturer. A bichromatic reading was taken with the measurement, and reference filters were set at 450 nm and 655 nm, respectively. All assays were performed in triplicate. The assay's specificity for Stx2 was confirmed by using purified Stx1 toxin obtained from the same manufacturer. Stx1-purified toxin did not cross react with the Stx2 assay. A standard curve was obtained with twofold serial dilutions of purified Stx2.
Statistical analyses
Statistics algorithms built into Acuity 4.0 were utilized for analyses related to microarrays. Built-in algorithms of ABI Prism 7500 Sequence Detection system software (PE Applied Biosystems) were utilized for all calculations related to qRT-PCR. Built-in algorithms of the DAVID's functional annotation tool were utilized to evaluate categorization statistics.
Genome sequencing
Genomic DNA for the bacteria was extracted using a QIAamp DNA mini kit (Qiagen). DNA samples were quantified using a Nanodrop spectrophotometer (Nyxor Biotech, Paris, France) and quality was evaluated using BioRad Experion labchip system (BioRad) and gel electrophoresis. Utilizing 700 ng/μL of DNA library preparations for both shotgun and long paired-end DNA, library preparation and sequencing reactions were performed at Research and Testing Laboratories (
Draft genomes
Scaffolds for each genome, derived from paired-end sequencing, were assembled using the Newbler “gsAassembler” (Roche Diagnostics). Shotgun reads were then added in an iterative fashion. The final scaffolded assembly was subsequently utilized for analyses and annotated using Joint Genome Institutes Expert Review (IGM/ER) submission system (Markowitz et al., 2006; Markowitz and Kyrpides, 2007).
PCR screening for missing genes
PCR was utilized to screen for genes encoded within bacteriophage 933W, which were suspected to be absent after draft genome assembly and annotation of FRIK966 and FRIK2000. EDL933W phage genes were exported from Genbank (
Results
Microarray analysis of gene expression in laboratory media was performed to evaluate the differences in expression between EDL933 and the two lineage II strains. A total of 1277 genes showed significant differential regulation (FDR <5%) among both comparisons. The results of the microarray experiments are summarized in Table 1. The results of the microarray study were dramatic, with 24.7% of the genes across all of the 16 hybridizations showing significantly differential expression. In relation to genes of the bacteriophage of EDL933, which encodes STX2 (BP-933W), the results indicate that nearly all of the genes show significant (corrected p-value <0.05) repression in comparison to EDL933. In FRIK966, three of the BP-933W genes were induced in comparison to EDL933. These were Roi, which is a DNA binding protein (1.7-fold induction with corrected p-value 0.04), antitermination protein N (1.87-fold, corrected p-value 0.01), and an unknown protein with locus ID Z1466 (2.5-fold, corrected p-value 0.03). None of the phage genes were comparatively induced in FRIK2000. Both STX2A and STX2B subunits were repressed in FRIK966 (−6.8 and − 9.7-fold, respectively) and FRIK2000 (−6.2 and − 7.7-fold respectively).
The total number of genes producing microarray data is provided. The total number of genes that were significantly regulated is provided. The number of genes filtered based upon fold gene expression, where |2.0| is the absolute value of the fold regulation taking into account both induced and repressed genes, is shown. The total number of genes showing a level of reduced gene expression <10.0-fold and those genes encoded in bacteriophage BP-933W is also summarized.
Functional analysis of the microarray data was performed. In lineage II strains those genes that had significantly lower expression (FDR <5% and fold <|2.0|) were evaluated using KEGG pathways, Gene Ontology Molecular Function, and Swiss Prot protein information resource keywords. The most significantly repressed functional categories for FRIK2000 were nickel ion binding, atrazine degradation, urease activity, and fucose metabolism. The most induced categories of FRIK2000 were motor, structural, and transmembrane receptor activities; flagellar assembly; chemotaxis; receptor activity; and two-component systems. The most induced categories for FRIK966 were DNA binding activity. The most repressed functional categories of FRIK966 were related to nickel binding, ammonia-lyase activity, urease activity, citrate cycle, atrazine degradation, and fucose metabolism. Thus, based upon microarray data both strains showed a reduction in nickel ion binding, atrazine degradation, urease activity, and fucose metabolism. The functional analysis data are provided in Table 2. The results of this are also further elucidated in Supplemental Table S1 (available online at
The first column of the table is utilized to divide the analysis into those genes repressed or induced in each of the lineage II strains. Also indicated are gene ontology molecular function (GOTERM MF) categories; KEGG pathway categories; and Swiss Prot Protein Information Resource functional keywords (SW PIR keywords); the number of genes regulated that were functionally related to each “category” (gene); the percent of the total genes from a given category, which were significantly regulated (%); the relative noncorrected p-value generated for enrichment of a pathway in comparison to the background EDL933 genome; the relative fold enrichment (fold) of the category compared with the background genome; and the corrected significance based upon FDR limited to an FDR of 5%.
FDR, false discovery rate; SP, Swiss Prot; PIR, protein information resource; KEGG, Kyoto Encyclopedia of Genes and Genomes.
Validation of the microarray results was conducted using qPCR based upon 30 separate genes encoded within BP-933W. Also evaluated were several other genes, including uvrA, polB, phrB, wrbA, and ecnB. The results of the qPCR validation are presented in Table 3. The correlation of the results, not including nondetects within the qPCR analysis, indicates that the microarray results were valid. The nondetects were genes detected in EDL933, which were not found within draft genomes of the FRIK966 or FRIK2000 assays. These results also corresponded to microarray responses with large fold differences in expression >50-fold. A summary analysis of the microarray data averaged across both FRIK strains in relation to EDL933 is included in Supplemental Table S1.
The GenBank accession (ID) is provided for each of the genes. The best scoring primer pair, as indicated in the Materials and Methods, was utilized in each instance. ND indicates there was no detection of the gene within either the FRIK2000 qPCR results (qPCR2000) or the FRIK966 qPCR results (qPCR966). Also provided for comparison were the fold-differences in expression, based upon the respective microarray data (array2000 and array966, respectively). The respective name of the gene is indicated. For genes encoded within BP-933W without gene name designations, the genes are listed as “Unknown.”
qPCR, quantitative polymerase chain reaction.
The genome projects and draft genomes were submitted to NCBI under genome project accessions 36543 for FRIK2000 and 32275 for FRIK966. The bulk and paired-end reads for the two genomes were submitted to the short read archives of NCBI under accession SRA009055 for FRIK2000 and SRA009054 for FRIK966. Bulk pyrosequencing reactions for FRIK966 produced 244,969 high-quality reads >150 bp with an average length of 248 bp (60.7 Mb). Paired-end pyrosequencing for FRIK966 produced 165,515 reads containing a total of 98,404 paired-end reads, which assembled into 73 scaffolds. The estimated genome coverage was 14.8-fold. The predicted size of FRIK966 was 5,377,686 with 4902 predicted elements and 80 RNAs. Bulk pyrosequencing of FRIK2000 produces 619,639 high-quality reads >150 bp with an average length of 236 bp (146 Mb). Paired-end sequencing or FRIK2000 produced 310,839 reads containing a total of 133,293 paired-end reads (27 Mb), which assembled into 67 scaffolds. The predicted size of FRIK2000 was 5,439,119 bp with 5366 predicted elements and 79 RNAs. The estimated genome fold coverage was 32 ×. Assembled genome contigs were successfully annotated with JGI's IMG/ER system (Markowitz et al., 2006; Markowitz and Kyrpides, 2007). Based upon fold coverage and supported by KEGG genome comparative analysis to EDL933 (Table 4), comprehensive coverage drafts of the two genomes were achieved.
The primary metabolic pathways are indicated along with the number of genes within each pathway for each of the three strains.
More comprehensive comparative genomics of the 387 functional pathways common among all three strains shows a number of genes potentially missing from both the FRIK strains in comparison to EDL933 and a number of pathways enhanced in the FRIK strains compared with EDL933 (Supplemental Table S2, available online at
Both STX2-specific ELISA and qPCR were performed. The ELISA responses revealed no detectable expression of STX2 for FRIK966 or FRIK2000 (detection limit was estimated to be 22 pg/mL), whereas EDL933 produced relatively high expression of toxin corresponding to approximately 340 ng/mL. The level of toxin expression measured by ELISA was supported by the qPCR data for expression of the genes (Table 3) and the microarray data.
To provide the best possible understanding of why the toxins might be lacking expression mechanisms, we drafted genomes of these two cattle strains using Roche 454 FLX pyrosequencing paired-end and bulk sequencing. The genomes were assembled and scaffolds utilized for annotation. The draft genome was compared with EDL933 using maximal unique matching (MUMmer) and the contigs were reordered and numbered in accordance with this rearrangement (data not shown). After the renumbering of the contigs, the genes from BP-933W were extracted from GenBank and utilized to scan the assembled draft genomes of FRIK966 and FRIK2000. Figure 1 provides information on the presence or absence of individual genes in relation to BP-933W. Thus, after this renumbering, those contigs predicted to be adjoined would have adjoined numbers as detailed in Table 5. These data indicate that the genes from this phage have likely been distributed throughout the genome by way of rearrangement. Using PCR and primers designed to target the potentially missing genes, we confirmed whether these genes were indeed missing. The results of this PCR are provided in Table 5. PCR was also used to attempt to close contig gaps in the genome in relation to the MUMmer analysis for those contigs encoding BP-933 genes. We were unable to resolve the closures of these specific gaps, providing additional proof that these genes have undergone rearrangement throughout the genome (data not shown). Finishing or closure of the draft genomes was beyond the scope of the project, and for future efforts the strains have been submitted to ATCC and all draft genome data submitted to NCBI.
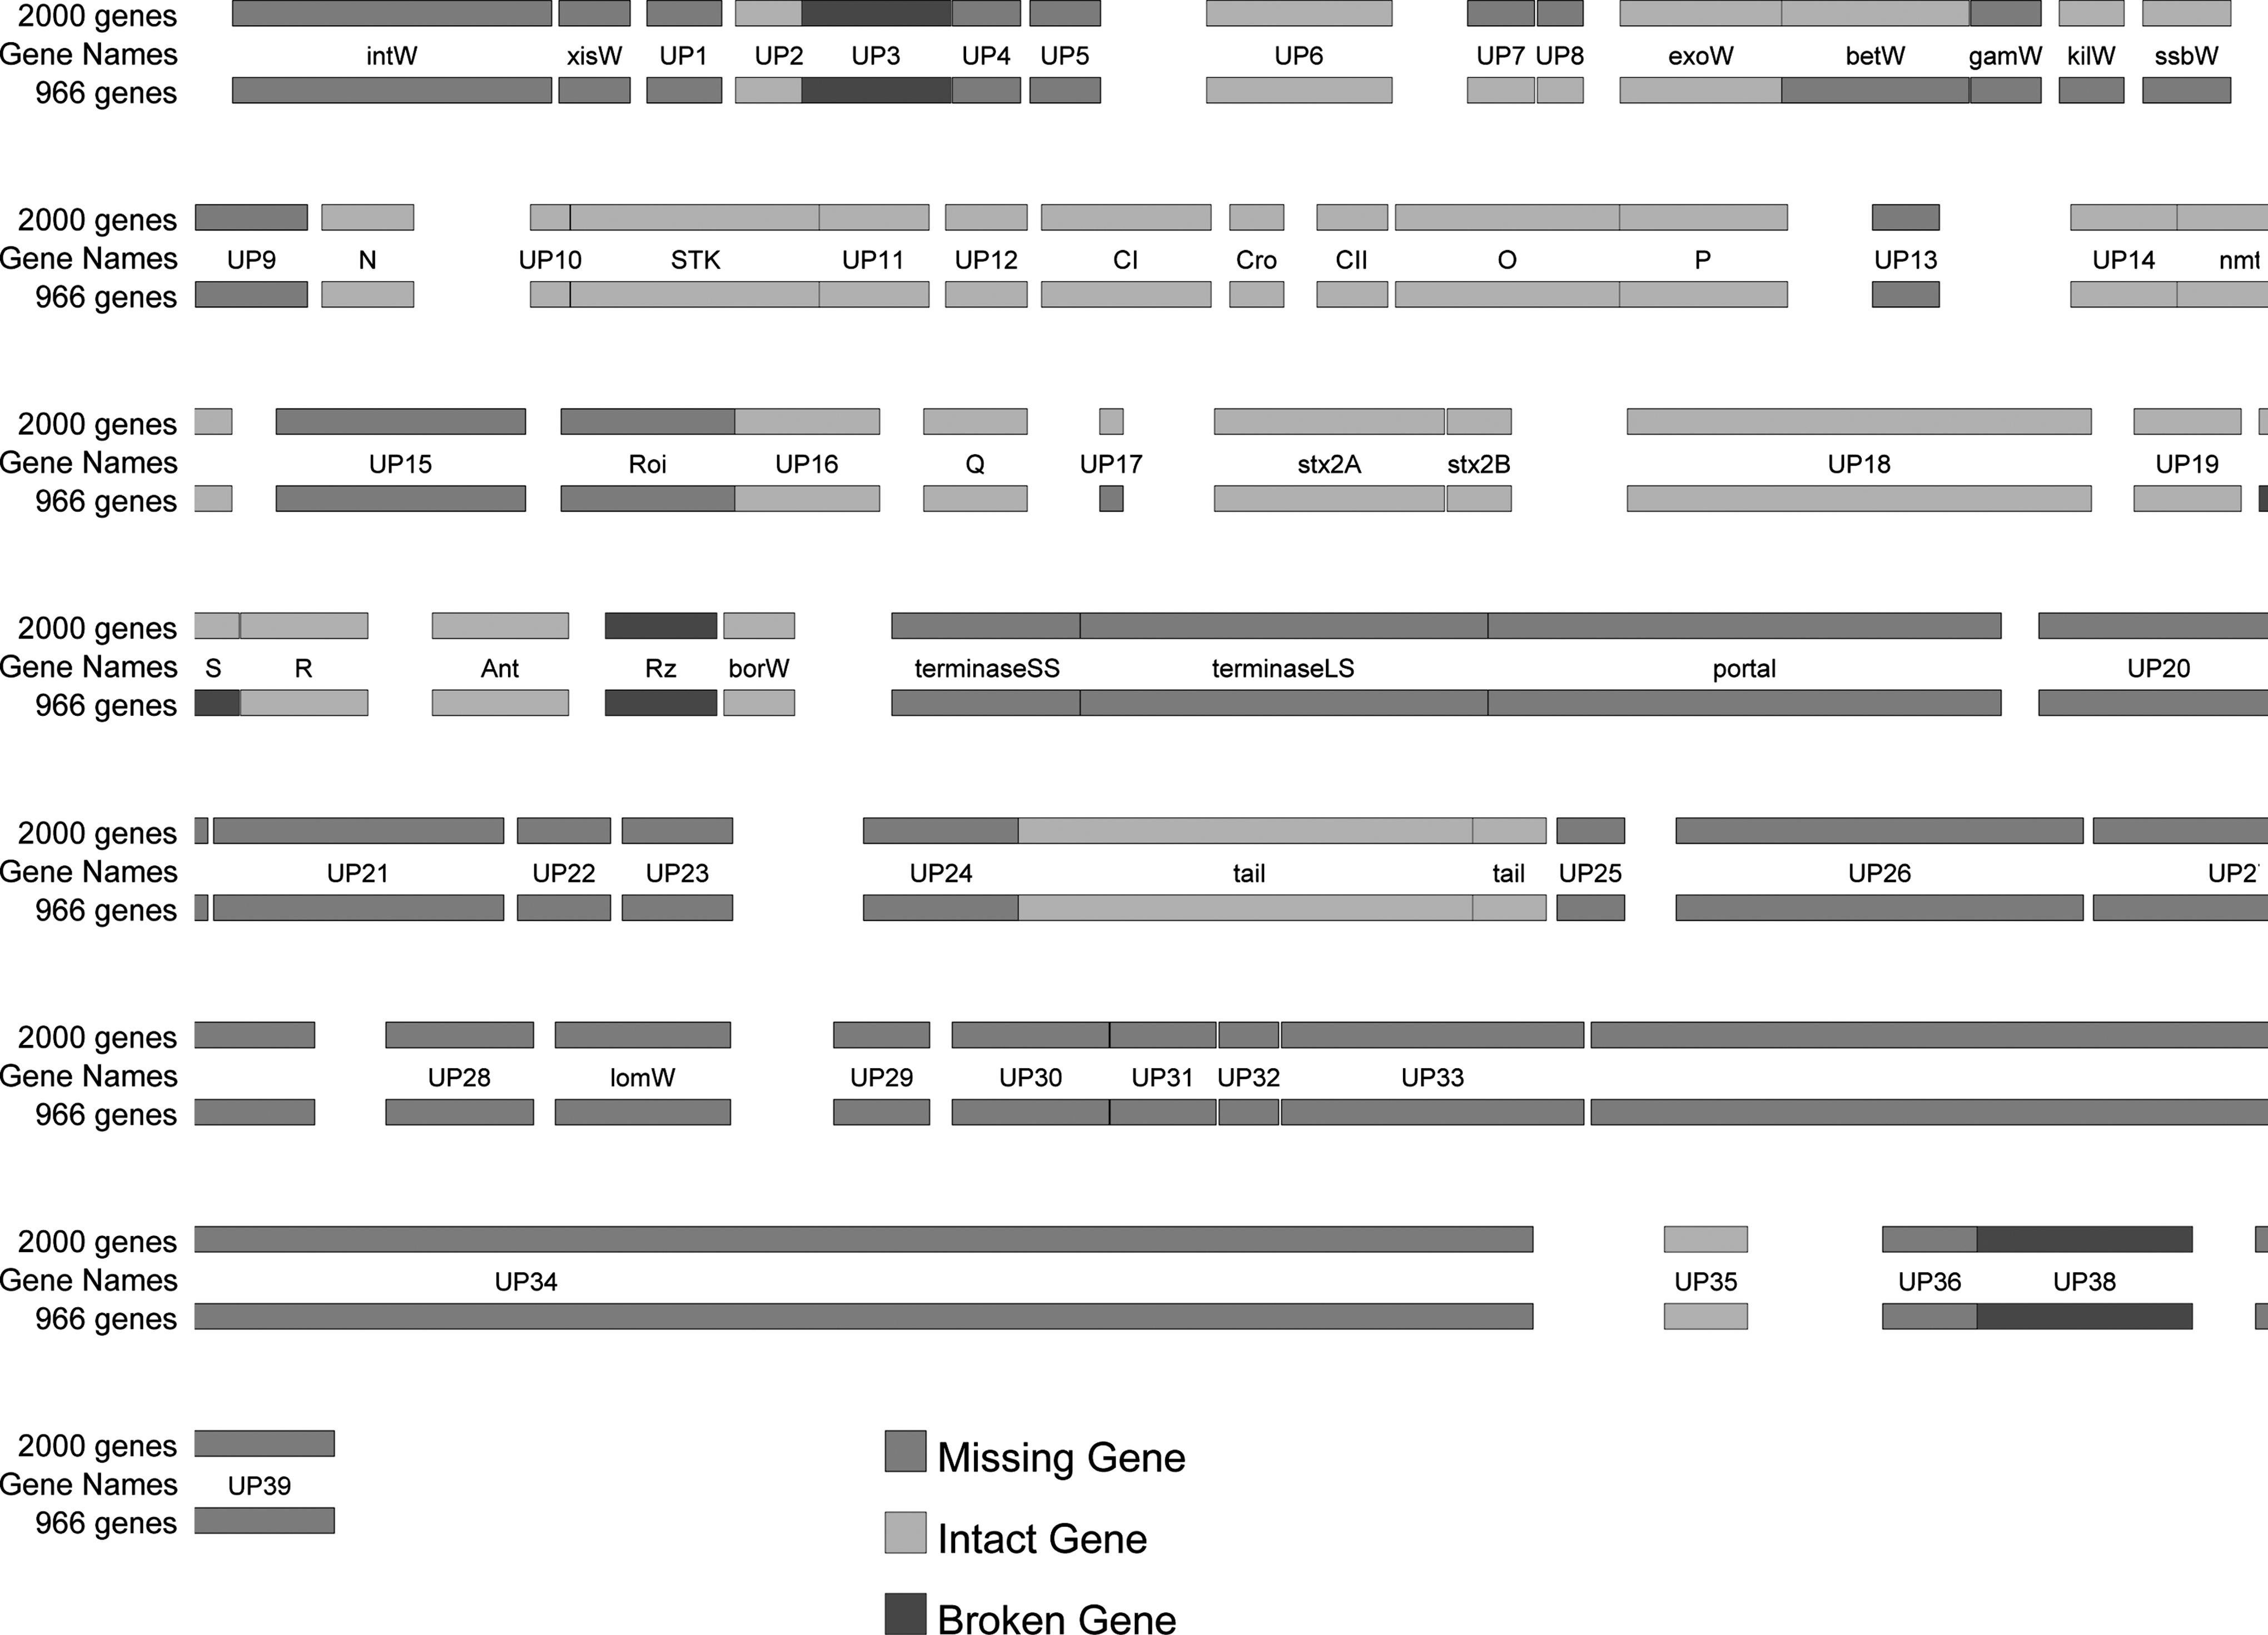
Genetic map depicting the organization of genes encoded within bacteriophage BP-933W from Escherichia coli EDL933. In this figure the bacteriophage genes are indicated in the order in which they are encoded in BP-933W. For example, in the phage genome the first gene is intW, followed by xisW, followed by a series of unknown proteins (UP1–UP8), and so on. In relation to FRIK966 and FRIK2000 this figure indicates three important things: (1) genes that can be found in the two cattle strains are shown in light gray; (2) genes that were not found within the FRIK genome sequences or using polymerase chain reaction approaches are shown in dark gray, and genes that are partially encoded (broken or disrupted genes) within the two cattle strains are shown in black. Table 5 details in which contig each gene was found based upon predicted numbering scheme such that numbers of contigs that are predicted to be joined have concurrent numbering. Thus, contig 3 comes before contig 4. We can see from this figure that for FRIK2000 (indicated on the lines designated as 2000 genes) that 32 of the original genes are found (light gray), whereas 33 of the genes are missing (3 genes disrupted). In FRIK966 29 genes are found intact, 35 genes are missing, and 4 are broken (disrupted). Gene designations are provided (betW, gamW, etc.) with unknown or hypothetical proteins indicated with “UP#,” where number is concurrent numbering within the BP-933 genome.
The genes, or their designations, are indicated along with the respective GenBank accession numbers. The contigs in which these genes were identified are also provided. The “*” designation indicates that the contig contains an IS629 or fragment, the “^” indicates that this IS629 is adjacent to the BP-933 gene in question, and contigs without such designations did not contain an IS629. For those genes that were not found in the assembly (NF), the isolates were screened with PCR to provide additional evidence that these genes were indeed missing. POS indicates that they were detected, NEG indicates that they were not detected, and NS indicates that the gene was not screened by PCR.
Based upon a genome comparison of EDL933 and O157 Sakai we found that notable rearrangements in these two fully sequenced genomes were associated primarily with the IS629-like transposons. We then screened the contigs from FRIK2000 and FRIK966 for IS629 primarily in regions encoding BP-933W genes. Table 5 indicates contigs that have IS629-like sequences in proximity to BP-933W encoding genes. The vast majority of contigs that were identified as having BP-933W-like genes also had IS629-like (transposon) related genes (Table 5).
Discussion
Evidence is mounting in support of the original hypothesis presented by the Benson laboratory that two relatively distinct lineages of E. coli O157:H7 exist, which have evolved separately (Kim et al., 1999; Dowd and Ishizaki, 2006). This hypothesis further infers that one of these lineages (lineage I) may even have a higher potential for pathogenicity or transmissivity to a human host, whereas the second lineage may have evolved to become a commensal organism associated primarily with cattle.
Previous research carried out by Dowd and Ishizaki (2006) provided preliminary evidence that lineage I strains might express more stx2 mRNA. In a second study, Dowd and Williams (2008) showed that lineage I isolates as a group express significantly higher amounts of Stx2 than lineage II isolates. Other important studies have also evaluated Shiga toxin from bovine and human sources (Cheng et al., 2006; Ateba and Bezuidenhout, 2008; Laing et al., 2008, 2009; Lowe et al., 2009; Steele et al., 2009; Stephan et al., 2009). Research by LeJeune et al. (2004) on O157:H7 strains, from clinical patients and those of bovine origin, found antiterminator gene Q of phage 933W to be more commonly detected, using PCR, in disease-associated human strains. It has also been observed that the regulatory mechanisms employed by Stx2 encoding phages play a vital role in Stx-producing E. coli (STEC) pathogenesis (Wagner et al., 2001). Our study evaluated stx2 gene expression and Stx2 expression during log phase growth in comparison to that of EDL933. It is an important point that maximal expression of the toxin is at late stationary phase and can be enhanced by agents such as mitomycin C. However, under the conditions presented it is a safe assumption that expression of these genes in these two bovine strains is significantly less than that of known clinical strains. It is our speculation that the lack of a functional late regulatory region of this phage in lineage II strains would likely mean decreased pathogenicity in humans compared with EDL933 and other lineage I strains that express Stx2 effectively. It has been indicated that among all of the virulence factors encoded in EHEC, the greatest significance between a specific virulence factor and the severity of human disease is strongly correlated to the Stx2 toxin expression (Boerlin et al., 1999; Donohue-Rolfe et al., 2000).
The goal of this study was to provide additional data to support the hypothesis that genetic rearrangements in these two lineage II strains have rendered the STX2a toxin unable to be effectively expressed. The current whole-genome microarray studies between FRIK2000, FRIK966, and EDL933 show that indeed there is a dramatic reduction in expression of BP-933W bacteriophage genes along with little or no expression of stx2. Subsequent genome sequencing revealed that these genes are absent from the two cattle strains and that the BP-933W genes that remain are not contiguous in the genome and have been rearranged. This strongly suggests that these stx2-encoded phages are no longer actively able to be induced, and because of rearrangement of the genomes, the toxin expression machinery is disabled.
The strain EDL933 was isolated from Michigan ground beef linked to the 1982 hamburger incident (Riley et al., 1983). Sequencing of the genome of this E. coli O157:H7 strain was performed by Perna et al. (2001). It was reported that the 5.52 Mb genome of EDL933 possesses 0.81 Mb more DNA than the archetypal E. coli strain, K-12 MG1655 (Blattner et al., 1997), 1387 new genes, and 177 genetic O-islands (OI) (regions of genetic information with no homology to the K-12 strain MG1655). Within these OI a variety of putative virulence factors and 17 cryptic prophage (CP) were found. These prophages are considered cryptic because they probably lack a full complement of functional phage genes that would allow for completion of a lytic cycle. Only one phage lysogenized in the EDL933 genome (BP-933W) has been found to be inducible and capable of lytic functions. This prophage encodes the Stx2 gene and has been previously described (Plunkett et al., 1999). In addition to prophage, the genome of EDL933 also encodes a wide variety of insertion sequences (IS) and recombination hot spots (RHS) spread throughout the genome. Many of these IS and RHS regions are closely associated with the genetic OI.
Hayashi et al. (2001) completed the sequencing of an E. coli O157:H7 isolated from an outbreak that occurred in Sakai City, Osaka prefecture, Japan, where more than 6000 schoolchildren were affected. Hayashi et al. identified 1632 new genes not found in MG1655 with 1.39 Mb related to OI [called S-loops in the Hayashi et al. (2001) paper]. The genome of O157 Sakai is 5.498 Mb compared with the 5.529 Mb of EDL933. Thus, the genome of O157 Sakai is only slightly smaller than EDL933. Both O157 strains have a backbone of approximately 4.1 Mb that shares up to 98.4% homology to the backbone of MG1655. Both strains encode 18 prophage-related sites, the majority being lambdoid phage, and up to 50% of the genome is of bacteriophage origin. Eighty-four (45 truncated or partial) IS were identified, including seven that were newly identified. O157 Sakai also contains nine RHS elements, three of which are newly identified.
In relation to these two clinical strains (EDL933 and Sakai) the effects of genetic rearrangement were very evident from an examination of the OI regions that do not share homology. There are 177 OI defined in EDL933. Because the genome is circular, OI1 and OI177 are neighbors within the genome. The origin of replication (OriC) is located between OI154 and OI155; thus, E. coli replicates these islands first. OI60 and OI61 are approximately opposite of OriC on the circular O157 chromosome and thus would likely be replicated last. Only 9 out of the 177 OI in EDL933 and O157 Sakai have nonhomologous regions greater than 1 kb (based upon EDL933 enumeration, these are OI44, OI 45, OI 48/43, OI50, OI52, OI57, OI79, OI93, and OI108). In addition, eight of these OI display genetic rearrangements with sequences from other locations within the genome and seven of these eight islands also encode cryptic prophage. Further, these eight nonhomologous islands are located opposite the OriC region, whereas homologous islands are located in relative proximity to the origin. A diverse array of integrons, IS, RHS, and phage sequences are associated with the OI displaying rearrangements. When comparing EDL933 and Sakai, most, if not all, of the rearrangements observed are associated with IS factors, particularly IS629.
Based upon this information we screened those contigs containing genes related to BP-933W for IS. Within the draft genomes and the contigs containing portions of the remaining genes, at least 77 IS were identified. Only one contig, which encoded remnants of BP-933W genes, also did not encode genes with homology to IS629. Many of these IS were located immediately adjacent to phage genes as delineated in Table 5. Gap closure PCR assays were designed and utilized to confirm that contigs containing BP-933W genes were noncontiguous (data not shown). This provided additional evidence that rearrangement of the genome of this phage is likely a result of IS629 activity and has resulted in this bacteriophage becoming a disrupted cryptic prophage. PCR screening of the bacteriophage provided final evidence that these necessary structural components are indeed absent from the genome of these two cattle strains. Both qPCR and ELISA assays for stx2 or Stx2, respectively, showed that this toxin is not actively expressed in these cattle strains. Figure 1 presents the genes associated with BP-933W, indicating which genes were not found within either FRIK966 or FRIK2000.
What are the short-term and long-term effects of genetic rearrangements? If we consider that O157:H7 diverged from O55:H7 or vice versa, or that they both diverged along separate paths from some distant relative, the question arises whether they have evolved in conjunction with their respective hosts becoming less virulent and a more successful part of the host's natural flora, or alternatively through lateral gene transfer or genomic rearrangements becoming more virulent. The generalized theory related to the evolution of pathogenesis suggests that pathogens develop to become less acutely devastating to the host (Bergstrom et al., 1999). Those organisms, which are highly virulent and cause severe symptoms, are considered the more recently developed pathogens, whereas those that cause medium to mild symptoms have been associated with the particular host for longer periods of time. It can reasonably be argued that bacterial speciation is driven by two concurrent phenomenon: (1) the availability of shared genetic information (the common pool of genetic information) and (2) the presence of various environmental pressures. Hendrix et al. (1999), for instance, described this common pool in relation to bacteriophages and concluded that bacteriophages hypothetically have access to all the possible genetic information, yet because of natural barriers (geographic, host range, etc.) they do not have equal access to all of the information found in the common pool. This, combined with the modular phage genome hypothesis (Campbell et al., 1979), provides a rational explanation of the divergent evolution of the lambdoid bacteriophages. Combining these theories and applying them to bacteria, we can envision an adaptable modular bacterial genome that actively samples its environment for genetic data and through mobile elements, such as phages and transposons, and induces ameliorative changes in the genome to better equip the bacteria for survival in new niches.
In this model, transduction, transformation, and conjugation work, along with mutations and genomic rearrangement, to provide the necessary dynamics, genome plasticity, and genetic information required for bacterial adaptation. Conversant with the model of Hendrix et al. (1999), bacteria (not bacteriophage) are the active players and the phages are one of several tools used by bacteria to sample and obtain data from common pools of genetic information. By sampling these common pools, it has been estimated that E. coli replaces 16 kbp of its genome every million years (Lawrence and Ochman, 1998). Bacteria actively acquire genetic data from, while also relinquishing genetic information into, the genetic pool. Transduction, transformation, and conjugation work congruently as means of acquiring and sharing genetic data. Cell death, whether natural or phage induced, combined with genomic rearrangements reintroduces genetic information with novel characteristics back into the common pool. Conjugation also works in this scheme as a sexual method for transferring genetic information. By randomly acquiring new genetic information, a bacterium, which may be new to an environment, can potentially find the genetic information needed to enhance survival or pathogenicity. It is through these mechanisms that cattle strains of E. coli O157:H7 may hypothetically be evolving to reduce or eliminate Stx2 toxin expression that would reduce its production tax on their physiology, thereby promoting better commensalism with their cattle hosts. There are other very interesting alternative and impactful studies that might also select for retention of stx2 expression in cattle as described by Ferens et al. (Ferens and Hovde, 2000; Basu et al., 2003; Ferens et al., 2006), who suggest that there might be selective pressure to retain Stx2 expression. Also impact of other environmental reservoirs should not be discounted as a route to continually introduce Stx2-positive strains back into the cattle reservoir. Ultimately, we present our hypotheses as a means of increasing interest in one of the factors contributing to the evolution and genetic plasticity of E. coli O157:H7. This hypothesis can be incorporated into other prevailing hypothesis to paint a more complete picture of this fascinating ecological puzzle.
Conclusions
Two cattle strains were evaluated using microarray, qPCR, marker screening for BP-933W-related genes, draft genome sequencing, and bioinformatics approaches. The strains contained inactive toxin expression machinery. Within the genome of the two cattle strains, the lytic bacteriophage encoding STX2 has been reduced to an inactive prophage. Most of the structural genes for this phage have apparently been lost from the genome. The transcription start sites for late phage gene expression have been disrupted significantly reducing or eliminating toxin expression. Thus, the comparative analyses performed in this study provide evidence to support the existence of a less pathogenic genetic lineage of O157:H7. Two draft genomes of cattle strains have been submitted to national databanks to allow for additional analysis, including reassembly/reannotation, and more extensive genome comparisons beyond the hypothesis addressed here. Whole-genome microarray comparisons of the two cattle strains have also been performed and the data submitted to the public Gene Expression Omnibus, allowing for the scientific community to further analyze these data in relation to the draft genomes and comparative to the genome of EDL933.
Footnotes
Acknowledgments
Charles Kasper for the original isolation of these bacteria, Andrew Benson for providing the strains, and the team of Research and Testing for helping with all aspects of the study. This study was conducted using internal research monies from Research and Testing Laboratory (Lubbock, TX) as well as support from authors.
Disclaimer
Mention of trade names does not reflect an endorsement by Agricultural Research Service, U.S. Department of Agriculture, Research and Testing Laboratory, or any of the authors.
Disclosure Statement
No competing financial interests exist.
References
Supplementary Material
Please find the following supplemental material available below.
For Open Access articles published under a Creative Commons License, all supplemental material carries the same license as the article it is associated with.
For non-Open Access articles published, all supplemental material carries a non-exclusive license, and permission requests for re-use of supplemental material or any part of supplemental material shall be sent directly to the copyright owner as specified in the copyright notice associated with the article.