
Abstract
The prevalence and concentration of many foodborne pathogens exhibit seasonal patterns at different stages of the farm-to-table continuum. Escherichia coli O157:H7 is one such pathogen. While numerous studies have described the seasonal trend of E. coli O157:H7 in live cattle, ground beef, and human cases, it is difficult to relate the results from these different studies and determine the interrelationships that drive the seasonal pattern of beef-related human illnesses. This study uses a common modeling approach, which facilitates the comparisons across data sets, to relate prevalence in live cattle to raw ground beef and human illness. The results support an intuitive model where a seasonal rise of E. coli O157:H7 in cattle drives increased ground beef prevalence and a corresponding rise in the human case rate. We also demonstrate the use of these models to assess the public health impact of consumer behaviors. We present an example that suggests that the probability of illness, associated with summertime cooking and handling practices, is not substantially higher than the baseline probability associated with more conventional cooking and handling practices during the remainder of the year.
Introduction
Several studies have noted seasonal variations in the occurrence of E. coli O157:H7–related events in the continuum between live animals and human illness (Chapman et al., 1997; Douglas and Kurien, 1997; Barkocy-Gallagher et al., 2003; Smith et al., 2005; Edrington et al., 2006). These results suggest that E. coli O157:H7 occurrence is greatest in the summer months across the different populations studied, though this conclusion does not necessarily hold across all populations studied (Ogden et al., 2004). Nevertheless, a comprehensive comparison of E. coli O157:H7 occurrence among live cattle, ground beef consumption, and human illness is lacking. An advantage of a comprehensive understanding is that it would allow public health agencies that regulate beef production and processing to better understand the role of certain industry practices and consumer behaviors as they relate to foodborne illness. For example, numerous epidemiological studies (Canada Communicable Disease Report, 2000; Shipman et al., 2009) have linked summertime cooking and handling practices with outbreaks, but it is difficult to estimate the fraction of illnesses that are related to these practices and whether the proportion of unsafely prepared meals substantially increases as the result of outdoor preparation.
The public health importance of beef-associated E. coli O157:H7 illness supports a need to assess its seasonality in a comprehensive manner across the farm-to-table continuum (Abdul-Raouf et al., 1993). To facilitate comparisons, a comprehensive assessment should use a consistent approach to data analysis and a framework for relating the seasonal components to one another.
The goals of this study were to propose a simple model to describe and fit seasonal patterns in the prevalence of E. coli O157:H7, apply this model to describe the seasonal occurrence of E. coli O157:H7 in live cattle, ground beef, beef consumption, and human illnesses, propose an analytical framework that can be used to assess the contribution of different causative factors or mitigation strategies, and to provide an example assessing the contribution to human illness of seasonal cooking and food-handling practices.
Data Description
A brief description of the data sources used in the study is provided along with references that provide additional details. The time span of some data sets was chosen to represent periods where the data collection and testing methods were consistent. Descriptions of the E. coli O157:H7 testing methods are not included here because it is assumed that test sensitivity does not influence the estimation of seasonality components of the observed prevalence. This assumption is reasonable because test and surveillance system sensitivity typically relate true and observed prevalence through a constant of proportionality.
Ground beef prevalence data
The Food Safety and Inspection Service of the U.S. Department of Agriculture has been collecting ground beef samples from all slaughter and grinding facilities producing ground beef products since the beginning of the year 2000. The 108 months from January 2000 through the end of December 2008 were used in this analysis.
Each facility that produces ground beef for distribution has been sampled on multiple occasions every year (Food Safety and Inspection Service verification sampling programs MT03 and MT43). Under the current sampling program, plants are scheduled for sampling at least four times each year. Additional follow-up sampling is performed whenever E. coli O157:H7 is detected, but these data are not included in the analysis. The sample unit consists of 325 g of ground beef collected from lots at the end of production. The sampling rate has generally increased since the inception of the program; the number of samples analyzed per month ranges from 197 to 1136. The increase in the sampling rate has improved the precision of the estimator of prevalence by approximately 40%. The prevalence of contaminated lots of ground beef as identified by sampling is not necessarily equivalent to the prevalence of contaminated ground beef servings, due to the total surveillance sensitivity, but it will be assumed that the relationship is proportional.
The Food Safety and Inspection Service (FSIS, 2008) provides descriptions of the testing methodologies used since the inception of the program.
Human illness data
The Centers for Disease Control and Prevention FoodNet (Wallace et al., 1997; CDC, 2008) program reports the number of illnesses detected at over 650 affiliated labs in 10 different sites that represent approximately 15% of the U.S. population (45.9 million people). The number of E. coli O157:H7 illnesses reported monthly in FoodNet, covering the same 108-month period between January 2000 through December 2008 timeline as the ground beef sampling data, was used in the analysis. A limitation of these data is that not all reported illnesses are necessarily foodborne. For these analyses, it is assumed that the proportion of the illnesses attributed to ground beef has remained constant.
Human outbreak data
The electronic Foodborne Outbreak Reporting System is a separate public health surveillance network that compiles information on outbreaks, where an outbreak is defined as the occurrence of two or more illnesses related in space and time (CDC, 2009). State, local, and territorial health departments use an electronic reporting system and standardized practices to report these outbreaks to a centralized database (Olsen et al., 2000). The electronic Foodborne Outbreak Reporting System data provided two response variables for analysis: the number of E. coli O157:H7 outbreaks that were beef-related and the number of E. coli O157:H7 outbreaks associated with other commodities. These data were available from January 2000 through December 2007. The purpose of analyzing these data, in addition to the data for individual illnesses, is to determine if a seasonal pattern exists in the proportion of outbreak associated E. coli O157:H7 illnesses attributed to ground beef.
Cattle prevalence data
A number of longitudinal studies of cattle prevalence have been completed, but differences in sampling and testing procedures make combining the different data sets impractical. The chosen cattle prevalence data were collected from pens of feedlot cattle consuming finishing rations in a longitudinal study designed to describe the probability of cattle shedding E. coli O157:H7 in feces. Fecal samples were collected from each animal within a pen of cattle, sampled a single time, from within five commercial feedlots on various occasions from June 1999 through October 2002. Although sampling was not performed every month, samples representing summer and winter periods were collected every year. Data from multiple sampling occasions during a month were combined into monthly prevalence estimates. The number of animals sampled per month ranged from 75 to 1166, with a median of 470. E. coli O157:H7 was isolated from 1680 of 7893 individual animal fecal samples. Testing methodology is described by Smith et al. (2001).
Ground beef consumption data
To determine the effect of consumption on seasonal human illness, we examined the seasonal patterns of ground beef consumption in the United States. The amount of ground beef available for consumption in the United States was used to estimate the amount consumed each month. Temporal discrepancies between servings available and servings consumed might occur due to a lag between production and consumption as well as the fraction of raw ground beef that is frozen for later consumption.
Ground beef available for consumption was estimated as the sum of ground beef produced from domestic slaughter and imported beef products. No attempt was made to account for the portion of ground beef frozen for later consumption. The number of cattle slaughtered each day is recorded in the electronic Animal Disposition Reporting System database maintained by the U.S. Department of Agriculture (USDA) Food Safety and Inspection Service. The amount of ground beef produced from domestic slaughter was estimated using data on beef cow, bull/stag, dairy cow, heifer, and steer slaughtered each day from January 2005 through December 2008 from electronic Animal Disposition Reporting System. The average dressed weight for each subclass by year was reported by the National Agricultural Statistics Service. The average amount of each subclass that results in trim for ground beef was reported by the USDA Economic Research Services (NASS, 2009).
The amount of advanced meat recovery product, boneless trimmings, cheek meat, head meat, trimmings, and ground beef imported monthly from January 2005 through December 2008 were obtained from the USDA Food Safety and Inspection Service, Office of International Affairs.
Methods
Describing seasonal patterns and understanding the relationships between these patterns and human illnesses requires a two-step process. The first step is the fitting of models to the five data sets and the second is the proposal of an analytical framework for understanding the contribution of each seasonal component to human illness.
A model for describing seasonal patterns
The five data sets represent monthly time series data for cattle prevalence, ground beef prevalence, ground beef consumption, and human illnesses. The analysis follows the standard time series analysis approach of first removing large-scale trends in the data and then modeling smaller scales patterns. The model for each data set decomposes the data into three components. The first component [A(t)] is a trend model that accounts for variation at a roughly annual level. The second component [S(t)] is a seasonal model that accounts for monthly fluctuations about the trend. The third component [ɛ] describes residual variability. The prevalence (or ground beef consumption) in each month was modeled using
with primary interest being the model component describing seasonal variation.
A single model form was used to simplify the comparison of the seasonal components across the data sets. Sinusoidal patterns were evident in all of the data sets. The model
was used, where t indexes months,
The seasonal models are transformed to express the change as a percentage of the annual average for each study variable, specifically,
Application of seasonality models
Public health agencies are interested in determining effective policies and mitigation strategies that reduce the number of human illnesses. The adoption of an effective policy hinges on determining underlying mechanisms that contribute to increased food safety risk and developing strategies to address these specific mechanisms.
It is important to describe the various events that account for human illnesses. The unconditional probability of illness [P(ill)] can be written as the probability that a person becomes ill given that the person was exposed to E. coli O157:H7 times the probability of that exposure [P(exp)], plus the probability of illness given that no exposure occurred;
If a person has not been exposed to E. coli O157:H7, the person should not get ill, so the second term is 0 and
One of the components of this equation describes the proportion of servings contaminated with E. coli O157:H7, which is P(exp). Given that the average serving size is not orders of magnitude larger than the size of the ground beef sampling unit, it is reasonable to assume that the fraction of servings that are E. coli O157:H7 contaminated is proportional to the fraction of contaminated ground beef samples.
The term P(ill|exp) is a complex value that accounts for the probability that pathogens in servings are viable at the time of ingestion and manage to cause illness. It actually represents the integration of an exposure distribution through a dose–response function. The exposure distribution describes variability in dose per serving and reflects the effectiveness of cooking and growth of the organism between the point of beef production and the point of beef consumption. The dose–response function reflects an increasing likelihood of illness with increasing size of consumed dose. Determining the effect of mitigation strategies that seek to change P(ill|exp), such as improvements in storage temperature to reduce the opportunity for pathogen growth, can be complicated because of the nonlinear shape of most dose–response functions.
This simple equation also links the total number of illnesses attributed to beef to the number of servings (N
servings) by
This equation describes the total annual number of beef illnesses (N
ill), but the same logic can also be applied to describing the summer peak and winter lull in illnesses. Let the number of beef-related illnesses in a given month be denoted as N
ill(t), which is a function of the various components during month
Comparison and manipulation of these relationships can help identify possible causative links that determine areas for additional research or as a first step in policy development.
Results
The fitting of the models is described for each of the five data sets and a summary of seasonal patterns is provided. The results of these analyses are then combined, and we describe how the relationships can be used to determine the contribution of storage and cooking practices on E. coli O157:H7 illnesses.
E. coli O157:H7 prevalence in ground beef
Figure 1 shows the monthly proportion of positive ground beef samples from 2000 to 2008. One of the distinguishing features of the graph is that there are large peaks in the early and later years of data collection. A second distinguishing feature is the large amount of variability exhibited during the first 48 months. The large monthly variation in the first 48 months can be attributed in part to the smaller number of samples collected each month. Specifically, the average number of samples collected per month during the first 48 months was 420 samples. The sampling rate increases during the last 48 months to an average of 937 samples per month.
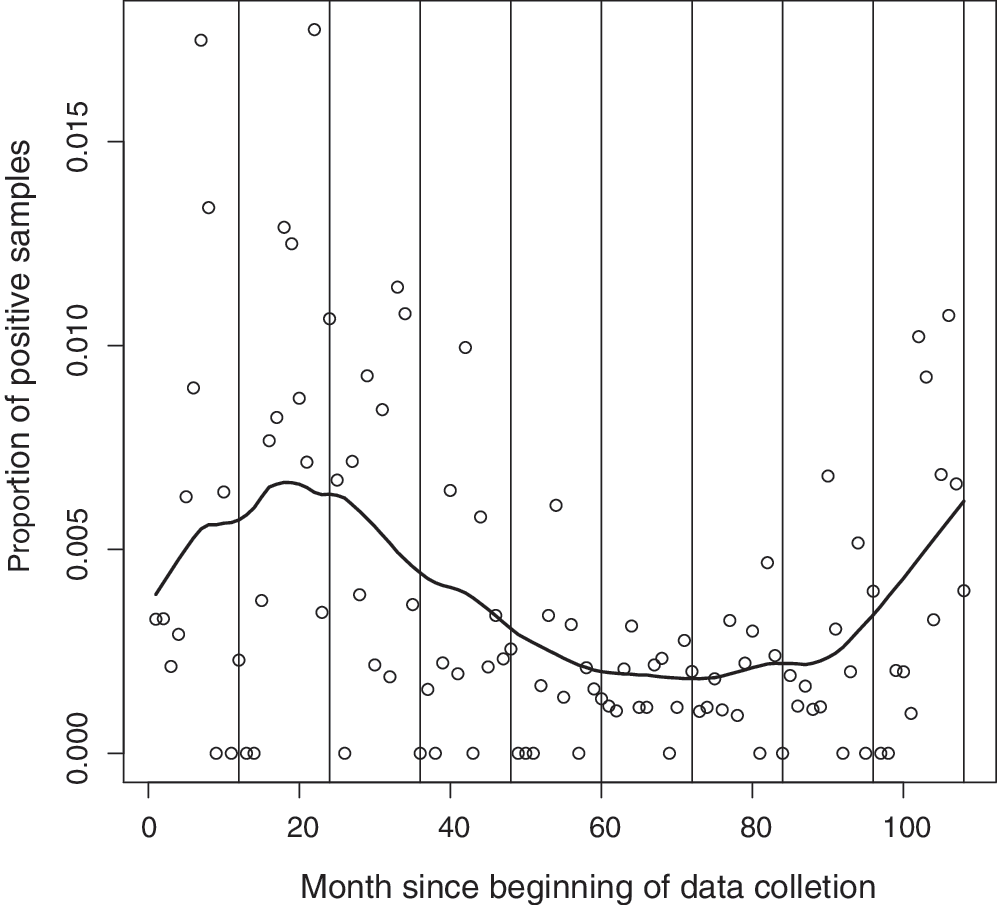
Proportion of positive ground beef samples in each month during the 9 years of data collection. The thick line represents the proportion of positive samples in each month. Vertical lines demarcate each year of data collection since the program's inception.
The month-to-month variability in the proportion of positive samples is affected by the number of samples collected each month, so some of the apparent changes in Figure 1 are due to the change in monthly sampling rates. Another factor that affects the variability is the underlying prevalence itself; as prevalence increases so does the variance of the prevalence estimator because these results reflect a binomial distribution.
A quadratic linear model for A(t) was fitted to the data to account for possible trends in prevalence. Weighted linear regression to account for changes in the number of samples collected each month. The fit of the model was adequate (p = 9 × 10⁻⁶, R 2 = 0.20), but a visual inspection of the residuals suggested a lack of fit. As an alternative, the nonparametric smoothing routine, supsmu in R, was used (Friedman, 1984). The smoothed fit (R 2 = 0.29) that represents the trend in ground beef sample prevalence is given in Figure 1. The smoothed line suggests that there was an initial drop in the proportion of positive samples, which stabilized in the 6th, 7th, and 8th year of the program and then there was a rapid rise in the proportion of positive samples in the last year for which data are available. Part of the initial drop could be the result of the implementation of a hazard analysis and critical control points (HACCP)-based inspection program that began in 1999 although other factors might also explain this pattern (e.g., changes in prevalence among live cattle). The rise in prevalence observed in the most recent years could be at least partially due to a change in an enrichment medium use for laboratory testing, although a validation study performed before implementation detected no significant differences in the enrichment medium.
After removing the annual trend from the data, the seasonal pattern is immediately apparent by examining the autocorrelation of the residuals defined by
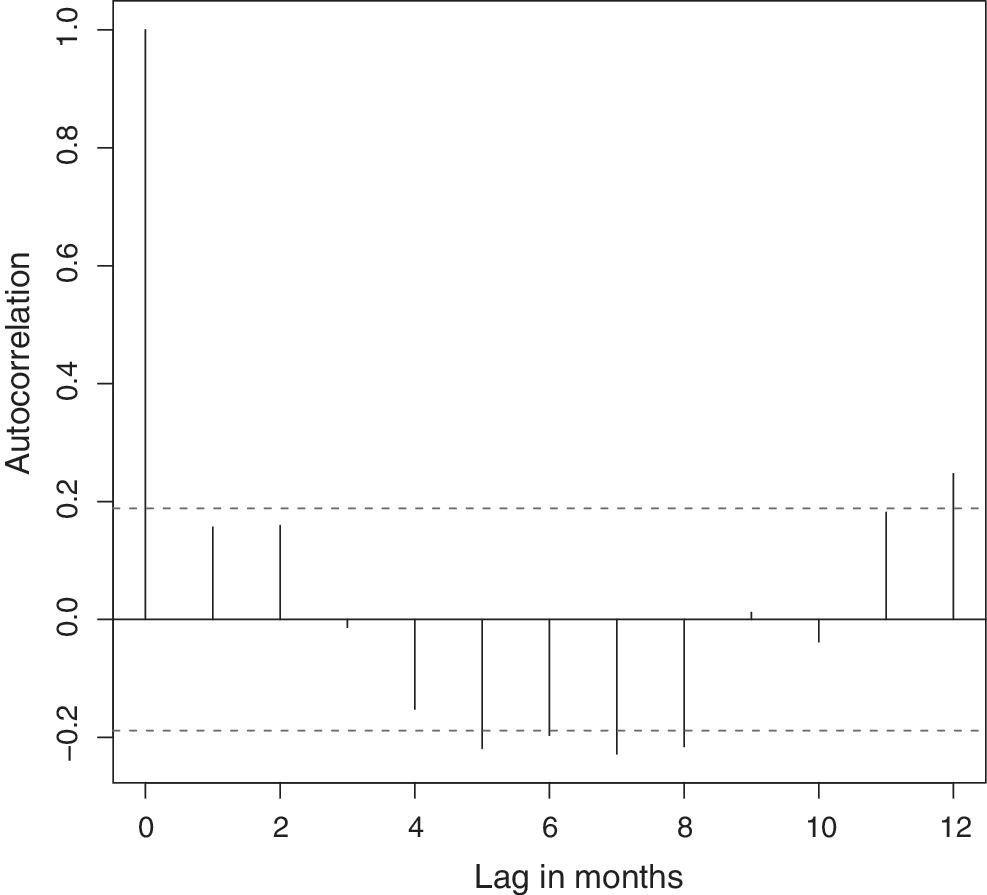
Autocorrelation for the prevalence of positive samples in ground beef sampling for 12 months. A significant seasonal effect is apparent, indicating a sinusoidal pattern to the residuals. The estimated autocorrelation does not account for the change in sample size.
E. coli O157:H7 human illnesses
The timeframe and structure of the human illness data set is nearly identical to the ground beef sampling data set. The same nonparametric smoother (supsmu in R) was used to adjust for a weak trend in the data. The smoothed line suggests a trend in the number of illnesses somewhat different from the pattern seen in the ground beef data (Fig. 3). The rate of human illness appears relatively constant over this time, while ground beef prevalence exhibited a more dramatic upward trend in recent years.
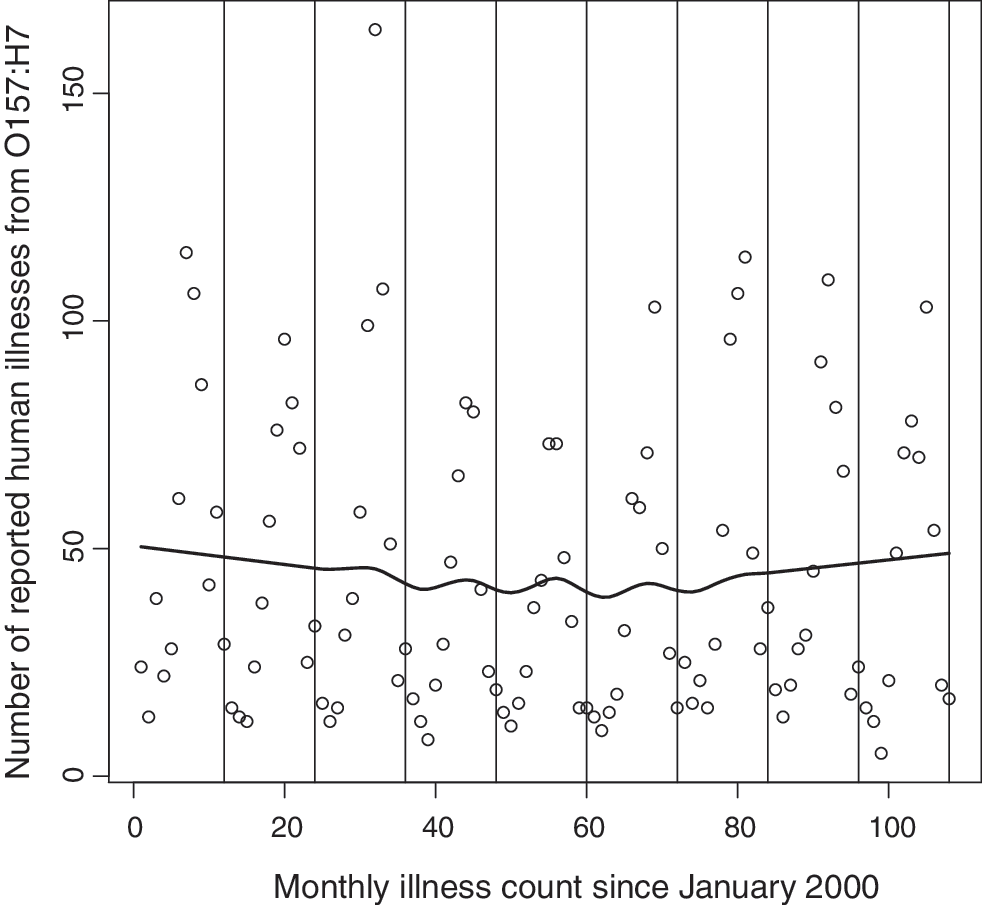
Number of human illness reported to FoodNet and the trend in human illnesses between January 2000 and December 2008. Vertical lines demarcate each year of data collection since January 2000. The thick line represents the smoothed trend in human illnesses.
An assessment of the autocorrelation across months indicates a very strong seasonal pattern (Fig. 4). The best-fitting model to the residuals indicates the peak number of illnesses occurs in July (β = 33.97, p = 2.0 × 10⁻¹⁶, R 2 = 0.58).
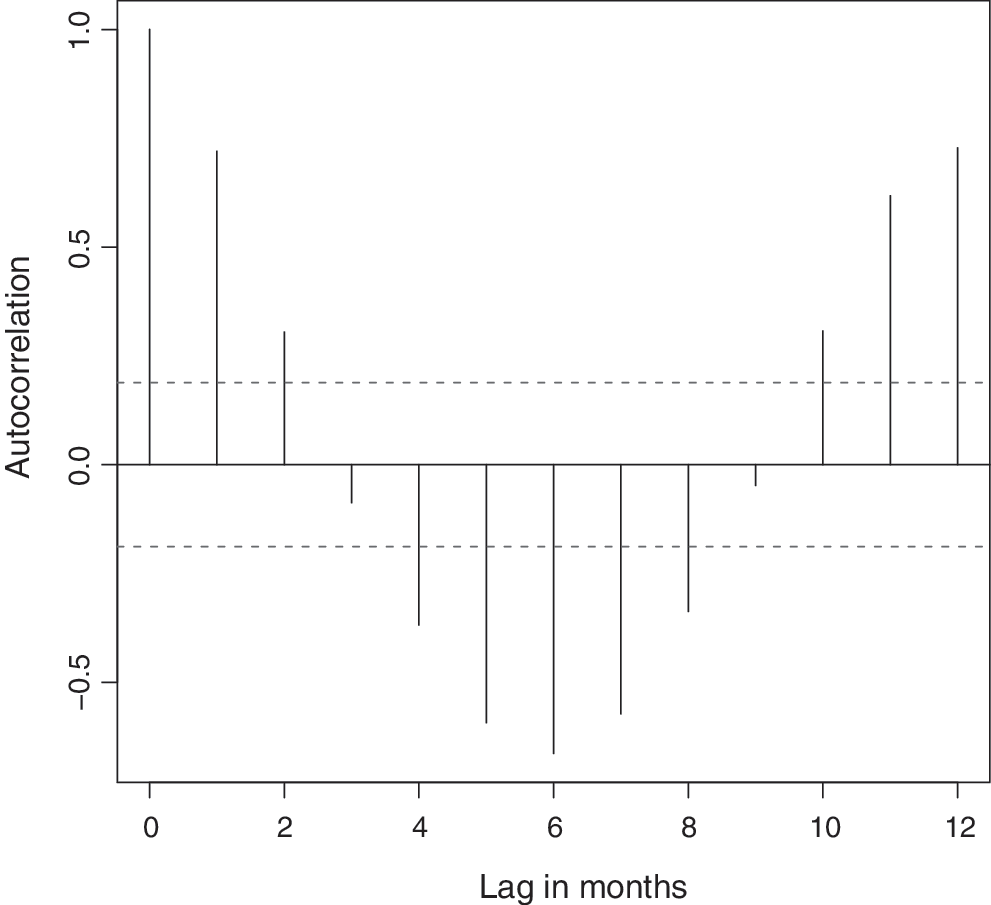
Autocorrelation between months for the human illness data. The seasonal rise and fall of human illnesses exhibits a very strong cyclical pattern.
E. coli O157:H7 foodborne outbreaks
Outbreaks of E. coli O157:H7–related illnesses occur too infrequently to model trends or monthly patterns without collapsing the data across multiple years. For example, across the 10 years of outbreak data, there was only one outbreak in the month of February. The need to collapse the data across multiple years meant that the annual trend component of the model was set to the average of the response variable across all years.
Significant seasonal trends were observed in the both the total number of E. coli O157:H7 outbreaks, denoted Z all_outbreaks (t) (β = 10.32, p = 1.3 × 10⁻³, R 2 = 0.66), and the number of outbreaks that were attributed to beef, denoted Z beef_outbreaks (t) (β = 4.79, p = 3.3 × 10⁻³, R 2 = 0.59). The best fitting seasonality models for both response variables had the peak numbers of outbreaks occurring in July.
Analysis of the proportion of outbreaks attributed to beef found no significant seasonal pattern in this response variable, with Z beef_outbreaks (t) / Z all_outbreaks (t) = 0.47. Assuming a proportional relationship between the fraction of outbreaks and the fraction of total illnesses suggests that the fraction of all E. coli O157:H7 illnesses attributed to beef remains constant throughout the year. This may suggest that other sources of E. coli O157:H7 illnesses, such as contamination of produce and direct contact, may ultimately be related to the fluctuation in the cattle reservoir, though such a linkage is beyond the scope of this study.
Prevalence of E. coli O157:H7 in live cattle
Because cattle prevalence data collection did not occur in some months, the dataset is not amenable to the modeling techniques for trends used on the ground beef and human illness data. To account for trends in the data, the year of data collection was treated as a factor variable and a linear model was used to determine if the average annual prevalence differed with the year of data collection. Given the lack of differences between the year of data collection, the model A(t) = 0.21 was used (p = 0.0012).
The best fitting seasonality model had peak cattle prevalence occurring in June of each year with β = 0.23, p = 8.0 × 10⁻⁴, R 2 = 0.54.
Ground beef consumption
The total beef available for consumption for each month was expressed as a proportion of the annual average production. No significant trend in production was observed across the 4 years spanned by the data set. Using the data in this format allowed the trend model component to be set to one (i.e., A(t) = 1) and the data were combined across the years. The best fitting seasonality model had peak production of ground beef occurring in June of each year with β = 0.07, p = 2.7 × 10⁻³, R 2 = 0.58.
Comparison of seasonal trends in E. coli O157:H7 in live cattle, raw ground beef, and humans
The transformed seasonal components suggest that ground beef prevalence and human illness are nearly proportionally related. Similarly, the seasonal pattern in cattle prevalence suggests that this metric is also nearly proportional to ground beef prevalence and human illnesses, but the peak in cattle prevalence precedes the other two components by 1 month. In contrast, the seasonal pattern in beef consumption does not appear to change across seasons in a proportional relationship with the other metrics (Fig. 5). While these correlations describe logical relationships across the pathways to eventual human illness, the data and analyses cannot support direct causality.
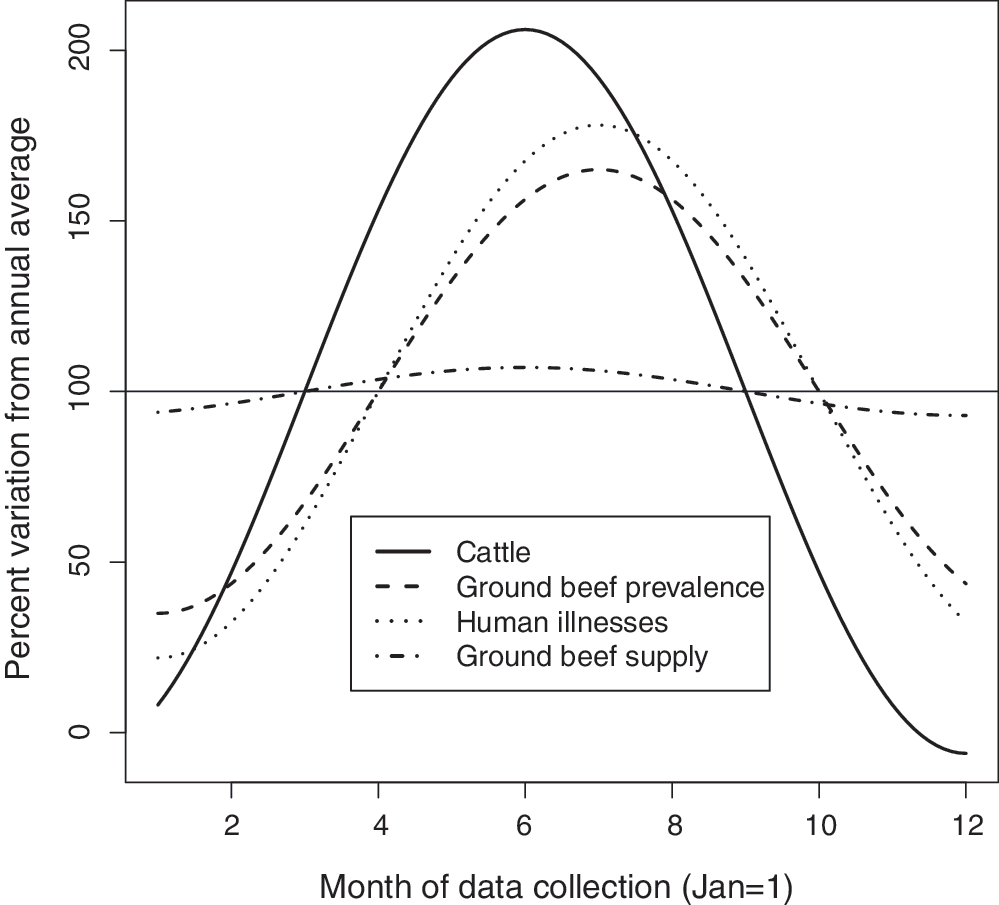
Seasonal variation, expressed as a percentage of the mean, for each of the four data sets demonstrating seasonal patterns. There is a roughly 1-month lag between the peaks in cattle prevalence and the peaks for ground beef and human illness. Seasonal patterns are not given for the outbreak dataset because no pattern in the proportion of beef-related illnesses was found.
Assessing the contribution of seasonal cooking and handling habits on E. coli O157:H7 illnesses
A plausible explanation for the increase in E. coli O157:H7 illness during the summer is poor consumer storage and cooking practices associated with meals prepared and cooked outdoors (e.g., picnics and barbeques). If these practices are major contributors to human illness, then an effective mitigation strategy could be additional labeling and consumer education regarding the need to maintain meat products at temperatures sufficiently low to avoid bacterial growth during transportation to outdoor venues and to cook products to a sufficient temperature when grilling. Conversely, if summer storage and cooking practices are not responsible for a large proportion of summer illnesses, a more effective mitigation strategy would reduce the seasonal effect of E. coli O157:H7 contamination at the preharvest stage or during the production and processing of beef. The goal of the analysis presented is to demonstrate the utility of the factorization given in Equations (1) and (2) by looking for evidence to support or refute the notion that summer cooking practices are responsible for a large proportion of the increase in E. coli O157:H7 illnesses.
From our previous analysis of seasonal patterns (Fig. 5), we can relate the average annual values to their summer peaks (i.e., July or t = 7) as follows:
These relationships imply that there are about 1.78 times as many illnesses in July, 1.65 times as many exposures in July, and about 7% increase in the number of servings in July relative to the annual averages for these metrics. Note that either the total number of illnesses or the number of beef-related illnesses could be used in this analysis because no seasonal pattern was found in the proportion of illnesses due to beef consumption.
There is interest in determining if the surveillance evidence supports the hypothesis that summer storage and cooking practices are important factors in the observed increase in E. coli O157:H7 illnesses during the summer. If these two factors contribute to a substantial increase in illnesses, the ratio of
This relationship suggests that
This conclusion should be qualified by noting that this analysis does not support the conclusion that no differences exist in the risk of illness associated with seasonal cooking and storage practices. Instead, the analysis simply suggests that differences in storage and cooking during the summer do not explain the change in incidence of illnesses throughout the year.
Discussion
This study demonstrates the advantages of a common framework for modeling seasonality across multiple data sets. Our methods converted the different response variables to monthly indices. Such an approach provides a common basis for comparison of live cattle prevalence, ground beef prevalence, and human illness occurrence. The monthly indices were calculated relative to annual averages regardless of the response variable. The analysis demonstrates that the seasonal change in the prevalence of contaminated ground is likely the primary driving factor behind human illness. Consequently, food-safety policies or programs, which focused solely on summertime consumer behavior, would likely be a poor use of a regulatory agency's limited resources.
Independently, the interpretation of the response variables in each of the datasets considered in this analysis is arguable. The surveillance systems that generated these data are not designed to demonstrate seasonality. The detection methods used are imperfect; some systems sample limited geographic areas and/or represent surrogates for the true variable of interest. Nevertheless, the comparative analysis completed here is a compelling synthesis of the seasonal patterns of E. coli O157:H7 occurrence among live cattle, ground beef, and humans.
Mathematically, this analysis of E. coli O157:H7 occurrence suggests that a proportional relationship exists for the occurrence on both a seasonal and annual basis, that is,
Because it simplifies predictions about the ultimate effectiveness of food safety controls, the concept of a proportional relationship between live cattle occurrence, occurrence within ground beef, and occurrence of human illness is appealing from a public policy perspective.
It is fortuitous, if not meaningful, that the seasonal pattern for the prevalence of E. coli O157:H7 in live cattle precedes by approximately 1 month relative to ground beef and human illness. It is reasonable to expect some delay in the propagation of increased live cattle prevalence through slaughter, ground beef production, retail distribution, and home storage and preparation systems. Our results suggest that live cattle prevalence is a leading indicator of increasing prevalence in ground beef and incidence of human illnesses. Nevertheless, it should be noted that the live cattle prevalence data in our analysis were probably the least nationally representative data. Compared to the Federal government's surveillance systems for ground beef and human illness, the cattle data were not as comprehensive or supportive of expansive time series analysis.
The seasonal patterns described by this analysis are not predictive of any particular year. Instead, these results describe the seasonal patterns for an average year and effectively ignore annual trends. This analysis does not prove the suggestion of causative links between cattle prevalence, ground beef prevalence, and resulting human illness, although this suggestion is an intuitively appealing interpretation of our findings. Future research might examine specific causative factors for prevalence of E. coli O157:H7 in ground beef and related human illnesses as a function of live cattle occurrence, but the live cattle data used here are too limited. Regular surveillance of cattle occurrence will be required to begin developing predictive (rather than descriptive) time series models.
In our mathematics, beef-related human illnesses are the product of the frequency of contaminated servings [N servings × P(exp)] and severity [P(ill|exp)]. This analysis suggests that severity has no seasonal pattern, but frequency does. In other words, the variability in dose per contaminated serving is unaffected by season of the year (recalling that P(ill|exp) results from an integration across all contaminated servings), but the occurrence of contaminated servings is higher in the summer months and lower in the winter months. This somewhat surprising result contradicts a study in Scotland (Ogden et al., 2004) that suggests the levels of shedding are predictive of human illnesses. However, it should be noted that cattle prevalence in the Scottish study was highest in the winter months and it is felt that a higher proportion of Scottish illnesses are linked to direct animal contact, so direct comparison of the two populations is not appropriate.
Public food safety policy could control the risk of human illness by reducing severity (i.e., reducing the occurrence of beef servings with high levels of E. coli O157:H7) and/or frequency (i.e., reducing the occurrence of contaminated servings). The seasonality of frequency is an opportunity to control this risk. Improvements in slaughter dressing practices during the high prevalence season might reduce the probability of contaminated servings to levels observed in the low prevalence season. A number of different interventions are currently in use, with the list including the use of steam cabinets, animal washes, chemical carcass rinses, and end-product pasteurization. Most ground-beef producers currently employ at least one of these interventions during production. Nevertheless, the use of multiple interventions is likely to provide an additional reduction in contamination.
Reducing the seasonal prevalence spike among live cattle could achieve the same objective. Further, if preharvest controls (e.g., vaccination or probiotics) are effective, then ancillary benefits will accrue. For example, if cattle are a primary source of E. coli O157:H7 contamination for other foodstuffs (e.g., leafy greens can be contaminated directly or indirectly by E. coli O157:H7–colonized cattle), then reducing occurrence among cattle should reduce seasonal increases in illnesses beyond beef-attributed illnesses. Effective preharvest control would also reduce the number of non-food-related E. coli O157:H7 illnesses associated with direct animal contact.
Regardless of the policy, this analysis suggests that successful reductions in the frequency of contaminated servings during the current high prevalence season will generate proportional reductions in human illness. Although policy decisions must consider the economic tradeoffs of costs and benefits, the findings of this analysis are important inputs to such economic analyses.
Footnotes
Disclosure Statement
No competing financial interests exist.
Disclaimer
The information presented here does not necessarily reflect the views or policies of the Food Safety and Inspection Service, nor does mention of trade names or commercial products constitute endorsement or recommendation for use.