
Abstract
Stochastic models are useful for estimating the risk of foodborne illness and they can be integrated, besides other sources of variability, into microbial risk assessment. A stochastic approach to evaluate growth of two strains of Listeria monocytogenes influenced by different factors affecting microbial growth (pH and storage temperature) was performed. An individual-based approach of growth through optical density measurements was used. From results obtained, histograms of the lag phase were generated and distributions were fitted. Histograms presented increased variation when the factors applied were suboptimal for L. monocytogenes and they were combined. The extreme value distribution was ranked as the best one in most cases, whereas normal was the poorest fitting distribution. To evaluate the influence of pH and storage temperature on L. monocytogenes CECT 5672 in real food, commercial samples of courgette and carrot soup were inoculated with this pathogen. It was able to grow in both soups at storage temperatures from 4°C to 20°C. Using the distributions adjusted, predictions of time to growth (102 cfu/g) of L. monocytogenes were established by Monte Carlo simulation and they were compared with deterministic predictions and observations in foods.
Introduction
To produce stochastic data, it is necessary to generate high numbers of replicates of growth curves parameters (maximum specific growth rate and lag time). To do so, absorbance data can be very useful and it has been shown that they compare well with viable counts (Dalgaard and Koutsoumanis, 2001). There are probabilistic models in the literature for Listeria monocytogenes, describing its behavior in different food substrates and under dynamic conditions (Koutsoumanis and Sofos, 2005; Xanthiakos et al., 2006; Kagkli et al., 2009), and for spoilage bacteria (Koutsoumanis et al., 2006).
Risk analysis is divided into three related but distinct components: risk assessment, risk management, and risk communication. Predictive microbiology, together with a dose–response relationship, should be the key element to perform quantitative microbial risk assessments of foods (Buchanan and Whiting, 1998). Currently, the Food and Agriculture Organization (FAO)/World Health Organization (WHO) framework of risk analysis is being implemented worldwide (Schlundt, 2000).
Monte Carlo analysis is a general method that deals with stochastic models. Examples in the field of predictive microbiology can be found in the papers by Cassin et al. (1998), Coleman and Marks (1999), Nauta (2000), Nicolai and Van Impe (1996), and Poschet et al. (2003). Monte Carlo simulation has been proposed as a tool to establish the probability of growth or inactivation of microorganisms under certain conditions (Poschet et al., 2003; Ferrer et al., 2007).
The aim of the present study was to compare the inhibitory effects of combined treatments of pH and growth temperature on the distributions of the lag times of two strains of L. monocytogenes and to establish the time before a certain level of growth was achieved. To achieve this, a Monte Carlo simulation was carried out. Results were compared with those obtained for two food substrates (courgette and carrot soup).
Materials and Methods
Bacterial strain
The strains used in the experiments were L. monocytogenes CECT 5672 and 4031 (from Spanish Type Culture Collection, CECT, Valencia, Spain). Both were stored on tryptic soy agar (TSA; Scharlau, Barcelona, Spain) slants at 6°C and subcultures were grown in tryptic soy broth (TSB; Scharlau) with addition of 0.6% yeast extract (TSBYE; pH 7.3 ± 0.2).
Growth conditions
L. monocytogenes CECT 5672 and 4031 were subcultured twice in TSBYE for 24 h at 37°C before being inoculated in a microtiter plate. Growth was investigated at five different incubation temperatures (37°C, 20°C, 12°C, 8°C, and 4°C) combined with four different pH values (pH 7.4, 6.5, 5.5, and 4.5). The pH of TSBYE was modified using HCl solution (Panreac Quimica, Barcelona, Spain). All experiments performed are listed in Table 1.
Individual cell lag time mean values in each row not followed by the same superscript letter are significantly different (p ≤ 0.05).
T, temperature; Lag, individual cell lag time mean; SD, standard deviation.
Growth curves and determination of the lag phase
The dilution procedure of Francois et al. (2003) was applied to obtain single L. monocytogenes cells in the wells of a microtiter plate. Serial 10- and twofold dilutions of bacterial cultures were made in TSBYE modified at different pH, and aliquots (400 μL) were added into the wells of a microwell plate to achieve a cell concentration of 1 × 10³ to 1 × 100. To estimate bacterial growth parameters, a numerical method was used by means of detection times generated by different initial counts. The observed detection times were subjected to a transformation involving the maximum specific growth rate and the ratios between the different inoculum sizes and the constant detectable level of counts (Baranyi and Pin, 1999). The plates were incubated in the Bioscreen C automatic reader (Labsystems, Helsinki, Finland) at different incubation temperatures, and optical density (OD) was measured at 600 nm.
At predetermined intervals of time, samples were removed from wells, diluted, and plated onto TSA for viable counts. The OD of the well was recorded immediately before the sample was taken. OD values were plotted against viable counts, and calibration curves were obtained for each environmental condition.
The kinetic parameters of the single cells were estimated by the method described by McKellar and Knight (2000). The lag times of L. monocytogenes cells were obtained through the time of detection (t
d), which is the time required for the microbial population to generate a 0.15 increase in OD from the start of incubation. When t
d values are plotted against the corresponding inoculum size (calculated as ln cfu/mL), μ can be calculated as the negative reciprocal of the slope of the regression line (Cuppers and Smelt, 1993), using the following formula:
The individual cell lag times (λ) were calculated from the following formula (Baranyi and Pin, 1999):
where N d is the bacterial number at t d obtained by means of calibration curves and N 0 is the number of cells initiating growth in the considered well.
Statistical data processing, distribution fitting, and Monte Carlo analysis
Statistical data processing was performed using Statgraphics Plus 5.1 software (Statistical Graphics Corp., Rockville, MD). Histograms were made from every set of conditions showing the distribution of the lag phases. From each histogram, the most common statistical parameters (mean value, standard deviation, etc.) were determined.
Probability distributions were fitted to individual cell lag times and growth rate data using @RISK 4.5.2 Professional Edition (Palisade Corporation, Newfield, NY). Distributions were ranked using the χ 2 goodness-of-fit statistics (BestFit Users Guide, 2002; Palisade Corporation) as previously described by Li et al. (2006). The probability (p) is a measure of confidence that the fitted distribution could have generated the original dataset and ranges from 0 to 1, with 1 being the highest confidence.
Monte Carlo simulation was performed to predict the time to growth to a certain microbial concentration (102 cfu/mL, in this case). A risk assessment of L. monocytogenes in ready-to-eat foods has stated that this level of contamination (considered as low) has a low probability of causing illness (FAO/WHO, 2004). This is an important aspect to set food safety criteria when a certain level of growth or counts is recommended in a product, as part of a risk assessment study.
Eq. (2) was used to analyze the dependence of N 0 and λ on the times to reach 100 cfu/mL. The individual cell lag times were assumed to follow a gamma distribution of shape parameter β and scale parameter α. The parameters of the gamma distribution and the growth rate, μ, in each environmental condition were calculated from the detection times. The mean and the variance of λ are αβ and αβ 2, respectively.
On the other hand, the initial number of cells in a well followed a Poisson distribution, with an average of one cell per well, according to Metris et al. (2006). This distribution is widely used to represent the initial numbers of a microbial population. Hence, the following equation was used:
where P(N = 0) is the probability of having no cells in a well and is estimated as the proportion of wells without growth of the 100 wells inoculated, and m is the average number of cells per well. The number of wells inoculated with exactly one cell was approximated from the following equation: P(N = 1) = me −m .
Food experiments
The study of previous experiments in a food matrix was developed in courgette and carrot soup. Refrigerated courgette and carrot soup were purchased from a local supermarket. These foods were chosen for their pH values (pH 6.43 and 5.38, respectively), similar to those used in the initial experiments. Triplicate independent experiments per condition tested were performed. For these studies, aliquots (100 mL) of courgette and carrot soup were inoculated with L. monocytogenes CECT 5672 (102 cfu/mL) and stored at 20°C, 12°C, 8°C, and 4°C. Tests revealed that the contaminating flora in the soups was very low (below 1 cfu/100 mL). Everyday the samples were plated out on TSA.
Results and Discussion
Effect of pH and temperature on individual cell lag phase
The effect of combinations of the environmental factors temperature (4°C–37°C) and pH (4.5–7.4) on individual cell lag phase was investigated for two strains of L. monocytogenes (CECT 5672 and CECT 4031).
The mean lag phase duration for both strains increased dramatically when factors affecting microbial growth were applied, a trend that can be confirmed for temperature and pH (Table 1). Also the standard deviations were calculated and increases were found with the application of various factors, indicating that more variability in the adaptation time occurred under those conditions. The duration of the lag phase of L. monocytogenes CECT 5672 increased significantly with the decrease of the incubation temperature, for example, the mean individual cell lag phase was increasing from 1.77 h over 99.01 h to 200.20 h when temperature decreased from 37°C to 8°C and 4°C, respectively, and at pH 7.4. The effect of decreasing pH was also significant as the mean individual lag phase was increasing from 99.01 h over 185.07 h to 273.60 h when the pH was lowered from 7.4 to 5.5 and 4.5 at a growth temperature of 8°C. On the other hand, values of individual cell lag phase for L. monocytogenes CECT 4031 were significantly (p ≤ 0.05) lower than the corresponding values for L. monocytogenes CECT 5672, but the effects of the factors affecting microbial growth conditions were similar (Table 1). Individual cell lag times of strain CECT 4031 at pH 7.4 increased from 1.30 to 129.23 h when the growth temperature was decreased to 4°C.
The largest increase was found with combinations of acid pH (4.5) and growth temperature of 4°C, reaching lag values of 296.12 and 217.05 h for L. monocytogenes CECT 5672 and 4031, respectively.
Histograms of the lag values for different treatments are shown in Figures 1 and 2 for L. monocytogenes CECT 5672 and CECT 4031, respectively. Increases in the variability of histograms (due to a wider spread of the observations) representing the lag phase of individual cells (where 10- and twofold dilution procedures were used to achieve single cells per well, there were some wells where growth was not achieved) were observed.

Distributions of individual cell lag times of Listeria monocytogenes CECT 5672 grown at (), 6.5 ( ), 5.5 (
 ), and 4.5 (
 ).
).

Distributions of individual cell lag times of L. monocytogenes CECT 4031 grown at (), 6.5 ( ), 5.5 (
 ), and 4.5 (
 ).
).
For L. monocytogenes CECT 5672, grown at 12°C, significant increases in lag times and in standard deviations were observed when lower pHs were applied, which are reflected in the shift of the histogram to the right. “This meant that the adaptation period in acidic conditions became much longer.” Similar effects can be observed for all growth temperatures and for both strains (Figs. 1 and 2). It can also be observed that the variance of the lag time is generally higher with longer lag times, because of the need for an adaptation response (Table 1). A similar observation was made by Smelt et al. (2002), who studied the lag times of individual cells of Lactobacillus plantarum after sublethal injury.
Also the width of histograms varied depending on the level of factors affecting microbial growth during the growth of the cells. There was less dispersion with optimal conditions than at lower temperatures or pHs (Fig. 2A, B).
The shape of the histogram changed when levels of factors tested increased. The highest density of observations in the curve (skewness) was situated at the left side for moderate stress levels, whereas it shifted to the right one for more severe conditions, meaning that a longer adaptation period in most of the population took place.
Several authors studied the effect of the environmental factors on the individual lag phase of L. monocytogenes. A similar behavior with pH has been described in L. monocytogenes (Francois et al., 2005) and for the individual cell lag phase of L. innocua at 30°C (Metris et al., 2002). The importance of the inoculum size on growth boundary limits has also been evidenced (Koutsoumanis and Sofos, 2005). When two or more factors are combined (in our case, temperature and pH), there was a trend toward broader histograms and distributions that were shifting toward the right, as it has been also pointed out by Francois et al. (2007) in L. monocytogenes exposed to combinations of low incubation temperature, pH, and a w. This is opposed to an adaptation phenomenon as, for example, growth at low temperatures, where bacteria start growing faster, which gives a positive skew to the distributions (Francois et al., 2007).
Distribution fitting
A total of eight distributions were fitted to the 20 datasets of lag values of L. monocytogenes CECT 5672 and CECT 4031. Distribution functions were ranked according to the χ 2 statistic. The best-fit distribution to the pooled data of each treatment is listed in Table 1. The χ 2 statistic showed that in most cases the listed distributions fitted better the data. Probability (p) values were generally >0.1.
Overall, the extreme value distribution was fitted highest, being 10 times the best fit for individual cell lag times of L. monocytogenes CECT 5672 and eight times for CECT 4031. An exponential distribution was fitted by two times of the 20 datasets of L. monocytogenes CECT 5672; however, this distribution was the best fit by 10 times in individual cell lag times of L. monocytogenes CECT 4031. Logistic distribution was the best fit in only 5 of 20 conditions, being four times for CECT 5672 and one time for CECT 4031. Normal was the poorest fitting distribution, being only three times the best fit for CECT 5672 and one time for CECT 4031.
A small number of studies have examined the impact of factors affecting microbial growth on individual lag time distributions; some of them are in agreement with our results. The extreme value distribution was mentioned by Smelt et al. (2002) to describe the individual cell lag phase of Lactobacillus plantarum in MRS broth at 15°C. This distribution was also observed by Guillier and Augustin (2006), who investigated the individual lag times of L. monocytogenes for 54 combinations of initial physiological states, growth conditions, and strains, finding extreme value type II distribution as the most effective to describe the 54 observed distributions.
The differences in the conditions of growth allowed us to observe variability in the distributions between experiments. In general, when more stringent conditions were applied, our results were fitted with an extreme value distribution, for both L. monocytogenes strains. These differences were also observed by other authors, namely Francois et al. (2005), who investigated the individual lag times of L. monocytogenes cells in 26 different growth conditions, the best distributions being exponential, gamma, and Weibull when growth conditions were optimal, intermediate, and severe, respectively.
The applied distributions differ from author to author: Metris et al. (2002) and Kutalik et al. (2005a and 2005b) used a gamma distribution, whereas Wu et al. (2000) used a normal distribution. This discrepancy could be explained by different reasons: the kind of strain and its physiological states, the use of different primary models (Francois et al., 2005), or the environmental factors used.
Effects of pH and growth temperature on the lag time of L. monocytogenes in real systems
To evaluate the activity of pH and storage temperature on L. monocytogenes CECT 5672 in real food, commercial samples of courgette and carrot soup were inoculated with this pathogen. The soups were chosen by their pHs (pH 6.43 and 5.38 in courgette and carrot soup, respectively). The evolution of L. monocytogenes population was monitored over time during storage at 20°C, 12°C, 8°C, and 4°C (Figs. 3 and 4) and the ln(N d) were successively fitted by means of the Baranyi equation.
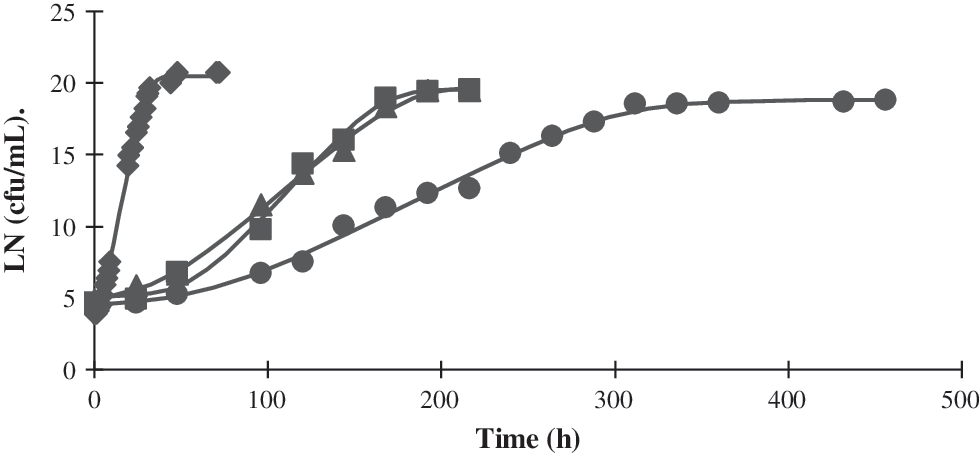
Effect of different storage temperatures on L. monocytogenes CECT 5672 inoculated in courgette soup. (♦) 20°C; (▴) 12°C; (▪) 8°C; (•) 4°C. Solid lines represent the data predicted by the model. Growth data are presented as ln.
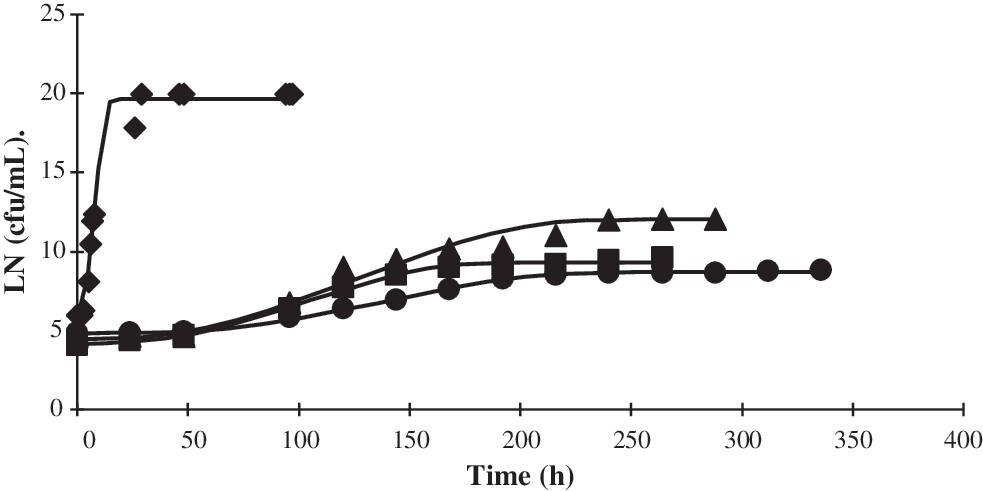
Effect of different storage temperatures on L. monocytogenes CECT 5672 inoculated in carrot soup. (♦) 20°C; (▴) 12°C; (▪) 8°C; (•) 4°C. Solid lines represent the data predicted by the model. Growth data are presented as ln.
L. monocytogenes CECT 5672 was able to grow in courgette and carrot soup at storage temperatures of 4°C, 8°C, 12°C, and 20°C. When L. monocytogenes was inoculated in courgette soup and was exposed to low growth temperature, a progressive delay in the onset of growth was observed but did not affect the maximum population density (Fig. 3).
When L. monocytogenes was grown in carrot soup at refrigeration temperatures (8°C and 4°C), the maximum population density was reduced. In this case, the growth rate decreased drastically from 20°C to 12°C (Fig. 4), which is likely due to lower pH value of carrot soup.
Monte Carlo simulation to estimate time to a certain growth
Monte Carlo simulations were carried out, considering an initial contamination of 1 cfu/mL to achieve a final concentration of 100 cfu/mL of L. monocytogenes CECT 5672 under different treatments.
Predicted times to an increase from 1 to 100 cells of L. monocytogenes, obtained from a Monte Carlo simulation, in different conditions of temperature and pH are shown in Table 2. They were compared with the values obtained from deterministic fit, and as can be seen, the values of the output parameters generated by both analyses were very close. Results were also compared with growth curves obtained for courgette and carrot soup. There was variability when comparing predictions obtained with real food systems (soups), as in some cases the growth in soups was faster than that predicted by both deterministic and stochastic models. This indicates the need to perform tests in the real conditions of the food, because predictive microbiology can give an estimate from observations in synthetic media, but there are many other factors present in foods that cannot be taken into account. In pasteurized milk, a probabilistic model revealed that L. monocytogenes could grow in the distribution and storage conditions in Greece (Koutsoumanis et al., 2010).
Mean ± standard deviation.
Changes in environmental factors produced important changes in the time to increase L. monocytogenes to 102 cfu/mL. Monte Carlo analysis allows quantification of the probability distributions of the model parameters (Poschet et al., 2003) and, in our case, gives information of the variability and distribution over the time of the predictions. When the risk of growth beyond a certain level of a foodborne pathogen is considered, an average value is not a valid information and it needs to be replaced by a probabilistic one. From this setting, it could be predicted, for example, with a probability level of 95% the time before growth to a certain level could occur. With this information, a food processor can decide the best processing conditions according to the level of risk it is ready to accept in the product. Monte Carlo simulation has been also used to establish the influence of parameters on microbial load by pulsed electric fields (Ferrer et al., 2007) and it is a useful tool for implementation of microbiological data in microbial risk assessment.
This is an important aspect to set food safety criteria when a certain level of growth or counts is recommended in a product, as part of a risk assessment study.
Footnotes
Acknowledgments
Dr. Marina Muñoz thanks Fundación CAJAMURCIA for awarding her a fellowship. This project was funded by Ministerio de Educación y Ciencia Español (ref. AGL 2006-13320-C03-02/ALI).
Disclosure Statement
No competing financial interests exist.