
Abstract
Molecular typing of Vibrio cholerae strains is a powerful tool for the surveillance of cholera. Amplified fragment length polymorphism (AFLP) is considered to be a powerful subtyping technique to distinguish bacterial strains at the genetic level. Optimization and standardization of AFLP protocol is required to allow data comparisons across different laboratories in a surveillance network. Here, we performed AFLP using different restriction enzymes and primer pairs for subtyping of V. cholerae serogroups O1 and O139 and compared the optimized AFLP protocol with pulsed-field gel electrophoresis (PFGE) to evaluate the applicability of AFLP for conducting epidemiological surveillance of cholera. The discriminatory index (D-value) of PFGE for serogroup O1 strains was similar when digested with NotI and SfiI, whereas that for O139 strains was higher for NotI digestion than for SfiI. EcoRI-G/MseI-T was the restriction enzyme and primer combination with highest discriminatory index used in the AFLP analysis. Capillary electrophoresis-based AFLP showed higher discriminatory power than that of polyacrylamide gel electrophoresis-based AFLP. When the two methods were compared using 72 epidemiologically unrelated serogroup O1 El Tor isolates, AFLP had a lower D-value than PFGE with NotI and SfiI digestions, respectively. For 54 epidemiologically unrelated serogroup O139 isolates, NotI PFGE had the highest discriminatory power, and SfiI PFGE and AFLP yielded almost the same but lower discriminatory power. We conclude that NotI and SfiI are both suitable for the PFGE of V. cholerae serogroup O1, whereas NotI should be defined as the primary enzyme for serogroup O139. The applicability of AFLP in V. cholerae subtyping and outbreak investigations is limited.
Background
AFLP, first described by Vos et al. (1995), was developed as a tool to distinguish bacterial isolates at the genetic level; subsequently, it was widely used in different organisms, including plants, animals, parasites, and bacteria. For AFLP, polymerase chain reaction (PCR) primers targeting specific sequences are ligated to either end of restriction enzyme-digested genomic DNA fragments, generating a high number of amplified fragments that can be used for analysis (Vos et al., 1995). Because AFLP generates greater number of fragments than that generated by other molecular methods, it potentially increases the level of discrimination between isolates (Savelkoul et al., 1999). AFLP has now become an established, broadly applicable genotyping method with a high degree of reproducibility and discriminatory power. AFLP has already been applied in bacterial classification, molecular typing, and genetic diversity analysis in microorganisms such as Escherichia coli (Guan et al., 2002), Yersinia enterocolitica (Fearnley et al., 2005), Neisseria meningitidis (Goulding et al., 2000), Streptococcus thermophilus (Lazzi et al., 2009), and V. cholerae (Jiang et al., 2000; Singh et al., 2001; Lan and Reeves, 2002).
Molecular typing plays an important role to identify clusters among sporadic cases, detecting potential outbreaks, and tracing the source of infections. A useful molecular typing method should cluster isolates that appear to be related (epidemiologic links) and exclude those that do not. For this purpose, sound resolving power, optimal typeability, a high degree of reproducibility, and adequate stability are required. In addition, a method should minimize analysis time, facilitate high throughput, and easy to use and interpret. Subtyping methods need to be optimized and standardized for facilitating communication between laboratories. In AFLP analysis, different restriction enzymes and/or primer combinations produce patterns of different complexities, leading to different discriminatory powers (Janssen et al., 1996). Different PCR and electrophoresis systems have different resolution powers, thereby affecting the discriminatory power of PCR-based molecular subtyping methods (Brusetti et al., 2008). There is no comparison on discriminatory power of AFLP and PFGE in V. cholerae in their molecular epidemiological applications, whereas the potential use of these methods should be addressed. In this study, we optimized the AFLP protocol for subtyping of V. cholerae O1 and O139 strains and further compared the ability of typing between AFLP and PFGE.
Materials and Methods
Bacterial strains
We used 157 strains of V. cholerae isolated in China, including 90 serogroup O1 strains (89 El Tor biotype and 1 classical biotype) and 62 serogroup O139 strains. In addition, four reference O1 strains (strains N16961 and 6312 of El Tor biotype and strains O395 and 569B of classical biotype) and reference O139 strain MO45 were used. All the isolates (except reference strains) were isolated in different years (1961–2006) and from different provinces of China; the strains were isolated from patients, environmental water samples, and fishery products. They were normally isolated using Gentamicin Selective Agar or thiosulfate citrate bile salt sucrose agar and identified by using the V. cholerae diagnostic sera and biochemical tests. The cholera toxin gene (ctxAB) was detected in the strains by PCR using the following primers: 5′-ATTTTGAGGTGTTCCATGTG-3′ and 5′-ATAAAGCAGTCAGGTGGTCT-3′. The source, serotype, and date of isolation of all the strains are described in Supplementary Table S1 (Supplementary Data are available online at
Pulsed-field gel electrophoresis
We used the PulseNet 1-day standardized PFGE protocol for V. cholerae (Cooper et al., 2006). Cell suspensions were placed in polystyrene tubes (Falcon; 12 × 75 mm), and their optical density was adjusted to 4.0–4.2 using the Densimat photometer (BioMérieux, Marcy l'Etoile, France). V. cholerae slices were digested using 20 U per slice of SfiI or NotI (New England Biolabs, Ipswich, MA) for 4 h at 50°C or 37°C. The electrophoresis was performed using a CHEF-DRIII system (Bio-Rad Laboratories, Hercules, CA). Images were captured on the Gel Doc 2000 system (Bio-Rad Laboratories) and converted to TIFF files for computer analysis.
Capillary electrophoresis-based AFLP
We used three enzyme combinations (EcoRI/MseI, ApaI/TaqI, and HindIII/TaqI) for CE-AFLP performed using a PE Applied Biosystems ABI Prism® 3730 instrument. In all, 16 sets of one-base selection were used for ApaI/TaqI and HindIII/TaqI. The sequence of adaptors and primers were from a previous report (Jiang et al., 2000). The procedures used for template DNA preparation and PCR amplification were as described by Janssen et al. (1996), with slight modifications. In brief, 240 ng of total genomic DNA was digested with restriction enzyme ApaI (New England Biolabs) or HindIII (New England Biolabs) at 25°C or 37°C (depending on the optimal temperature for enzyme activity) for 3 h, and then TaqI (New England Biolabs) was added and incubated at 65°C for 3 h. After digestion, the sample was incubated at 80°C for 20 min for the inactivation of the restriction enzyme. Next, 1.25 μM of TaqI adapters and 0.125 μM of ApaI or HindIII adapters were added. Ligation reactions were performed at 16°C overnight. The ligation mixture was diluted 1:10, and 3 μL of the mixture was used for preamplification using nonselective primers. Preamplification was performed using 15 μL AFLP Amplification Core Mix (PE Applied Biosystems, Foster City, CA) plus 1 μL of preamplification primers (30 ng/μL). Preamplification was performed as follows: initiation at 72°C for 2 min, followed by 20 cycles of 94°C for 0.5 min, 56°C for 1 min, and 72°C for 1 min, and then 72°C for 7 min. For selective amplification, 3 μL of diluted PCR products (1:10) from preamplification was mixed with 15 μL of AFLP Amplification Core Mix (PE Applied Biosystems), 1 μL unlabeled selective primer (5 μM), and 1 μL 6′-carboxyfluorescein-labeled selective primer (5 μM). The basic cycling parameters were as follows: one cycle of 94°C for 0.5 min, 65°C for 0.5 min, and 72°C for 1 min, followed by 11 cycles with the annealing temperature reduced by 0.7°C at each cycle, and 23 cycles with 94°C for 0.5 min, 56°C for 0.5 min, and 72°C for 1 min.
For EcoRI/MseI digestion, the EcoRI-G/MseI-T primer combination was used. The restriction enzyme digestion/ligation and preselective and selective PCR steps were performed as described in the AFLP™ Microbial Fingerprinting Protocol Handbook (PE Applied Biosystems). Core reaction mixtures for the PCR were obtained from PE Applied Biosystems. Adaptor sequences with MseI and EcoRI ends, as well as primers for the preselective and selective PCRs, including the 5′-labeled EcoRI selective primer, were used as described elsewhere (Vos et al., 1995).
PCR products were analyzed by capillary separation along with an internal size standard (GeneScan® ROX-500 size standard; PE Applied Biosystems) on a PE Applied Biosystems ABI Prism® 3730 instrument. The data were saved as *.fsa files and processed by GeneMarker version 1.71 software (SoftGenetics LLC, State College, PA). The bands between 30 and 500 bp were included, and the presence and absence of all the bands were confirmed manually for obtaining precise results. The strain N16961 was used as the positive control strain in each PCR and capillary electrophoresis run.
Polyacrylamide gel electrophoresis-based AFLP
For EcoRI/MseI digestion, the EcoRI-G/MseI-T primer combination was used for AFLP based on polyacrylamide gel electrophoresis. Template DNA preparation and PCR amplification were performed using the IRDye® Fluorescent AFLP® kit for Large Plant Genome Analysis (LI-COR Biotechnology, Lincoln, NE), according to manufacturer's recommendations. PCR products were separated on polyacrylamide sequencing gels using the LI-COR Global 4300 Sequencing System (LI-COR Biotechnology). The AFLP data from LI-COR sequencer were imported to SagaMX software (LI-COR Biotechnology) and transformed to excel files. The bands between 50 and 700 bp were included, and the presence and absence of all the bands were confirmed manually for obtaining precise results.
Data analysis
The PFGE patterns and AFLP data were analyzed using the BioNumerics version 4.0 software (Applied Maths, Kortrijk, Belgium) and confirmed by visual inspection. The similarity between two patterns was expressed as a Dice coefficient. The Dice coefficient (S D) (Dice, 1945) is calculated as follows: S D =[2(n xy)]/(n x + n y), where n xy is the number of bands common to isolates X and Y, n x is the total number of bands for isolate X, and n y is the total number of bands for isolate Y. Dendrograms were clustered and constructed by using the unweighted pair group method using arithmetic averages.
Discriminatory index
The discriminatory power of PFGE and AFLP was compared using Simpson's index of diversity (Hunter and Gaston, 1988). It was calculated using the following equation: D = 1 − ∑[nj (nj − 1)]/[N(N − 1)], where nj is the number of strains belonging to the jth pattern, and N is the number of strains in the population. The D-value obtained from this equation can be applied to directly compare typing methods.
Results
PFGE analysis
For the PFGE analysis, 72 O1 and 54 O139 epidemiologically unrelated strains of V. cholerae (Supplementary Table S1, strain panel 1) were selected. For the 72 O1 strains, NotI and SfiI restriction digestions produced 69 and 70 different pulsotypes with D-values of 0.9977 and 0.9992, respectively (Table 1 and Supplementary Fig. S1). For the 54 O139 strains, NotI and SfiI restriction digestions produced 44 and 27 different pulsotypes with D-values of 0.9881 and 0.8127, respectively (Table 1 and Supplementary Fig. S1).
AFLP, amplified fragment length polymorphism; PFGE, pulsed-field gel electrophoresis.
We then selected 24 O1 strains isolated during the period of a cholera epidemic (during 2005 from different provinces) and 10 O139 isolates from four different O139 cholera outbreaks (Supplementary Table S1, strain panel 2), to evaluate the efficacy of using PFGE in epidemic and outbreak investigations. For the 24 O1 isolates, both NotI and SfiI digestions successfully discriminated the nontoxigenic and toxigenic strains (Ogawa and Inaba strains, which were isolated during the same period) and clustered all the epidemical Inaba strains, producing three and seven different pulsotypes, respectively (Fig. 1). NotI clustered 17 of the 19 Inaba strains (89.5%) together, whereas SfiI separated these strains into more patterns, but with higher similarity coefficients. For the 10 O139 strains, all the strains from the same outbreak had the same pattern. PFGE performed using NotI produced three patterns for the strains isolated from among the four outbreaks, whereas that performed using SfiI yielded two patterns; the strains of Outbreak 4 were not discriminated from those of Outbreaks 2 and 3 (Fig. 2). The results of the epidemiologically unrelated strains and the strains isolated during a 1-year epidemic showed that NotI and SfiI could efficiently discriminate O1 strains, although SfiI had slightly higher discrimination power. However, for serogroup O139, NotI showed considerably higher discrimination power than that of SfiI.
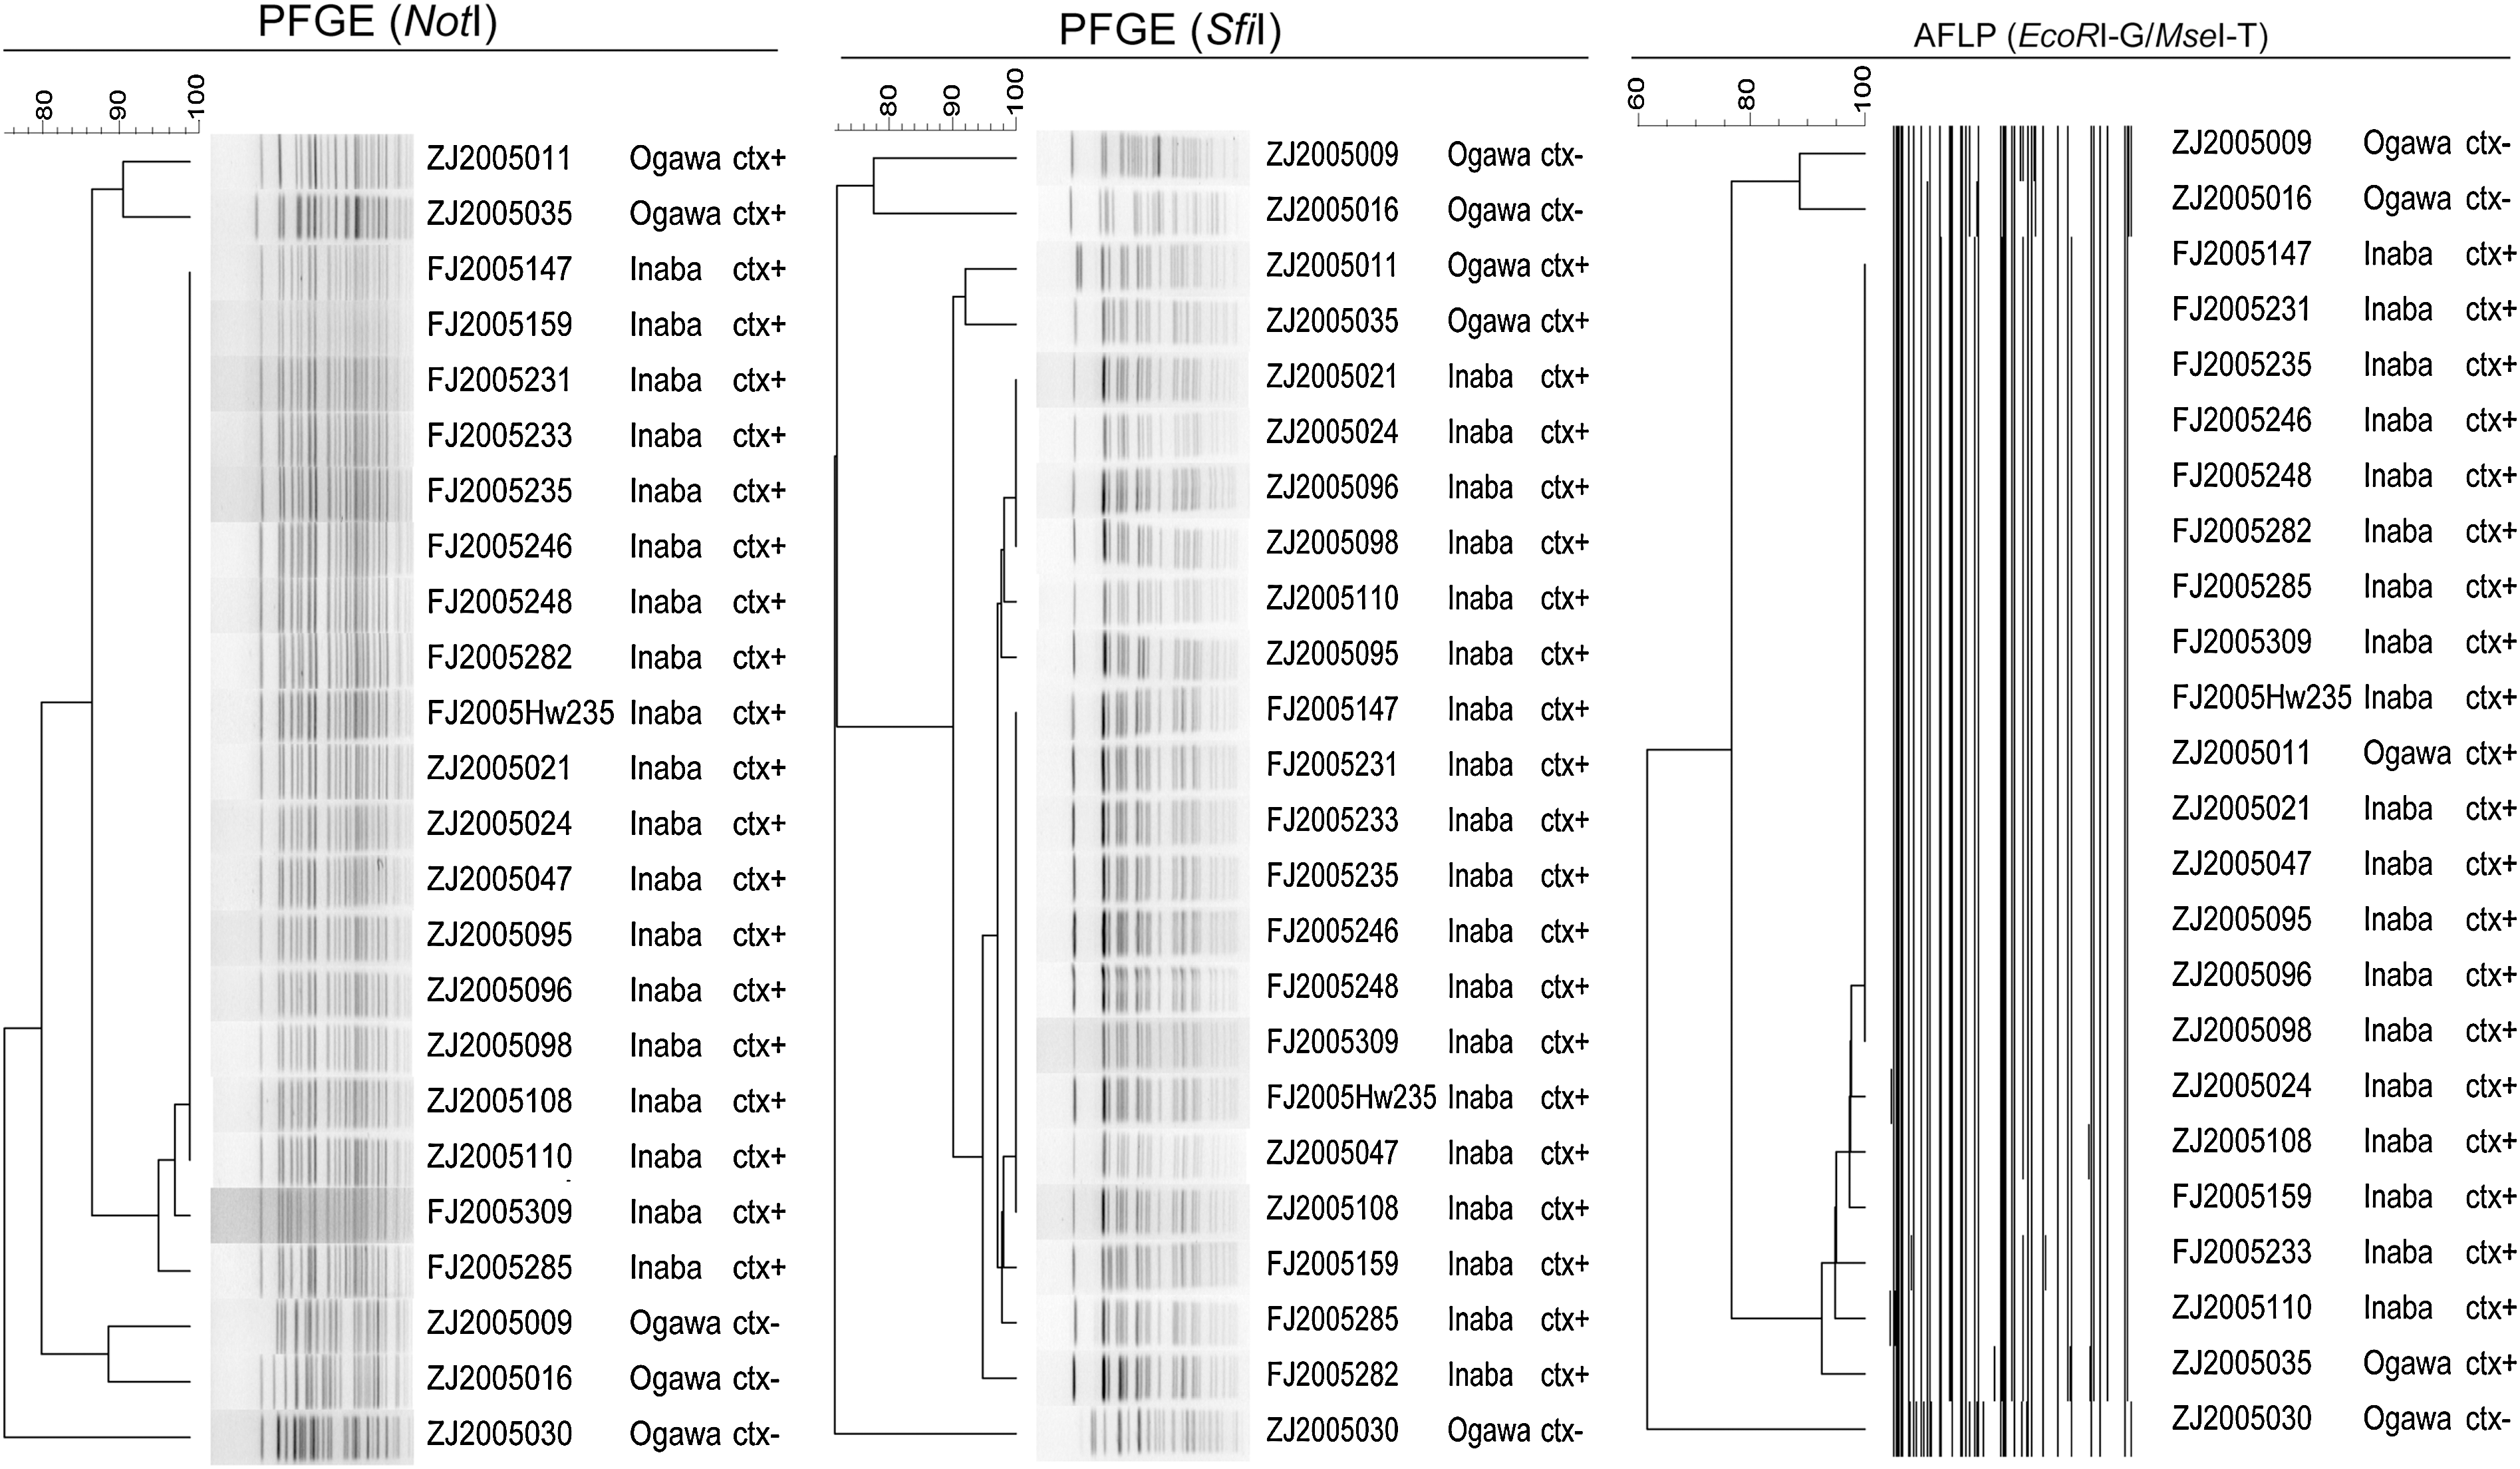
Clustering of 24 O1 Vibrio cholerae strains isolated from the same period by using PFGE (NotI and SfiI, respectively) and AFLP (EcoRI-G/MseI-T). The serotypes and presence or absence of ctxAB are also listed on the right of each strain. The serotype Inaba strains with ctxAB presence belonged to an outbreak, and other strains were isolated from the same period of this outbreak. AFLP, amplified fragment length polymorphism; PFGE, pulsed-field gel electrophoresis.
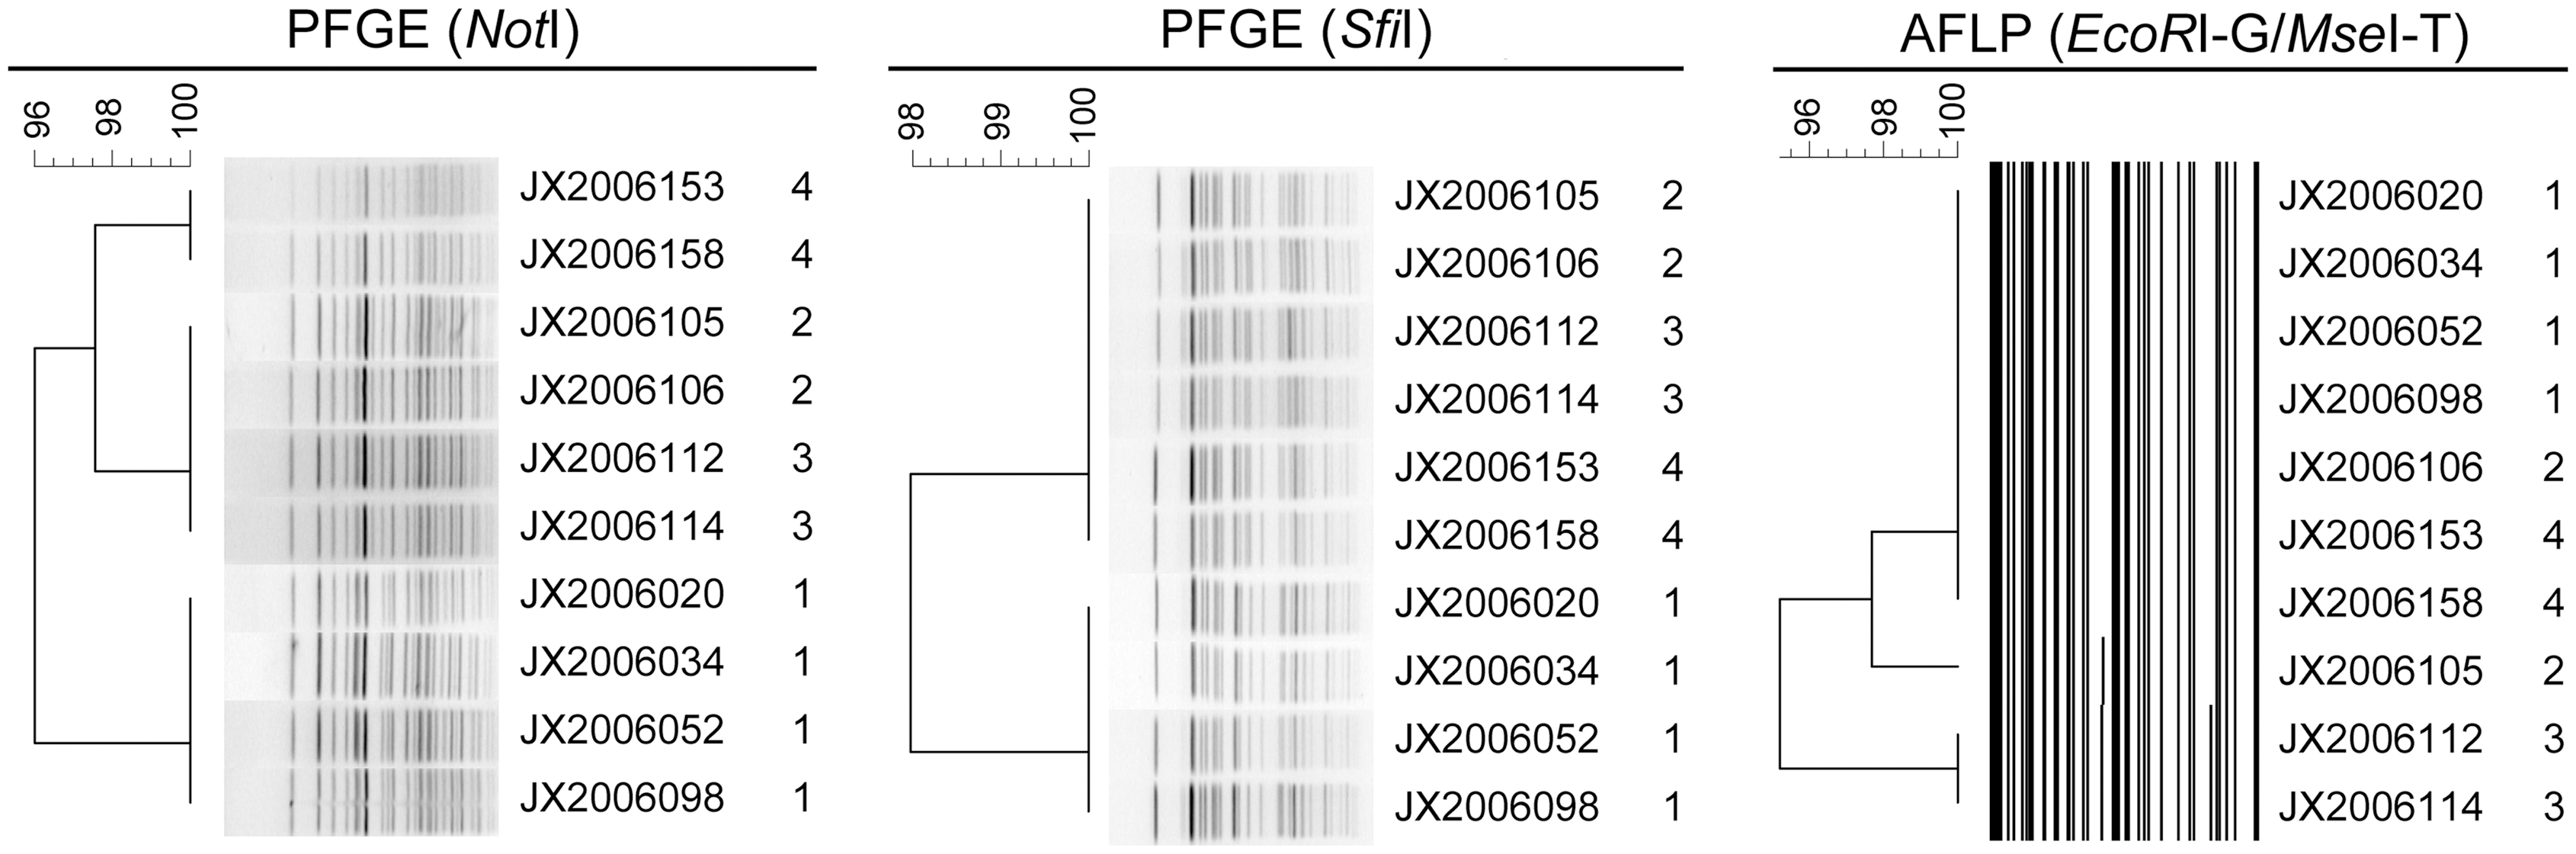
Clustering of 10 O139 V. cholerae strains isolated from 4 outbreaks by using PFGE (NotI and SfiI, respectively) and AFLP (EcoRI-G/MseI-T). The serial number of outbreak is also listed on the right of each strain.
Optimization of AFLP protocols
For AFLP analysis of V. cholerae, previous studies have reported the use of three enzyme combinations, namely, EcoRI/MseI, ApaI/TaqI, and HindIII/TaqI (Jiang et al., 2000; Singh et al., 2001; Lan and Reeves, 2002). In this study, we first selected 47 isolates (Supplementary Table S1, strain panel 3) with different PFGE patterns, which indicated that there were differences within the genomes of these strains, to optimize the primer pairs of each enzyme combination in capillary electrophoresis (CE-AFLP). The bases added to the 3′ end of selective primers in AFLP were the key factors for the number and distribution of bands obtained, which directly influence the discriminatory power of AFLP with specific enzyme combinations. For ApaI/TaqI digestion, all 16 ApaI-N/TaqI-N primer pairs were used (“-N” means the base, A, G, T, or C, which was added to selective amplification primers). The D-values obtained for each primer combination were between 0.2025 and 0.8964; of the primer combinations, ApaI-T/TaqI-C yielded the highest discriminatory power (Supplementary Table S2). Similarly, for HindIII/TaqI digestion, all 16 HindIII/TaqI +1/+1 primer combinations were used for the 47 isolates, yielding a set of D-values between 0.3821 and 0.9306, and the HindIII-A/TaqI-A combination yielded the highest discriminatory power (Supplementary Table S2). The discrimination of AFLP was improved by combining results generated with different enzyme–primer combinations. For EcoRI/MseI digestion, the EcoRI-G/MseI-T primer combination showed the highest discriminatory power in our previous study (Lou et al., 2007) and also in the study by Lan and Reeves (2002). In this study, EcoRI-G/MseI-T yielded more polymorphic bands and higher D-value of 0.9426 than that for the ApaI-T/TaqI-C and HindIII-A/TaqI-A combinations. Hence, EcoRI-G/MseI-T was used as the enzyme and primer combination in further CE-AFLP analyses in this study.
In AFLP analysis, PCR amplicons are generally separated by CE-AFLP or polyacrylamide gel electrophoresis (PAGE)-AFLP. In our previous study, EcoRI-G/MseI-T yielded the highest discriminatory power (Lou et al., 2007); hence, EcoRI-G/MseI-T was considered as the optimal primer combination in PAGE-AFLP. A panel containing 45 of each O1 and O139 strains (Supplementary Table S1, strain panel 4) was used to compare CE-AFLP and PAGE-AFLP using the same enzyme and primer combination (EcoRI-G/MseI-T). In this study, PAGE-AFLP yielded more fragments than those yielded by CE-AFLP. However, PAGE-AFLP divided the 90 epidemiologically unrelated strains of V. cholerae into 38 different patterns and had a D-value of 0.8252, whereas CE-AFLP divided the strains into 45 different patterns and yielded a D-value of 0.9004 (Supplementary Fig. S2 and Table 2). Thus, CE-AFLP was used for further analyses.
Comparison of AFLP and PFGE in V. cholerae subtyping
The 126 epidemiologically unrelated strains (Supplementary Table S1, strain panel 1) of V. cholerae serogroups O1 and O139 could be distinguished at the strain level using the EcoRI-G/MseI-T combination (Supplementary Fig. S1), generating 80 different patterns and yielding a D-value of 0.9552. Within these strains, 54 AFLP patterns were found in the 72 O1 strains, with a D-value of 0.9808. In the 54 O139 strains, 26 patterns were found, with D-value of 0.7881 (Table 1). On the basis of these results, we concluded that both PFGE and AFLP had the ability to type all V. cholerae strains used in this study. For O1 strains, AFLP with EcoRI-G/MseI-T yielded a D-value >0.98, and PFGE had a slightly higher discriminatory power, with a D-value >0.99 for both NotI and SfiI restriction digestions. For O139 strains, NotI PFGE had the highest discriminatory power, whereas SfiI PFGE and AFLP had lower discriminatory power.
We then analyzed the isolates from cholera epidemics and outbreaks (Supplementary Table S1, strain panel 2), to assess the clustering analysis of AFLP. In the 24 O1 isolates, AFLP could clearly discriminate the nontoxigenic and toxigenic strains but failed to distinguish toxigenic Ogawa and Inaba strains isolated during the same period (Fig. 1). Nineteen Inaba strains were selected from the strain collection of cholera outbreak in 2005, which continued several months and spread more than four provinces in the eastern coastal areas of China. Some different PFGE and AFLP patterns were obtained, with 1 to 2 fragments difference when compared with the predominant patterns, which suggested the minor genetic variation among the isolates. More patterns of SfiI were found, suggesting the highest discriminatory power compared with NotI in PFGE and AFLP.
When the 10 O139 strains from the 4 outbreaks were analyzed by AFLP, three different patterns were detected. Two strains from Outbreak 2 had different AFLP types, with a single-band difference (Fig. 2). In contrast, PFGE classified these two strains together.
The pattern frequency distribution in PFGE and AFLP analyses, using the strains listed in strain panel 1 (Supplementary Table S1), is listed in Figure 3. For O1 strains (Fig. 3A), 68 patterns, accounting for 98.6% (68/69) and 97.1% (68/70) of NotI PFGE and SfiI PFGE subtyping, respectively, only contained one strain in each. Of the 72 test strains, 68 (94.4%) had a unique pattern for both NotI PFGE and SfiI PFGE subtyping. For AFLP subtyping, 48 patterns accounting for 88.9% (48/54) contained one strain in each. These patterns accounted for only 66.7% (48/72) of the test strains. Three patterns of AFLP contained five, six, and seven strains, indicating that AFLP had lower discriminatory power than that of PFGE for subtyping of O1 strains.
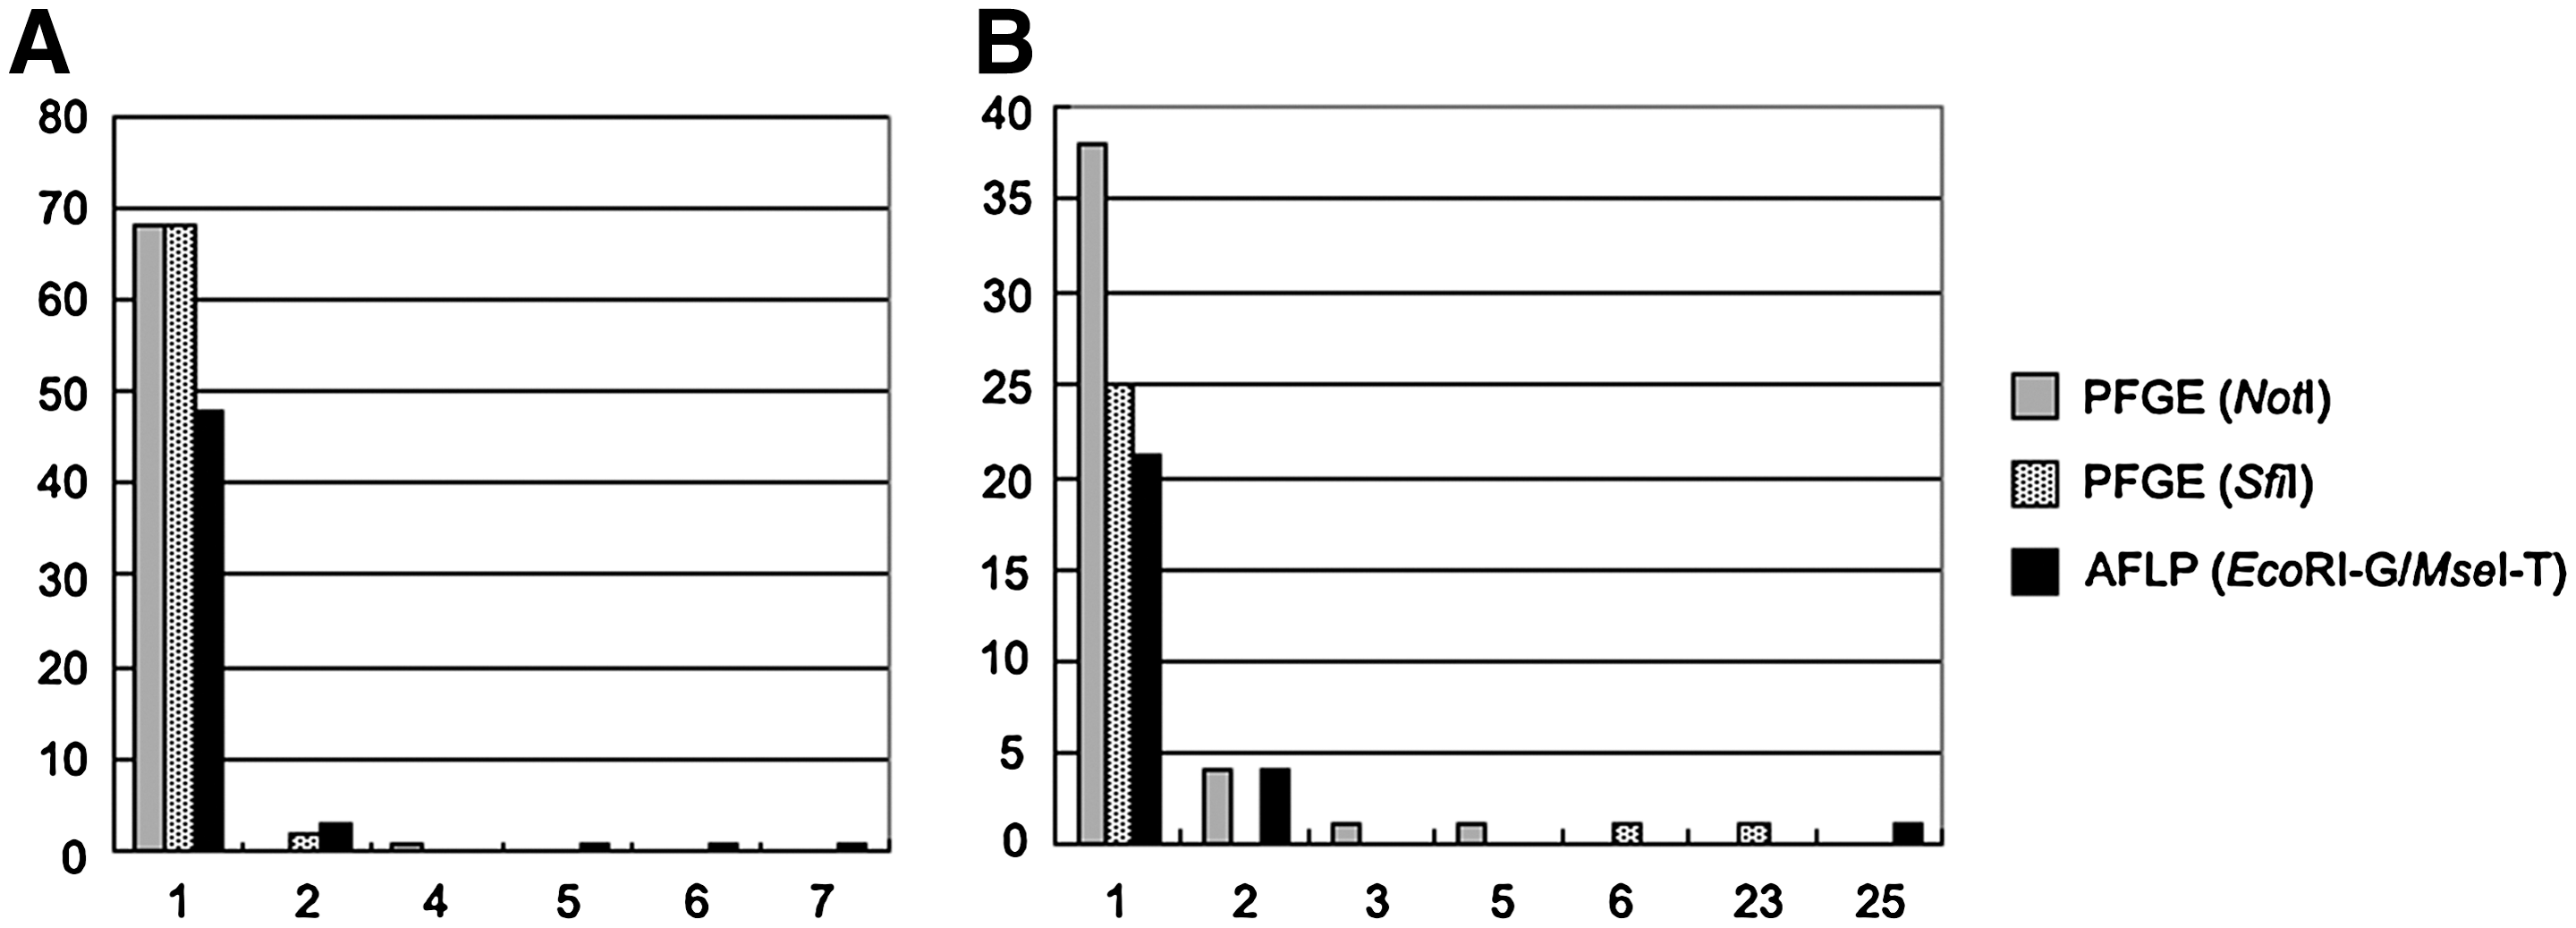
Frequency distribution of patterns obtained by PFGE (NotI and SfiI, respectively) and AFLP (EcoRI-G/MseI-T). The figures on X-axis indicate the numbers of strains in each of the patterns. Y-axis indicates the sum of the patterns.
For O139 strains (Fig. 3B), 38 patterns, accounting for 86.4% (38/44) of NotI PFGE subtyping, contained only one strain in each. These patterns contained 70.4% (38/54) of the test strains. Twenty-five patterns, accounting for 92.6% (25/27) of SfiI PFGE subtyping, contained one strain in each. These patterns contained only 46.3% (25/54) of the test strains. Twenty-one patterns, accounting for 80.8% (21/26) of AFLP subtyping, contained one strain in each. These patterns contained only 38.9% (21/54) of the test strains. One pattern of SfiI PFGE and AFLP contained 23 and 25 strains, respectively, indicating that these methods had lower discriminatory power than that of NotI PFGE for subtyping of O139 strains.
Discussion
Because of high reproducibility and unprecedented resolving power, PFGE has become the gold standard for molecular subtyping, and its application in V. cholerae screening has been well documented (Kam et al., 2003; Zhang et al., 2007; Zhou et al., 2009). Standardized procedures for PFGE as developed for V. cholerae by PulseNet, an early warning system for outbreaks of foodborne disease, can improve comparison among different laboratories (Cooper et al., 2006). In this study, we found that SfiI digestion generated fewer patterns during O139 strain subtyping than those generated by NotI. Our analysis revealed that the 23 O139 strains in the panel, which were isolated from 10 provinces between 1994 and 2006, were classified into 1 SfiI pattern, whereas these 23 strains were separated into 17 patterns when digested with NotI. We concluded that NotI should be considered as the first choice of enzyme for PFGE analysis of V. cholerae O139. For O1 strains, NotI and SfiI had similar subtyping powers. However, the strains used here were almost all isolated from China, and there may be regional differences in the ability of different enzyme to detect diversity.
The discriminatory power of the AFLP method largely depends on the selection of appropriate restriction enzymes and primer combinations (Vos et al., 1995; Janssen et al., 1996; Savelkoul et al., 1999). Selection of restriction enzyme combinations and primer pairs is important to acquire higher discriminatory power for a specific bacterium. In this study, by experimental comparisons, we found that EcoRI-G/MseI-T was the optimal restriction enzyme combination and primer pair for AFLP analysis of V. cholerae. We also compared the patterns obtained by CE-AFLP and PAGE-AFLP and showed that there were significant differences between the fragments obtained with the two methods. A similar difference between CE and PAGE was observed previously (Beaubier et al., 2000; Tang et al., 2008), who suggested that CE offers superior resolution and improved sensitivity than PAGE. Band pattern differences were noted between the capillary electrophoresis system and agarose gel electrophoresis, and also between different dyes used in CE (Ranjard et al., 2001; Brusetti et al., 2008). All these differences observed between different electrophoresis systems may be attributed to the different labeled primers used, which offer different sensitivities. Further, the use of different internal size standards, different types of polymers, and capillary arrays of different lengths can attribute to differences observed between CE and PAGE.
We chose strain panels of O1 and O139 strains with different origins to compare the discriminatory powers of AFLP and PFGE. These strains were isolated over a period of 40 years and from different locations, which allowed us to use the D-value to determine the discriminatory power of the typing methods. For the O1 strains, AFLP yielded a high D-value (>0.98). This indicated that AFLP could be used as a typing method for O1 V. cholerae with the generally accepted probability of 5% of type I errors (Struelens, 1996). However, the discriminatory power of AFLP is lower than that of PFGE for subtyping O139 V. cholerae strains. For O139 strains, AFLP yielded a D-value that was similar to that obtained by SfiI PFGE, but was significantly lower than that obtained by NotI PFGE.
PFGE requires 2 days to completely analyze a batch of 11 strains when one set of instruments is used. Of AFLP, the time it takes to run a batch of isolates was also 2 days However, we could subtype 384 strains in 2 days by using one set of PE Applied Biosystems ABI Prism® 3730 instrument or LI-COR Global 4300 Sequencing System. On the other hand, the high cost of equipment and lack of standard software for data analysis should also be taken into consideration. With the current protocols, we think that AFLP has limited discriminatory power for V. cholerae subtyping compared to that of PFGE, especially for the subtyping of O139 V. cholerae. The standardization of protocol will be a challenging task to facilitate its use and allow pattern comparisons across different laboratories. Adaptor ligation and two steps of PCR may decrease its reproducibility because even slight differences may be magnified to generate band differences. Each step and reagent should be strictly standardized. To improve the discriminatory power of AFLP, we consider that the combined application of two or more restriction enzymes and/or primer pairs should be applied. So, AFLP data can only be compared and shared between laboratories if the same model of separation equipment, strict protocols, and high quality control are used. These limitations restrict the used of AFLP in international subtyping networks.
Conclusions
We showed that NotI- and SfiI-PFGE have similar discriminatory power for subtyping O1 V. cholerae strains, whereas and that NotI should be considered as the first choice of enzyme for O139 strains. AFLP has a lower discriminatory power than that of PFGE, especially for O139 strains, and requires optimized parameters and elaborate adaptor ligation and two steps of selective fragment amplifications; this indicated it cannot be recommended for V. cholerae subtyping using the current protocol. The reproducibility of AFLP results across different laboratories using the same protocol also needs to be determined.
Footnotes
Acknowledgments
This study was supported by the grants from the Ministry of Health and the Ministry of Science and Technology (2008ZX10004-008), the National Basic Research Priorities Program (grant 2009CB522604), and the National Natural Scientific Foundation of China (grant 30700678).
Disclosure Statement
No competing financial interests exist.
References
Supplementary Material
Please find the following supplemental material available below.
For Open Access articles published under a Creative Commons License, all supplemental material carries the same license as the article it is associated with.
For non-Open Access articles published, all supplemental material carries a non-exclusive license, and permission requests for re-use of supplemental material or any part of supplemental material shall be sent directly to the copyright owner as specified in the copyright notice associated with the article.