
Abstract
In this article, the sensitivity of Salmonella enteritidis to surfactin and polylysine was observed, and the optimization of antimicrobial activity of surfactin and polylysine against S. enteritidis in milk was evaluated by a response surface methodology. Results showed that S. enteritidis was very sensitive to them, whose minimal inhibitory concentrations were 6.25 and 31.25 μg/mL, respectively. The optimization result indicated that S. enteritidis could be sterilized by 6 orders of magnitude when the temperature was 4.45°C, the action time was 6.91 h, and the concentration (surfactin/polylysine weight ratio, 1:1) was 10.03 μg/mL.
Introduction
Surfactin and polylysine structures have been identified (Steller and Vater, 2000). A protophase study indicated that they had a broad spectrum of antimicrobial activity, including Gram-positive and Gram-negative bacteria, fungi, protozoa, and viruses.
To accelerate the application of antibacterial peptide in commercial field, the sensitivity of Salmonella enteritidis to surfactin and polylysine was assayed, and the extermination effect and sterilization condition of the lipopeptide and polypeptide to S. enteritidis in milk were also researched, which would give a technological support and a theoretical basis for commercial applications of surfactin and polylysine.
Materials and Methods
Surfactin and polylysine
Surfactin and polylysine were purchased from Sigma. In the optimization of sterilization of S. enteritidis, lipopeptide and polypeptide concentration was a weight of surfactin-to-weight of polylysine ratio of 1:1.
Strains and growth conditions
The bacteria used was S. enteritidis, obtained from the Institute of Microorganism Science of China. The bacterial strains were grown in LB medium (beef extract 5 g/L; peptone 10 g/L; NaCl 5 g/L; pH 7.2) at 37°C and 150 rpm.
The strain S. enteritidis was inoculated into a 250-mL shake flask containing 70 mL LB medium and cultivated at 37°C and 150 rpm for 18 h to exponential growth phase. The cells were washed three times in sterile distilled water by centrifugation at 7000 g for 10 min, and the concentration of prepared cells suspension of S. enteritidis was 1010–1012 colony-forming units (CFU)/mL, which was determined as described below.
Determination of the minimal inhibitory concentration
A modified microdilution technique described by Vorland et al. (1998) was used to determine the minimal inhibitory concentration (MIC). Briefly, serial dilutions of surfactin or polylysine were made with methanol in 96-well microtiter plates. Each well was inoculated with the prepared S. enteritidis cells diluted in LB medium to give a final concentration of ∼1 × 10⁵ CFU/mL. Microtiter plates were incubated at 37°C for 24 h. The MICs were determined as the lowest concentration at which growth was inhibited.
Methodology and design of experiments
Response surface methodology (RSM) is an empirical modeling technique used to estimate the relationship between a set of controllable experimental factors and observed results. The results of the fractional factorial experiment showed that temperature, time, and lipopeptide and polypeptide (surfactin/polylysine weight ratio, 1:1) concentration were the significant external factors to sterilize the S. enteritidis cells. Based on the results, RSM was employed in the present work and was used to determine six log-cycles reduction of S. enteritidis cells in milk medium under different parameters, such as temperature, time, and peptides concentration. The experimental design of the investigation was a central composite design (Liu and Tzeng, 1998; Reddy et al., 2000) of experiments with three independent variables to obtain the combination of values that optimized the response within the region of the three-dimensional observation space to allow the design of a minimal number of experimental runs. The parameters temperature, time, and peptides concentration were chosen as key variables and designated as X1, X2, and X3, respectively. The low, middle, and high levels of each variable were designated as −1, 0, and +1, respectively, as shown in Table 1. The variables were coded according to Equation 1:
χ 1 = (X 1 – 12)/10; χ 2 = (X 2 – 8)/4; χ 3 = (X 3 – 7.8125)/3.90625.
where χi
is a (dimensionless) coded value of the variable Xi
, X0 is the value of Xi
at the center point, and ΔX is the step change. Table 2 shows the actual design of the experiments. The behavior of the system was explained by the following second-degree polynomial equation:
Values are mean (standard deviation).
where Y is the predicted response; it can be observed that, in the present study, three variables are involved, and hence, n takes a value of 3. Thus, by substituting the value 3 for n, Equation 2 becomes
where χ
1, χ
2, and χ
3 are input variables (namely, temperature, time, and peptides concentration); B
0 is a constant; B
1, B
2, and B
3 are linear coefficients; B
12, B
13, and B
23 are cross-product coefficients; and B
11, B
22, and B
33 are quadratic coefficients. Y is the predicted response, which can be calculated using Equation 4:
where N t is the final number of survivals (CFU/mL) and N 0 is the initial number of cells (CFU/mL). For Equation 3, a total of 17 runs are necessary for locating the optimal levels and range of selected factors.
In the present investigation, Design Expert package (Version 6.0.5; Stat-ease) was used for regression analysis of the data obtained and to estimate the coefficients of the regression equation. The fit of the regression model attained was checked by the adjusted coefficient of determination (R 2 adj). The statistical significance of the model was determined by the application of Fischer's F test. The two-dimensional graphical representation of the system behavior, called the response surface, was used to describe the individual and cumulative effects of the variables, as well as the mutual interactions between the variables on the dependent variable.
Counting of surviving cells
Survivors in the treated and untreated samples were estimated by the viable count method using nutrient agar media. The plates were incubated at 37°C for 24 h, and then the colonies were enumerated.
Statistical analysis
All experiments were carried out in at least three different experiments, and the standard deviations were calculated from the triplicate experiments.
Results
Determination of the MIC
Inhibited activity of surfactin and polylysine was determinated by microdilution technique on S. enteritidis. Results demonstrated that bacterial growth could be detected when surfactin and polylysine were diluted to 3.125 and 15.625 μg/mL, respectively, but it could not be detected at a concentration of 6.25 and 31.25 μg/mL, respectively. So, the MIC of surfactin and polylysine to S. enteritidis was 6.25 and 31.25 μg/mL, respectively.
Regression model of response
The mean values (n = 9) of the response (log-cycle reduction for cells of S. enteritidis) obtained under different experimental conditions are summarized in Table 2. The variability associated with test samples was again small, as indicated by the standard deviation values given within parentheses.
The experimental data (Table 2) were analyzed using a statistical package. Multiple regression analysis of the experimental data gave the following second-order polynomial equation:
A summary of the analysis of variance (ANOVA) for the selected quadratic model is given in Table 3. The correlation measure for testing the goodness-of-fit of the regression equation was the adjusted determination coefficient (R 2 adj). The value of R 2 adj (0.9998) for Equation 5 being close to 1 indicated a high degree of correlation between the observed and predicted values. The value of R 2 adj (0.9997) suggested that only about 0.03% of the total variation was not explained by the model. Statistical testing of the model was done in the form of ANOVA, which was required to test the significance and adequacy of the model. Here, the ANOVA of the regression model demonstrates that the model was highly significant, as was evident from the calculated F value (5699.80) and a very low probability value (p < 0.0001). Moreover, the computed F value was much greater than the tabulated F value [F 0.01(9,4) = 14.66], indicating that the treatment differences were highly significant. The model also showed statistically insignificant lack of fit, as was evident from the lower calculated F value (1.09) than the tabulated F value [F 0.05(9,3) = 8.81] even at 0.05 level. The model was found to be adequate for prediction within the range of variables employed.
R = 0.9999; R 2 = 0.9998; R 2 adj = 0.9997.
The coefficient values of Equation 5 were calculated and tested for their significance using Design Expert and are listed in Table 4. The p-values were used as a tool to check the significance of each of the coefficients, which in turn might indicate the pattern of the interactions between the variables. The smaller the value of p, the more significant was the corresponding coefficient. It could be seen from this table that all the linear coefficients and quadratic term (χ 3 2) T are significant, and the p-values are very small (p < 0.0001). All of the interactions were significant (p < 0.001).
CI, confidence interval.
Localization of optimum condition
The graphical representations of the regression Equation 5, called the response surfaces and the contour plots, were obtained using the Design Expert and presented in Figures 1 –3. As the maximum initial spoilage in foodstuff for healthy people was <106 CFU/g or 106 CFU/mL with S. enteritidis cells, and six log-cycles reduction for S. enteritidis cells was the criterion of surfactin and polylysine inactivation, the optimum process parameters for six log-cycles reduction of S. enteritidis cells were to be optimized in this investigation.
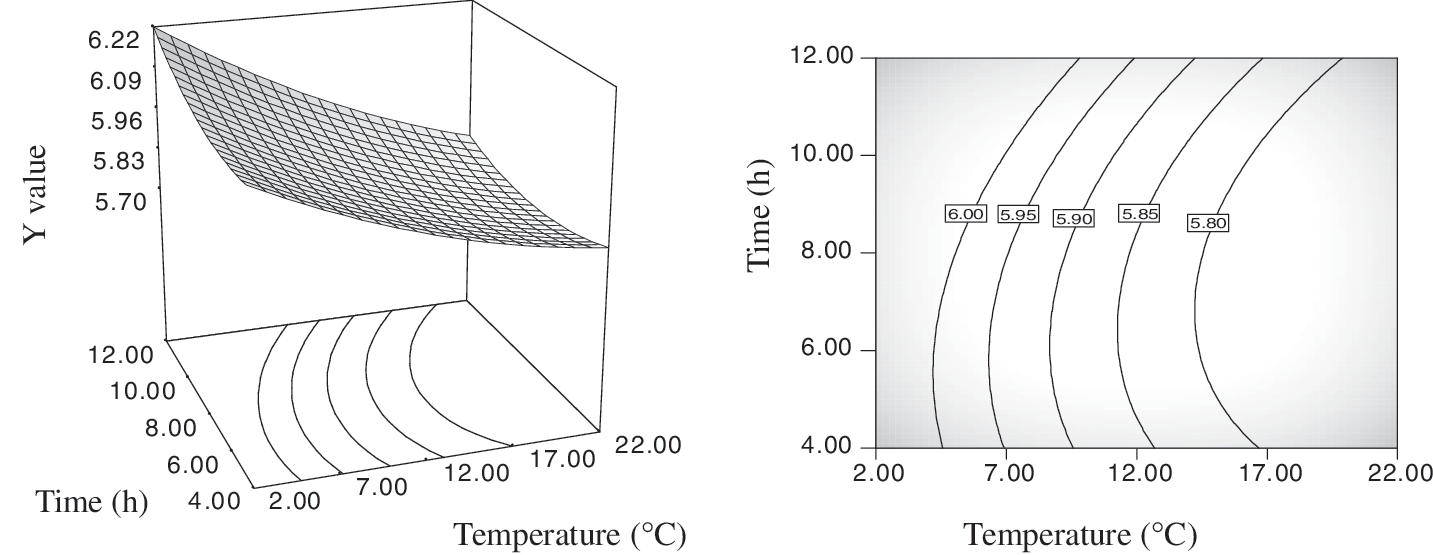
Response surface plot and its corresponding contour plot of the effect of interactions between time and temperature on Salmonella enteritidis sterilization.
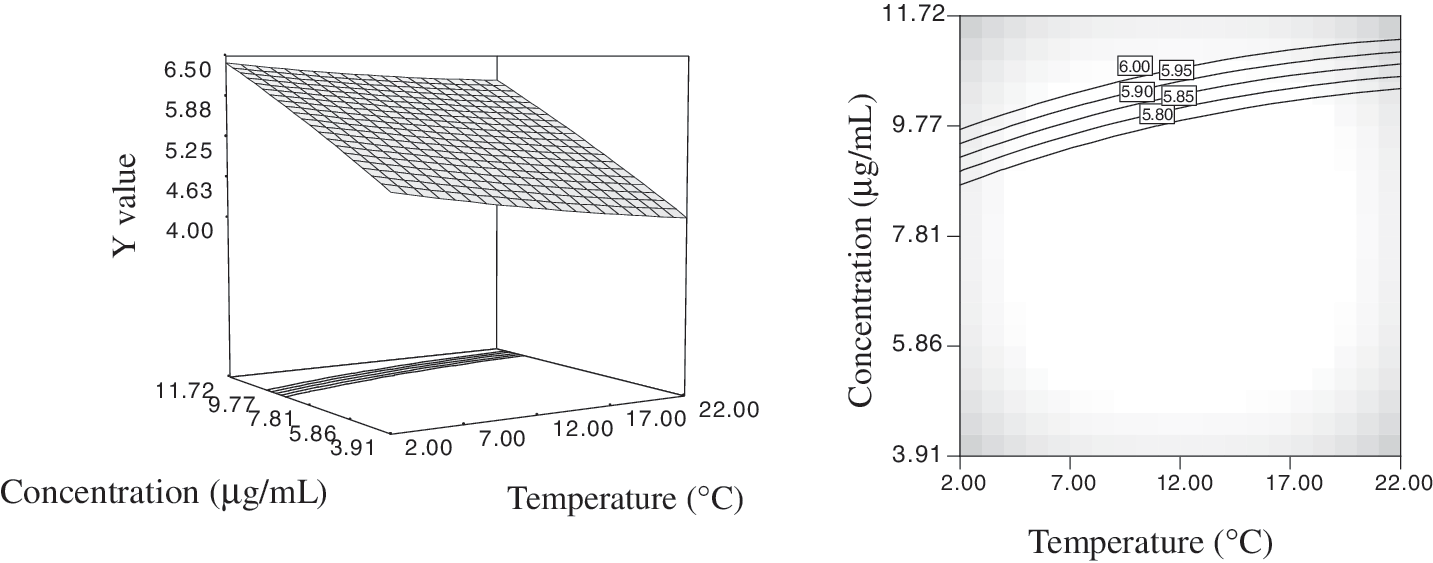
Response surface plot and its corresponding contour plot of the effect of interactions between temperature and concentration on S. enteritidis sterilization.
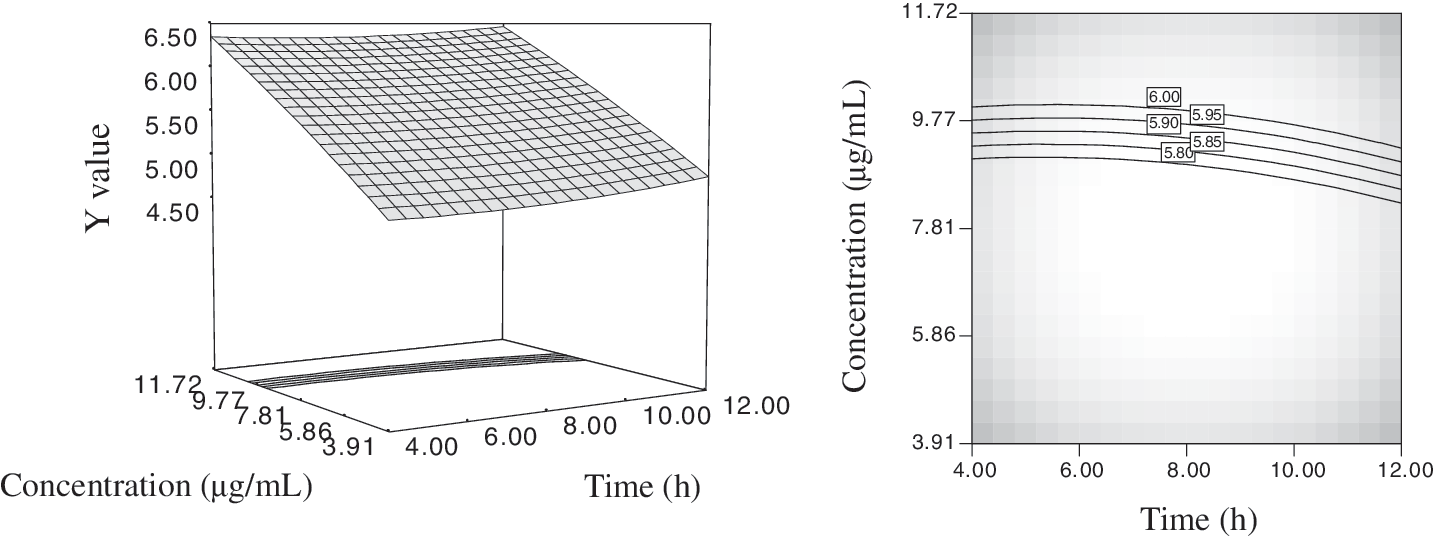
Response surface plot and its corresponding contour plot of the effect of interactions between time and concentration on S. enteritidis sterilization.
Figure 1 shows the effect of interactions between temperature and time with peptides concentration at the optimum value (10.03 μg/mL, 0.57 level) on S. enteritidis sterilization. From Figure 1, it could be seen that the reduction of S. enteritidis cells increased with increase in temperature and time, reaching a six log-cycles reduction at 4.60°C–9.77°C in 4–12 h. The optimum value was obtained by the derivation of Equation 5 and by solving the inverse matrix, fixing the optimization level of six log-cycles reduction of S. enteritidis cells at a temperature of 4.45°C for a time of 6.91 h.
Figure 2 shows how the reduction of S. enteritidis cells varied with temperature and peptides concentration at a fixed time of 6.91 h (−0.27 level). In a temperature range of 2°C–22°C, and peptides concentration 9.71–11.31 μg/mL, the maximum reduction of S. enteritidis cells occurred at six log-cycles. Therefore, one can fix the optimization of the level of a six log-cycles reduction of S. enteritidis cells at a temperature of 4.45°C and a peptides concentration of 10.03 μg/mL using the model.
The contour plot in Figure 3, which gave the reduction of S. enteritidis cells as a function of time and peptides concentration at a fixed temperature (4.45°C, −0.76 level), shows that the reduction of S. enteritidis cells increased with time prolonging and peptides concentration increasing, reaching a six log-cycles reduction of S. enteritidis cells at time 4–12 h and peptides concentration 9.29–10.04 μg/mL. A level of a six log-cycles reduction of S. enteritidis cells by optimization was reached at time 6.91 h and peptides concentration 10.03 μg/mL.
Analyzing the temperature–time–concentration plots, a significant synergistic effect was observed among the three parameters. Increasing the temperature of a certain treatment gave the opportunity to decrease the treatment time and concentration. Similarly, increasing concentration seemed to give the opportunity to decrease the treatment temperature and time. As a consequence, a six log reduction of S. enteritidis cells can be realized under several possible temperature–time–concentration combination treatment conditions in milk medium.
Verification of model
To validate the adequacy of the model equation (Equation 5), a total of six verification experiments were carried out under different peptides combinations of process parameter (within the tested area). The results are shown in Table 5. The validation data were analyzed using the SPSS software (version 10.0; SPSS). The correlation coefficient (R) between the experimental and predicted values was 0.9587. The results of the analysis indicated that the experimental values were found to be significant in agreement with the predicted ones and also suggested that the model of Equation 5 was satisfactory and accurate.
Discussion
RSM was applied to optimize the microbial medium (Trupkin et al., 2003). Here, we used RSM to optimize the conditions of peptides sterilizing S. enteritidis cells. RSM involving an experimental design and regression analysis was used to evaluate the effects of temperature, time, and peptides concentration on the reduction of S. enteritidis cells and was effective in finding the optimum value of the three factors. A predictive model for the reduction of S. enteritidis cells was established as a function of temperature, time, and peptides concentration. The adequacy of the predictive model was verified effectively by the validation data with respect to the nutrient, flavor, and physicochemical characters of food and the sterilization effect of each factor to S. enteritidis cells. The optimum process parameters for six log-cycles reduction of S. enteritidis cells were obtained as temperature, 4.45°C; time, 6.91 h; and peptides concentration, 10.03 μg/mL. The weighing coefficients of temperature, time, and concentration afflicting S. enteritidis cells sterilization by peptides from high to low were as follows: concentration, 0.90; time, 0.064; temperature, −0.23.
Here, we mainly examined the effect of several external factors (the most commonly controlled factors in food processing) on peptides sterilizing S. enteritidis cells, and other external factors (such as stress) and internal factors (such as pH and ion strength) were not studied. However, it is important that these works will more completely explain peptides' sterilizing effects and peptides applications. So there would be a need to carry out more studies.
Conclusions
The results of this study indicate that S. enteritidis was sensitive to surfactin and polylysine, whose MICs were 6.25 and 31.25 μg/mL, respectively. The optimization result indicated that S. enteritidis could be reduced to six log-cycles when the temperature was 4.45°C, the action time was 6.91 h, and the concentration (surfactin/polylysine weight ratio, 1:1) was 10.03 μg/mL.
Footnotes
Disclosure Statement
No competing financial interests exist.