
Abstract
One hundred two pathogenic Escherichia coli isolates from diseased pigs were analyzed for serotypes, virulence genes, antimicrobial susceptibility, and the molecular basis of phenicol resistance. Of these 102 E. coli isolates, 101 were typeable and belonged to 27 different O serogroups. However, 69% of these isolates belonged to one of the following eight serogroups: O8, O54, O64, O65, O92, O108, O119, and O120. Serogroups O8 (23%) and O64 (10%) were the most prevalent among typeable isolates. High-resistance phenotypes were observed in all the isolates, with the majority displaying resistance to chloramphenicol (89%), streptomycin (83%), enrofloxacin (78%), and doxycycline (60%). The chloramphenicol resistance genes cat1, cat2, and cmlA were detected in 58%, 49%, and 65%, respectively, of the chloramphenicol-resistant isolates. The floR gene was detected in 57% of the florfenicol-resistant isolates and in 52% of chloramphenicol-resistant isolates. Pulsed-field gel electrophoresis showed that the 32 floR-positive isolates with florfenicol minimum inhibitory concentration ≥8 μg mL−1 belonged to 25 different pulsed-field gel electrophoresis profiles, indicating the spread of floR among swine pathogenic E. coli isolates.
Introduction
Antimicrobials are valuable tools for treating clinical disease in both human and animals. However, broad use of antimicrobials selects for resistant bacteria, which may then enter the food chain and potentially cause food borne illnesses in humans (Phillips, 2007). Additionally, antimicrobial-resistant pathogens also result in higher morbidity and mortality rates in animals (Travers and Barza, 2002).
Florfenicol is a broad-spectrum fluorinated analog of thiamphenicol, which has activity against many Gram-positive and Gram-negative bacteria. It has been approved exclusively for veterinary use in food animals since 1999. Many studies report florfenicol resistance in E. coli isolates from cattle and poultry (Keyes et al., 2000; White et al., 2000; Doublet et al., 2002); however, in China, little is known about florfenicol resistance in E. coli from pigs.
Therefore, the present study investigated the serogroups, virulence genes, antimicrobial susceptibility, and molecular basis of phenicol resistance in E. coli isolated from diseased swine.
Materials and Methods
Collection and identification of E. coli isolates
One hundred two clinical E. coli were collected from diseased swine from 20 different herds in Guangdong Province, China, between 2003 and 2008. E. coli strains were mainly isolated from fecal swabs taken from diseased swine with diarrhea or edema. Each isolate was taken from an individual animal. The specimens were cultured on MacConkey agar and incubated aerobically at 37°C overnight. Cultures producing pure (or almost pure) colonies were identified by standard biochemical methods. The results were confirmed using the API-20E system (bioMérieux).
Susceptibility testing
All strains were tested for susceptibility to the following antimicrobial agents using the agar dilution method: ceftriaxone (0.015–128 μg mL−1), ceftiofur (0.125–256 μg mL−1), amikacin (0.5–128 μg mL−1), streptomycin (1–256 μg mL−1), gentamycin (0.125–256 μg mL−1), kanamycin (0.5–256 μg mL−1), chloramphenicol (0.5–128 μg mL−1), florfenicol (1–256 μg mL−1), doxycycline (0.25–128 μg mL−1), enrofloxacin (0.008–32 μg mL−1), levofloxacin (0.008–32 μg mL−1), and colistin (0.125–64 μg mL−1).The results were interpreted according to the guidelines of CLSI document M31-S1 (2004). Breakpoints for doxycycline were referred from CLSI document M100-S18 (2008), which pertains to isolates of human origin. Because no CLSI breakpoints could be found for colistin, its minimum inhibitory concentration (MIC)50 and MIC90 values were calculated. The resistance breakpoint for florfenicol (≥8 μg mL−1) was taken from the report by Bischoff et al. (2002). Escherichia coli ATCC 25922 was used as the quality control strain.
Serotyping and detection of virulence-associated and phenicol resistance genes
Serotyping was performed by agglutination using antisera for 32 O serogroups associated with swine colibacillosis. The virulence genes, STa, STb, EAST1, eae, Stx2e, F4, F18, and sepA, were analyzed using polymerase chain reaction (PCR). Amplification of the phenicol resistance genes cat1, cat 2, cmlA, cmlB, and floR was performed as previously described (Chen et al., 2004; Maynard et al., 2003). The primers used are listed in Table 1 . PCR was performed in a 20-μL mixture containing 1 μL template DNA, 0.5 μL of each primer (10 nmol L−1), 10 μL of 2× PCRMix (Fermentas, MBI), and 8 μL ddH2O. All PCRs were done as follows: 5 min at 94°C; followed by 30 cycles of 30 s at 94°C, 30 s at annealing temperature, 30 s at 72°C; and 5 min at 72°C. The PCR products were analyzed by electrophoresis and observed using an ultraviolet transilluminator. The DNA sequences obtained were compared with those in the GenBank database using the BLAST program.
PCR, polymerase chain reaction.
Clonal analysis
Pulsed-field gel electrophoresis (PFGE) was used to analyze the genomic relatedness of the 32 floR-positive E. coli isolates with a florfenicol MIC of ≥8 μg mL−1. Chromosomal DNA was digested with the restriction enzyme XbaI using a standard protocol and a CHEF-MAPPER System (Bio-Rad Laboratories) as described by Gautom (1997). The gels were run at 14°C for 22 h at 6.0 V cm−1 and angle of 120°. Salmonella serotype Braenderup H9812 standards were used as size markers. The resulting of PFGE patterns were interpreted according to the criteria of Tenover et al. (1995). A difference of at least seven bands in the patterns was considered the criterion for discriminating between unrelated isolates.
Statistical analysis
Differences in the year-by-year rates of antimicrobial resistance were assessed using Fisher's exact tests (SAS, v8.2). A p-value of <0.05 was considered significant.
Results
Antimicrobial resistance phenotypes
Most isolates displayed high rates of resistance to chloramphenicol (85%), streptomycin (83%), enrofloxacin (78%), gentamycin (73%), and doxycycline (60%). The rates of resistance to other antimicrobials ranged from 7% to 56% (Table 2). The MIC50 and MIC90 values for florfenicol were 8 and 256 μg mL−1, respectively. The MIC50 and MIC90 values for colistin were 0.5 and 128 μg mL−1, respectively. As shown in Table 2, a high proportion of isolates were resistant to streptomycin and gentamycin in 2008, whereas the rates of resistance to enrofloxacin and levofloxacin were the highest between 2003 and 2004. The percentage of isolates resistant to kanamycin (p = 0.01) increased over time. Almost all of the isolates (98%) were resistant to three or more antimicrobials (Table 3).
Resistance was based on the NCCLS breakpoint for bovine respiratory pathogens (≥8 μg mL−1).
CHL, chloramphenicol; FFC, florfenicol; CTF, ceftiofur; CRO, ceftriaxone; ENR, enrofloxacin; LEV, levofloxacin; STR, streptomycin; GEN, gentamycin; KAN, kanamycin; AMK, amikacin; DOX, doxycycline; MIC, minimum inhibitory concentration.
Only the most common patterns are shown.
Serotyping and virulence genes
Of 102 isolates, 101 (99%) were typeable. Twenty-seven different O serogroups were identified, the most prevalent being O8 (23%), followed by O64 (10%), O65 (8%), O92 (7%), O108 (7%), O120 (6%), O54 (4%), and O119 (4%). Ninety-two percent (93 isolates) of isolates carried at least one of the following toxins: STa, STb, EAST1, Stx2e, and sepA. The most common virulence determinant was EAST1 (75%), followed by Stx2e (67%), eae (52%), sepA (33%), STa (32%), F4 (30%), and STb (13%). The F18 gene was detected in only two isolates. As shown in Table 4, the most prevalent virulence gene patterns according to serogroup were O120-STa//EAST1/Stx2e/F4, O147-Stx2e/EAST1, and O159-Stx2e/EAST1. None of virulence-associated genes was detected in three O160 isolates (data not shown).
Phenicol resistance genes
cmlB was not detected in any of the isolates. cmlA and cat1 were the most prevalent, being found in 61 (60%) and 56 (55%) isolates, respectively. cat1, cat2, cmlA, and floR were detected in 55%, 47%, 61%, and 47%, respectively, of chloramphenicol-resistant isolates. All isolates had at least one of these resistant genes, apart from 11 of the chloramphenicol-resistant isolates and six of the florfenicol-resistant isolates. cat1 + cat2 and cat1 + cmlA were the most prevalent combinations found in this study, with a prevalence of 42% and 42%, respectively.
Of the 32 floR-positive isolates with florfenicol MICs of ≥8 μg mL−1, 29 were successfully typed, resulting in 25 different PFGE patterns with a difference of at least seven bands (Fig. 1). This suggests that dissemination of floR might not be due to the spread of a specific clone. However, in a small number of cases, isolates from the same farms or from different farms were found to have identical PFGE patterns.
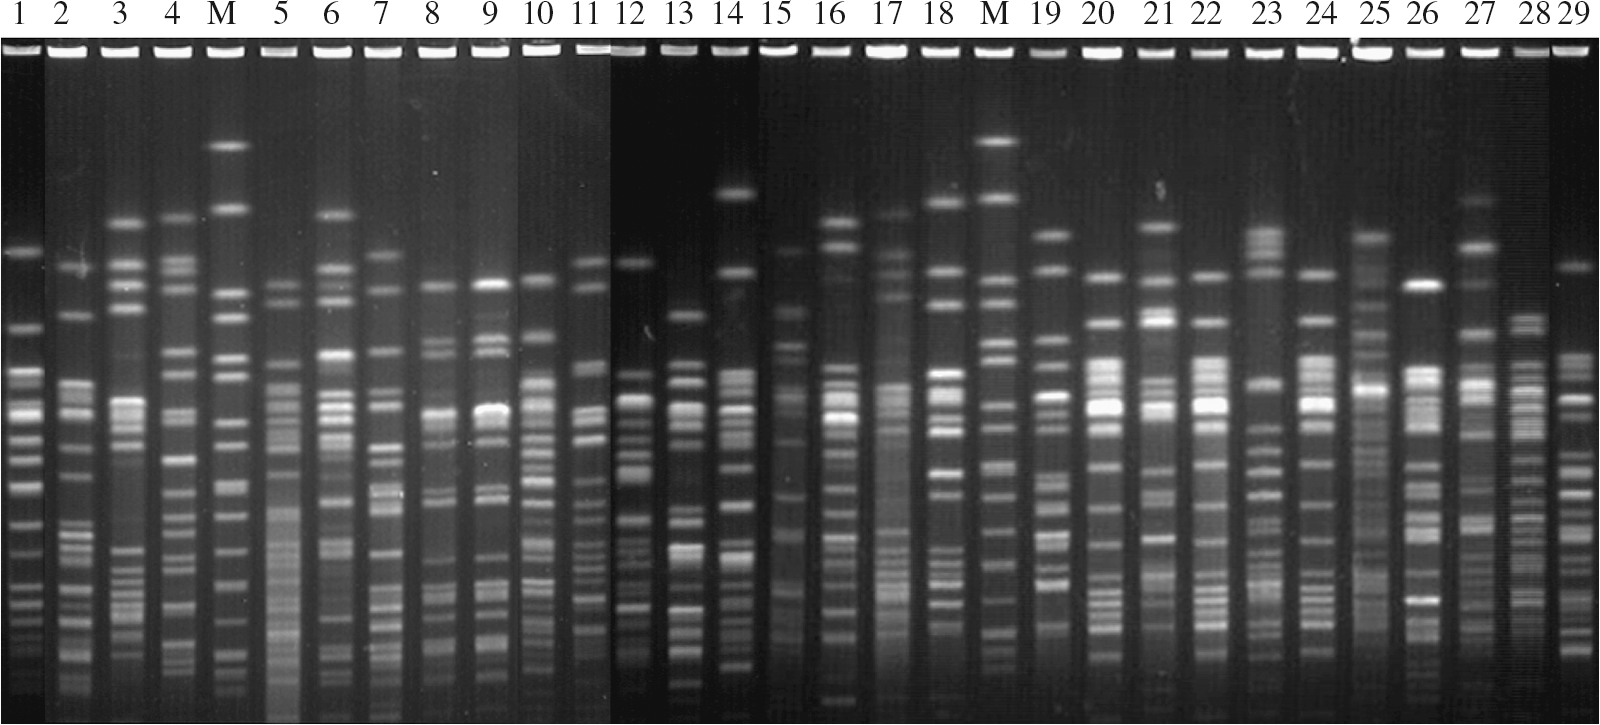
Xbal macrorestriction patterns of 32 floR-positive Escherichia coli isolates with florfenicol MICs of ≥8 μg mL. Lane M, size standard (Xbal-digested DNA of Salmonella ser. Braenderup H9812 standards).
Discussion
In this study, the most prevalent serogroups were O8, O64, O54, and O119, which is in agreement with the serogroups commonly found in swine diarrhea and ED worldwide (except O119). O119 is a common serotype found in EPEC isolates and has been reported in relation to infantile diarrhea (Ewing et al., 1963; Gomes et al., 1989), although few data are available regarding the presence of O119 serogroup among swine isolates (Sojka, 1965; Imberechts et al., 1992; Nagy and Fekete, 1999; Frydendahl, 2002). The reason for the emergence of serogroup O119 in swine E. coli is not known; however, O119 should be under surveillance because of its co-occurrence of the serogroup from both human and swine pathogenic E. coli isolates. Other serogroups, such as O5, O11, O40, O78, and O109, were unique to this study. This implies that regional differences, or other selective advantages, may result in E. coli strains with these particular O serogroups being particularly adapted to propagation in swine populations and their environment.
Similar to the findings of previous studies (da Silva et al., 2001; Fratamico et al., 2004; Vu-Khac et al., 2007), EAST1 and Stx2e described here were commonly detected in E. coli isolates. STb is the most prevalent toxin in piglets with diarrhea and edema (Souza da Silva et al., 2001; Boerlin et al., 2005; Vu-Khac et al., 2007); however, only 13 of our isolates harbored the STb gene. eae was detected in 3% and 26% of isolates from diarrheic piglets in studies by Martins et al. (2000) and Vu-Khac et al. (2007), respectively, but was found in 51% of the isolates in our study. Although the virulence genes described here were responsible for ETEC and STEC, they were not related to the O149, O138, and O139 serotypes commonly found in ETEC and STEC (Sojka, 1965; Imberechts et al., 1992; Souza da Silva et al., 2001; Vu-Khac et al., 2007).
Long-term and widespread use of antimicrobials has resulted in increased antimicrobial resistance (McEwen and Fedorka-Cray, 2002). In the present study, most E. coli isolates were resistant to chloramphenicol, enrofloxacin, streptomycin, and gentamycin. These resistance levels are comparable to those previously reported for clinical E. coli isolates obtained from diseased swine (Bischoff et al., 2002; Lanz et al., 2003). Although chloramphenicol has been banned for use in food animals in China since 2002, high resistance rates were observed in this study. This may result from the presence of genes conferring resistance to chloramphenicol. Of the four resistance genes detected, cat1 and cmlA were common in chloramphenicol-resistant isolates, which is in agreement with other studies (Bischoff et al., 2002; Travis et al., 2006).
Grobbel et al. (2007) reported low MIC values (MIC50 = 4 μg mL−1 and MIC90 = 8 μg mL−1) for florfenicol in E. coli isolates from five animal species; however, higher MIC values (MIC50 = 8 μg mL−1 and MIC90 = 256 μg mL−1) for florfenicol were observed in our study and in avian isolates from China (Dai et al., 2008). This may suggest that MIC values for florfenicol are higher in China. We also found that 38 of 87 chloramphenicol-resistant isolates were coresistant to florfenicol, and all florfenicol-resistant isolates were coresistant to chloramphenicol, suggesting that cross resistance to the two antimicrobials was common in these isolates. The floR gene was prevalent in florfenicol-resistant E. coli strains from both chickens and cattle (Cloeckaert et al., 2000; Keyes et al., 2000; White et al., 2000) and was also common in florfenicol-resistant isolates from pigs in our study. Surprisingly, cmlA was more common in florfenicol-resistant isolates than floR, although it does not confer resistance to florfenicol (Dorman, 1982). One possibility is that the cmlA gene is maintained by virtue of a linkage to other genes that encode resistance to antimicrobials (such as tetracyclines, aminoglycosides, and sulfonamides) (Bischoff et al., 2005). The floR gene was not detected in 21 isolates in which the MICs of florfenicol ranged from 32 to 256 μg mL−1. It may be that other mechanisms, such as the overproduction of the AcrAB-TolC multidrug efflux system, may be responsible for florfenicol resistance in these isolates (Schwarz et al., 2004).
In conclusion, the results of this study showed that the majority of E. coli strains belong to a limited number of serogroups and carry multiple virulence genes. They also display resistance to multiple antimicrobial compounds and carry multiple phenicol resistance genes. These findings indicate that a surveillance program is needed to monitor the different serogroups, virulence genes, and the levels of antimicrobial resistance in pathogenic bacteria isolated from animals.
Footnotes
Acknowledgments
This work was supported in part by research grants from the National Natural Science Foundation of China Provincial Science Foundation of Guangdong (U0631006), the Program for Changjiang Scholars (5200638), and Innovative Research Team in University (grant no. IRT0723).
Disclosure Statement
No competing financial interests exist.