




Abstract
Salmonella enterica is commonly acquired from contaminated food and is an important cause of illness worldwide. Interventions are needed to control Salmonella; subtyping Salmonella by serotyping is useful for targeting such interventions. We, therefore, analyzed the global distribution of the 15 most frequently identified serovars of Salmonella isolated from humans from 2001 to 2007 in laboratories from 37 countries that participated in World Health Organization Global Foodborne Infections Network and demonstrated serotyping proficiency in the Global Foodborne Infections Network External Quality Assurance System. In all regions throughout the study period, with the exception of the Oceania and North American regions, Salmonella serovars Enteritidis and Typhimurium ranked as the most common and second most common serovar, respectively. In the North American and Oceania (Australia and New Zealand) regions, Salmonella serovar Typhimurium was the most common serovar reported, and Salmonella serovar Enteritidis was the second most common serovar. During the study period, the proportion of Salmonella isolates reported from humans that were Salmonella serovar Enteritidis was 43.5% (range: 40.6% [2007] to 44.9% [2003]), and Salmonella serovar Typhimurium was 17.1% (range: 15% [2007] to 18.9% [2001]). Salmonella serovars Newport (mainly observed in Latin and North American and European countries), Infantis (dominating in all regions), Virchow (mainly observed in Asian, European, and Oceanic countries), Hadar (profound in European countries), and Agona (intense in Latin and North American and European countries) were also frequently isolated with an overall proportion of 3.5%, 1.8%, 1.5%, 1.5%, and 0.8%, respectively. There were large differences in the most commonly isolated serovars between regions, but lesser differences between countries within the same region. The results also highlight the complexity of the global epidemiology of Salmonella and the need and importance for improving monitoring data of those serovars of highest epidemiologic importance.
Introduction
S
Although >2500 serovars of S. enterica have been identified, most human infections are caused by a limited number of serovars (Jones et al., 2008). In most developed countries, S. enterica serovars Typhimurium and Enteritidis are the most commonly reported causes of human salmonellosis; however, other serovars appear to be more prevalent in specific regions such as Salmonella serovar Stanley and Salmonella serovar Weltevreden in Southeast Asia (Olsen et al., 2001; Herikstad et al., 2002; Bangtrakulnonth et al., 2004; Galanis et al., 2006; Hendriksen et al., 2009a). Shifts in the prevalence of specific strain types and serovars in human and animal populations may follow the introduction of the strain through international travel, human migration, food, animal feed, and livestock trade (Clark et al., 1973; Crump et al., 2002; Aarestrup et al., 2007; Hendriksen et al., 2008; Ethelberg et al., 2010). Thus, failure to control Salmonella in one country presents a potential problem for other countries. To minimize the burden of this pathogen, it is helpful to monitor Salmonella serovar distribution in many countries, implement Salmonella control measures throughout the food production chain, and monitor the effectiveness of the control measures.
In January 2000, the World Health Organization (WHO) launched the WHO Global Salm-Surv program, now known as the WHO Global Foodborne Infections Network (GFN), a global effort to build capacity to detect, control, and prevent foodborne and other enteric infections from farm to table. A key objective of GFN is to enhance laboratory-based surveillance worldwide by improving laboratory capacity for serotyping of Salmonella. This objective is facilitated by bench-top training at international courses and workshops.
Laboratories participating in the GFN program are encouraged to annually report the 15 most frequently isolated Salmonella serovars via an Internet-based country data bank (CDB). This database is available online (
To assist national and international efforts aimed at control of Salmonella, we analyzed the distribution of the most prevalent Salmonella serovars from 2001 to 2007 reported from participating laboratories that demonstrated high-quality serotyping capability.
Materials and Methods
Country data bank
The CDB is a Web-enabled Oracle database. Only authorized members may enter data into the CDB and data entry is password-protected. However, the CDB may be viewed and queried by the general public. Each year, a designated representative for each laboratory is requested to enter the number of Salmonella isolated from human, animal, food, environmental, and/or feed sources and the number of the top 15 most frequently identified serovars from each of these sources.
From 2000 to 2009, a total of 790 national data sets from national reference laboratories and 158 institutional data sets covering all of the sources were uploaded into the CDB, of which 621 national data sets and 135 institutional data sets were submitted from 2001 to 2007. To prevent duplication, if national data were available from an institution, data from institutions in that country were excluded. This leave 273 national data sets and 53 institutional data sets; 148 from Europe, 38 from Asia, 13 from Oceania, 35 from Africa, 11 from North America, and 81 from Latin America contained results from isolates from humans.
External Quality Assurance System
The EQAS is described, in detail, elsewhere (Petersen et al., 2002; Hendriksen et al., 2009b). Participating laboratories are requested to serotype eight Salmonella test isolates and submit their results through a password-protected database to the WHO Collaborating Centre for Antimicrobial Resistance in Foodborne Pathogens, Copenhagen, Denmark (the coordinating laboratory). The participants then instantly obtain an evaluation report with suggestions for corrective actions. The data are stored centrally, summarized, and an annual report is published online
During 2001–2007, a total of 294 laboratories in 107 countries participated in the serotyping component of the EQAS. A total of 150 laboratories in 61 countries met the EQAS threshold (eight isolates tested with a maximum of one deviation from the expected serotyping result) from 2001 to 2007.
Only data from members who had uploaded summarized data of human origin into the CDB, and met the EQAS threshold in one or more iterations of the EQAS were included in the analysis. We wanted to explore the member data from each country; number of Salmonella isolated and serotyped as well as the top 15 most common serovars from human isolates over time; and every second year from 2001 to 2007 where data were available. For easy of analysis and interpretation, we confined the analysis to every other year: from 2001 to 2007 and therefore only used the data sets from these 4 years rather than the 7 years. The data were listed in the file by world region (i.e., Europe, Asia, Oceania, Africa, North America, and Latin America) and sorted by the number of isolates of the serovar in countries and by year. Israel was included the European region due to its proximity to the European region and similar living habits as opposed to Asian region, which mostly include Southeast Asian countries. In general, only a limited number of countries/regions have compulsory Salmonella reporting requirements such as Member States in Europe, including Iceland, Norway, Switzerland, the Pan American region, Thailand, Japan, New Zealand, South Africa, the United States, and Canada (
Institutional data.
Institutional data.
Institutional data.
Institutional data.
Descriptive analyses
Descriptive analyses, at the national and regional level, of the proportion of serovars were performed, based on the data reported by the countries/institutions.
Further descriptive analysis on the observed differences in serovar distribution was performed using classifications provided by the International Monetary Fund (
Results
Content of the data set
The final data set extracted from the CDB and included in this article originated from 37 countries (Public Health Laboratories) within six regions. Out of the 37 countries, 31 submitted a national data set from a national reference laboratory. For Cameroon, Malaysia, Belarus, Croatia, Germany, and Malta, where data were not submitted from a national reference laboratory, we included data from an institute that met the quality standard threshold of the EQAS.
Data from an additional 38 laboratories from 35 countries that participated in one or more EQAS iterations were excluded from analysis for the following reasons: the laboratory failed to meet the quality threshold of the EQAS (18 laboratories) (i.e., >1/8 deviations from the expected results), the laboratory uploaded institutional data, but national data were available and included (8 laboratories), or because the laboratory did not submit data of human origin (12 laboratories).
During the study years 2001–2007, the number of countries in this subset of the CDB submitting data which differed per year, with 33 countries submitting data in 2001, 34 in 2003, 22 in 2005, and 19 in 2007.
The average number of isolates serotyped per 100,000 inhabitants per region in all years fluctuated from 3.5 in the Latin American region to 82.4 in the Oceania region. However, the average number of isolates serotyped per 100,000 inhabitants by all countries decreased over the years from 9.1 in 2001 to 1.9 in 2007.
A large variation in the number of serovars was observed at the regional level. Salmonella serovars Enteritidis and Typhimurium were reported among the top 15 most common serovars in all regions. However, the number of additional serovars that were present in the top 15 most commonly reported differed from region to region with 90 serovars in the European region, 20 in North American, 29 in Oceania region, 71 in Africa, 57 in Latin American, and 52 in the Asian region. Potentially, these numbers might be affected by the number of countries submitting data form each region.
For Salmonella serovars Enteritidis and Typhimurium, the proportions reported by each country were plotted by region. A trend line was drawn on these plots over years (Figs. 1 and 2). In the following step, proportions were estimated at the country development level, grouping all the participating countries into developing and developed countries. Trends over the years were plotted, again demonstrating differences in the proportion trends among the evaluated groups (Fig. 3).

Distribution of Salmonella Enteritidis proportions and trends between 2001 and 2007, by region, based on data submitted by 37 selected countries.
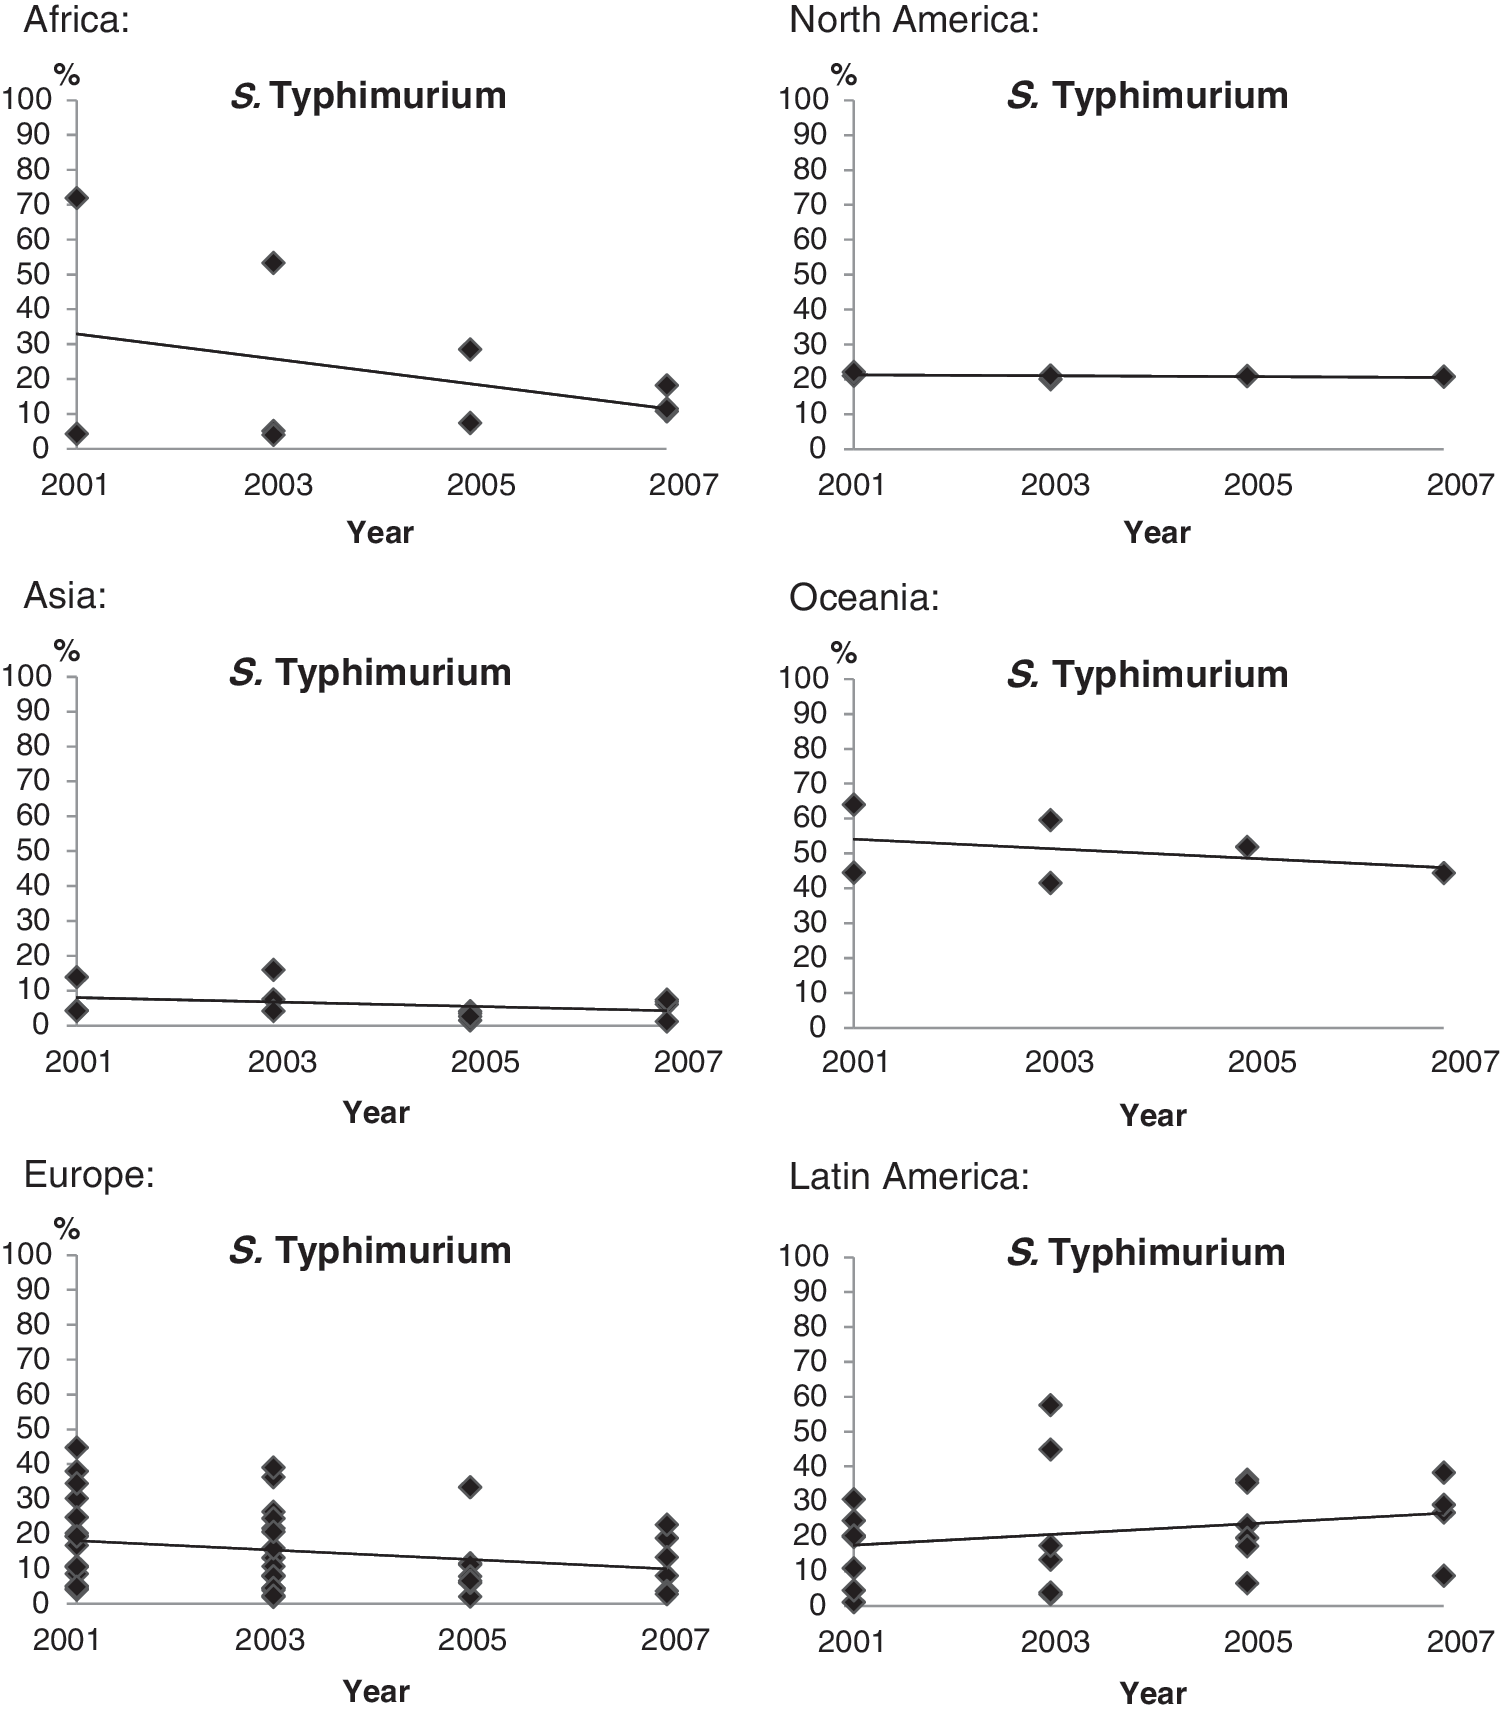
Distribution of Salmonella Typhimurium proportions and trends between 2001 and 2007, by region, based on data submitted by 37 selected countries.
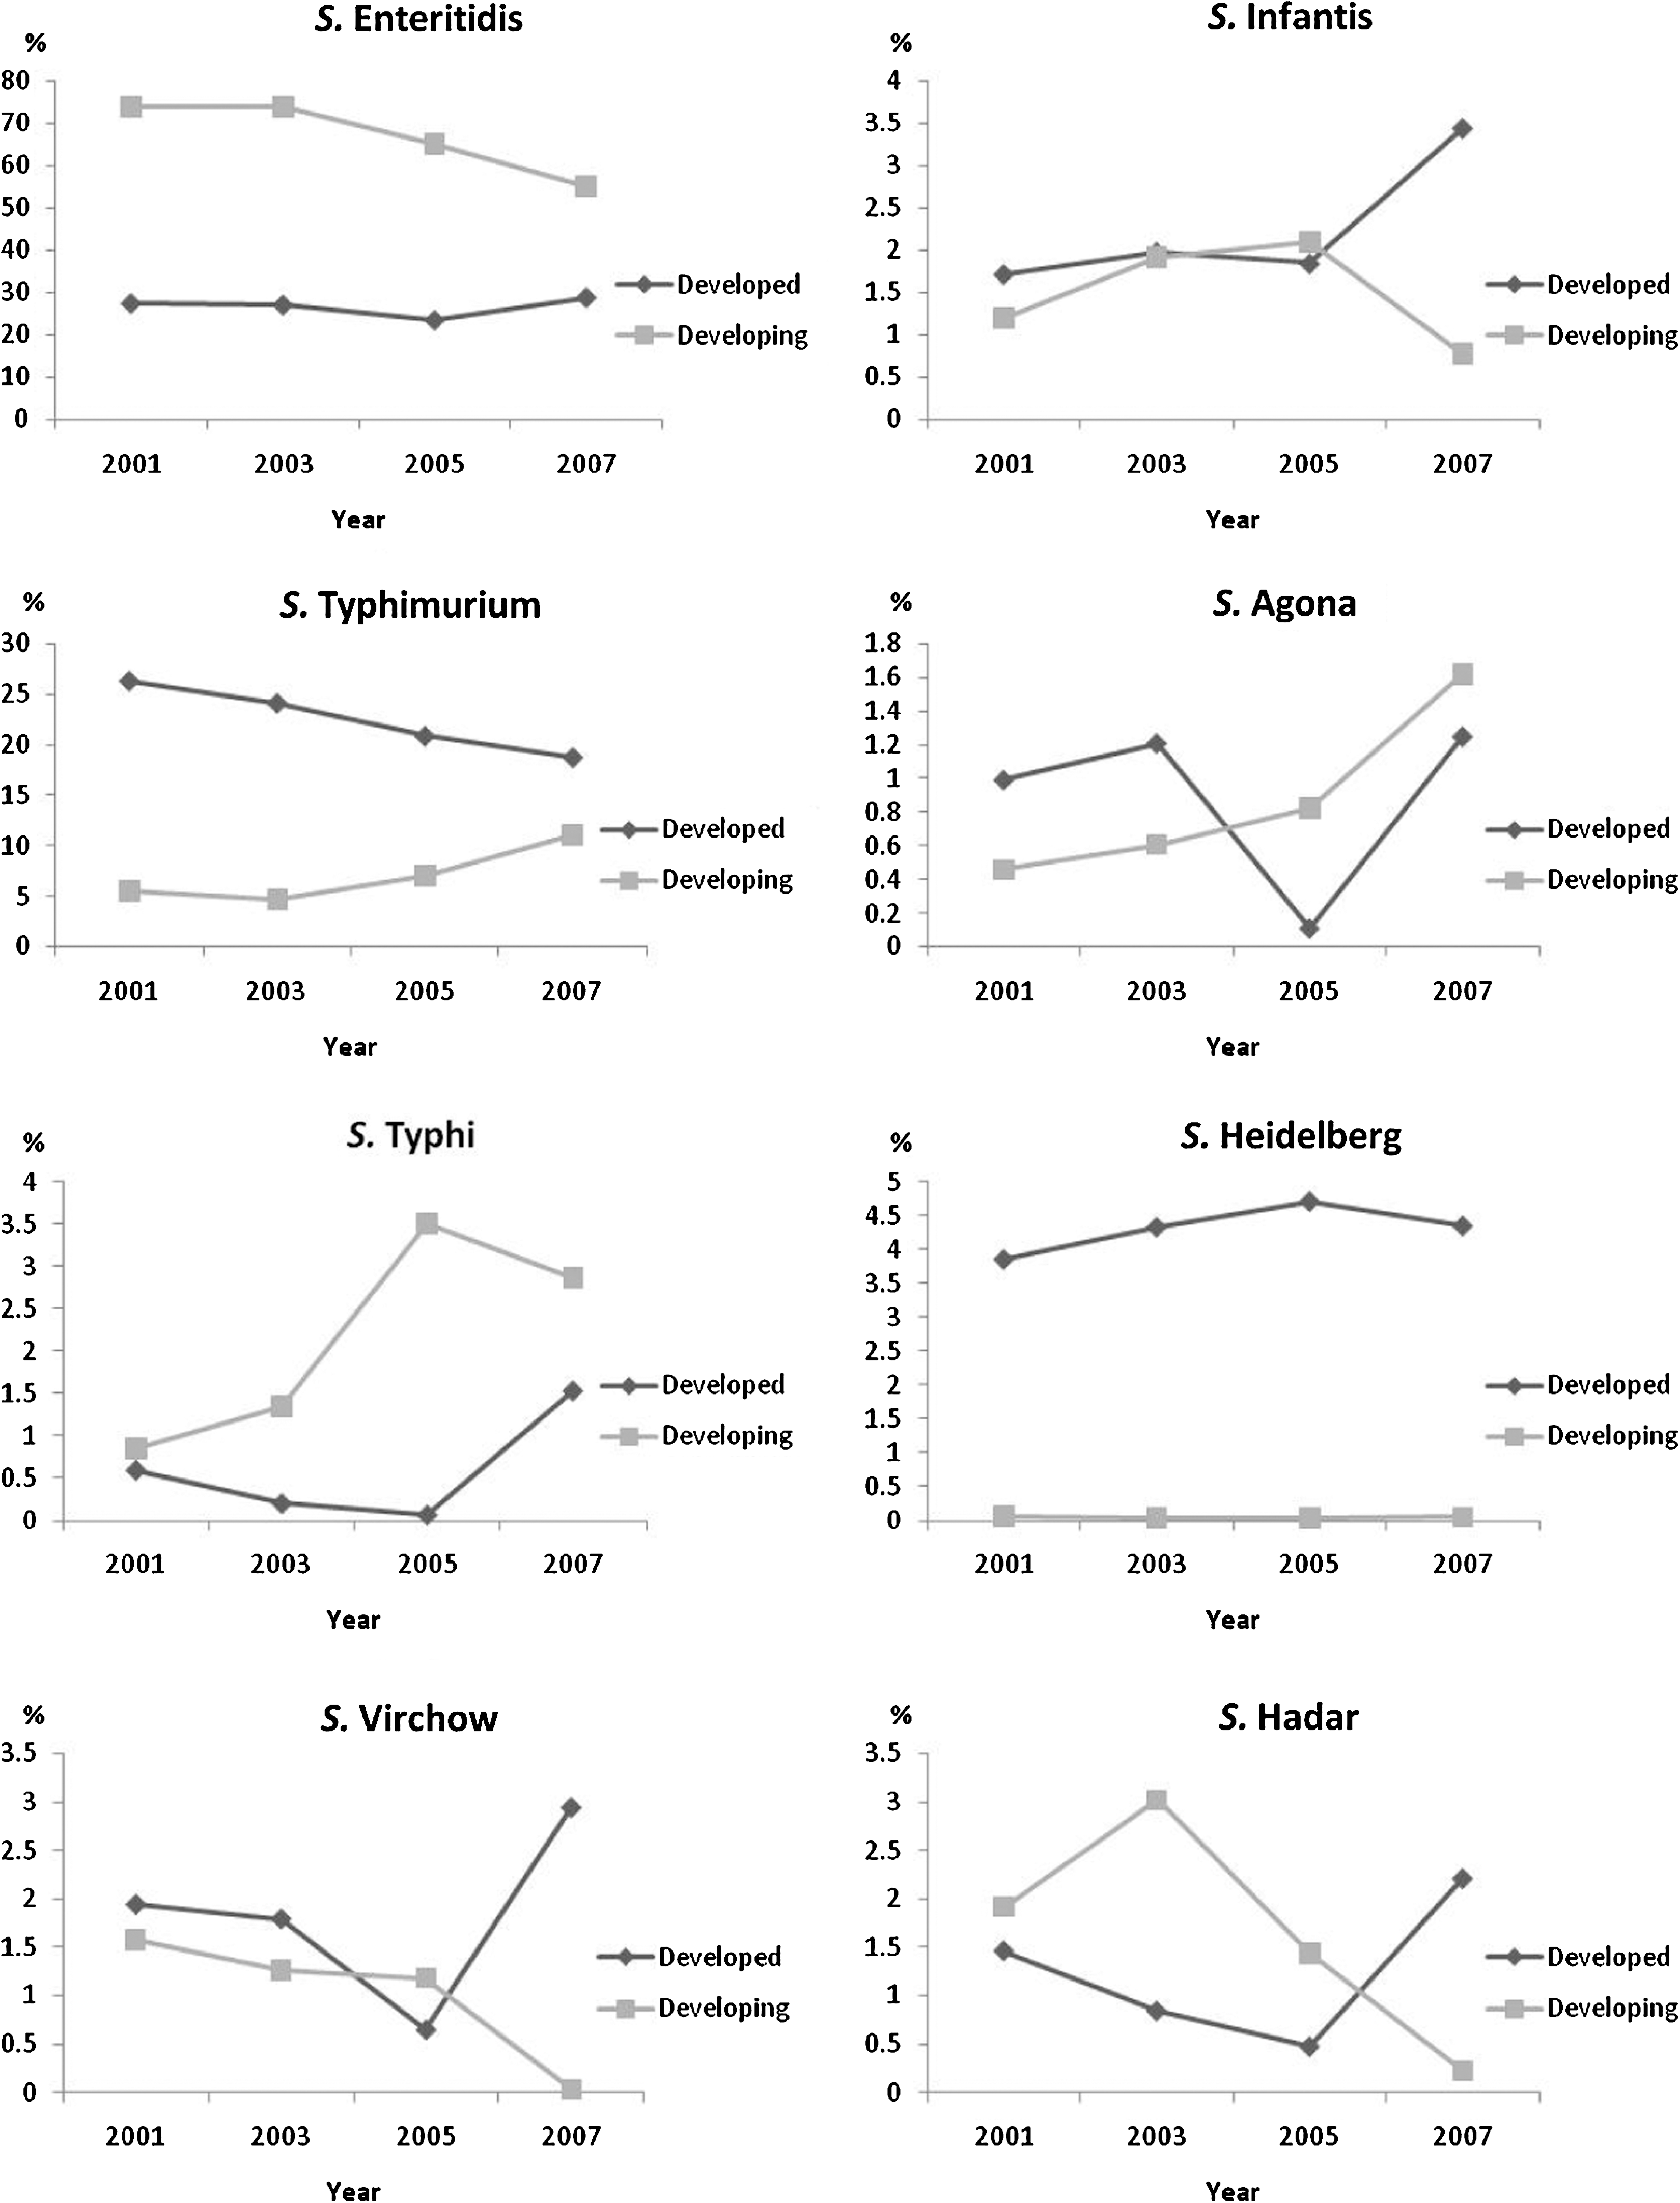
Trends of serovars between 2001 and 2007, by country development status.
Salmonella serovars Enteritidis and Typhimurium
In all regions, with the exception of the Oceania and North American regions, Salmonella serovars Enteritidis and Typhimurium ranked as the most common and second most common serovar, respectively. In the North American and the Oceania regions, Salmonella serovar Typhimurium was the most common serovar reported, and Salmonella serovar Enteritidis was the second most common serovar (Tables 4 and 5).
Globally, the overall proportion of Salmonella serovar Enteritidis and Typhimurium was 43.5% and 17.1% with Salmonella serovar Enteritidis ranging from 40.6% in 2005 to 44.9% in 2003 and Salmonella serovar Typhimurium ranging from 15% in 2007 to 18.9% in 2001 (Fig. 4). We observed an overall decrease in the proportion of Salmonella serovar Enteritidis in developing countries from 73.9% in 2001 to 55% in 2007 and an overall decrease in the proportion of Salmonella serovar Typhimurium in developed countries from 26.4% in 2001 to 18.8% in 2007 (Fig. 3). Further, the changes in proportions differed between regions and countries, where the distribution of serovar proportion of Salmonella serovar Enteritidis presented an increase in Africa (16.7% in 2001 to 32.2% in 2007), Oceania (5% in 2001 to 11.3% in 2007), and the North America (18.4% in 2001 to 25.7% in 2007). In Europe, the proportion of Salmonella Enteritidis increased until 2005 (from 66.3% in 2001 to 75.7% in 2005), but decreased in 2007 (60.9%) (Fig. 1). Salmonella serovar Typhimurium increased in Latin America (14.5% in 2001 to 24% in 2007), but decreased in all other regions (Fig. 2). In Asia, the Salmonella serovar Typhimurium decreasing trend between 2001 and 2005 (from 5.5% to 3.1%) was followed by an increase in 2007 (6.8%).
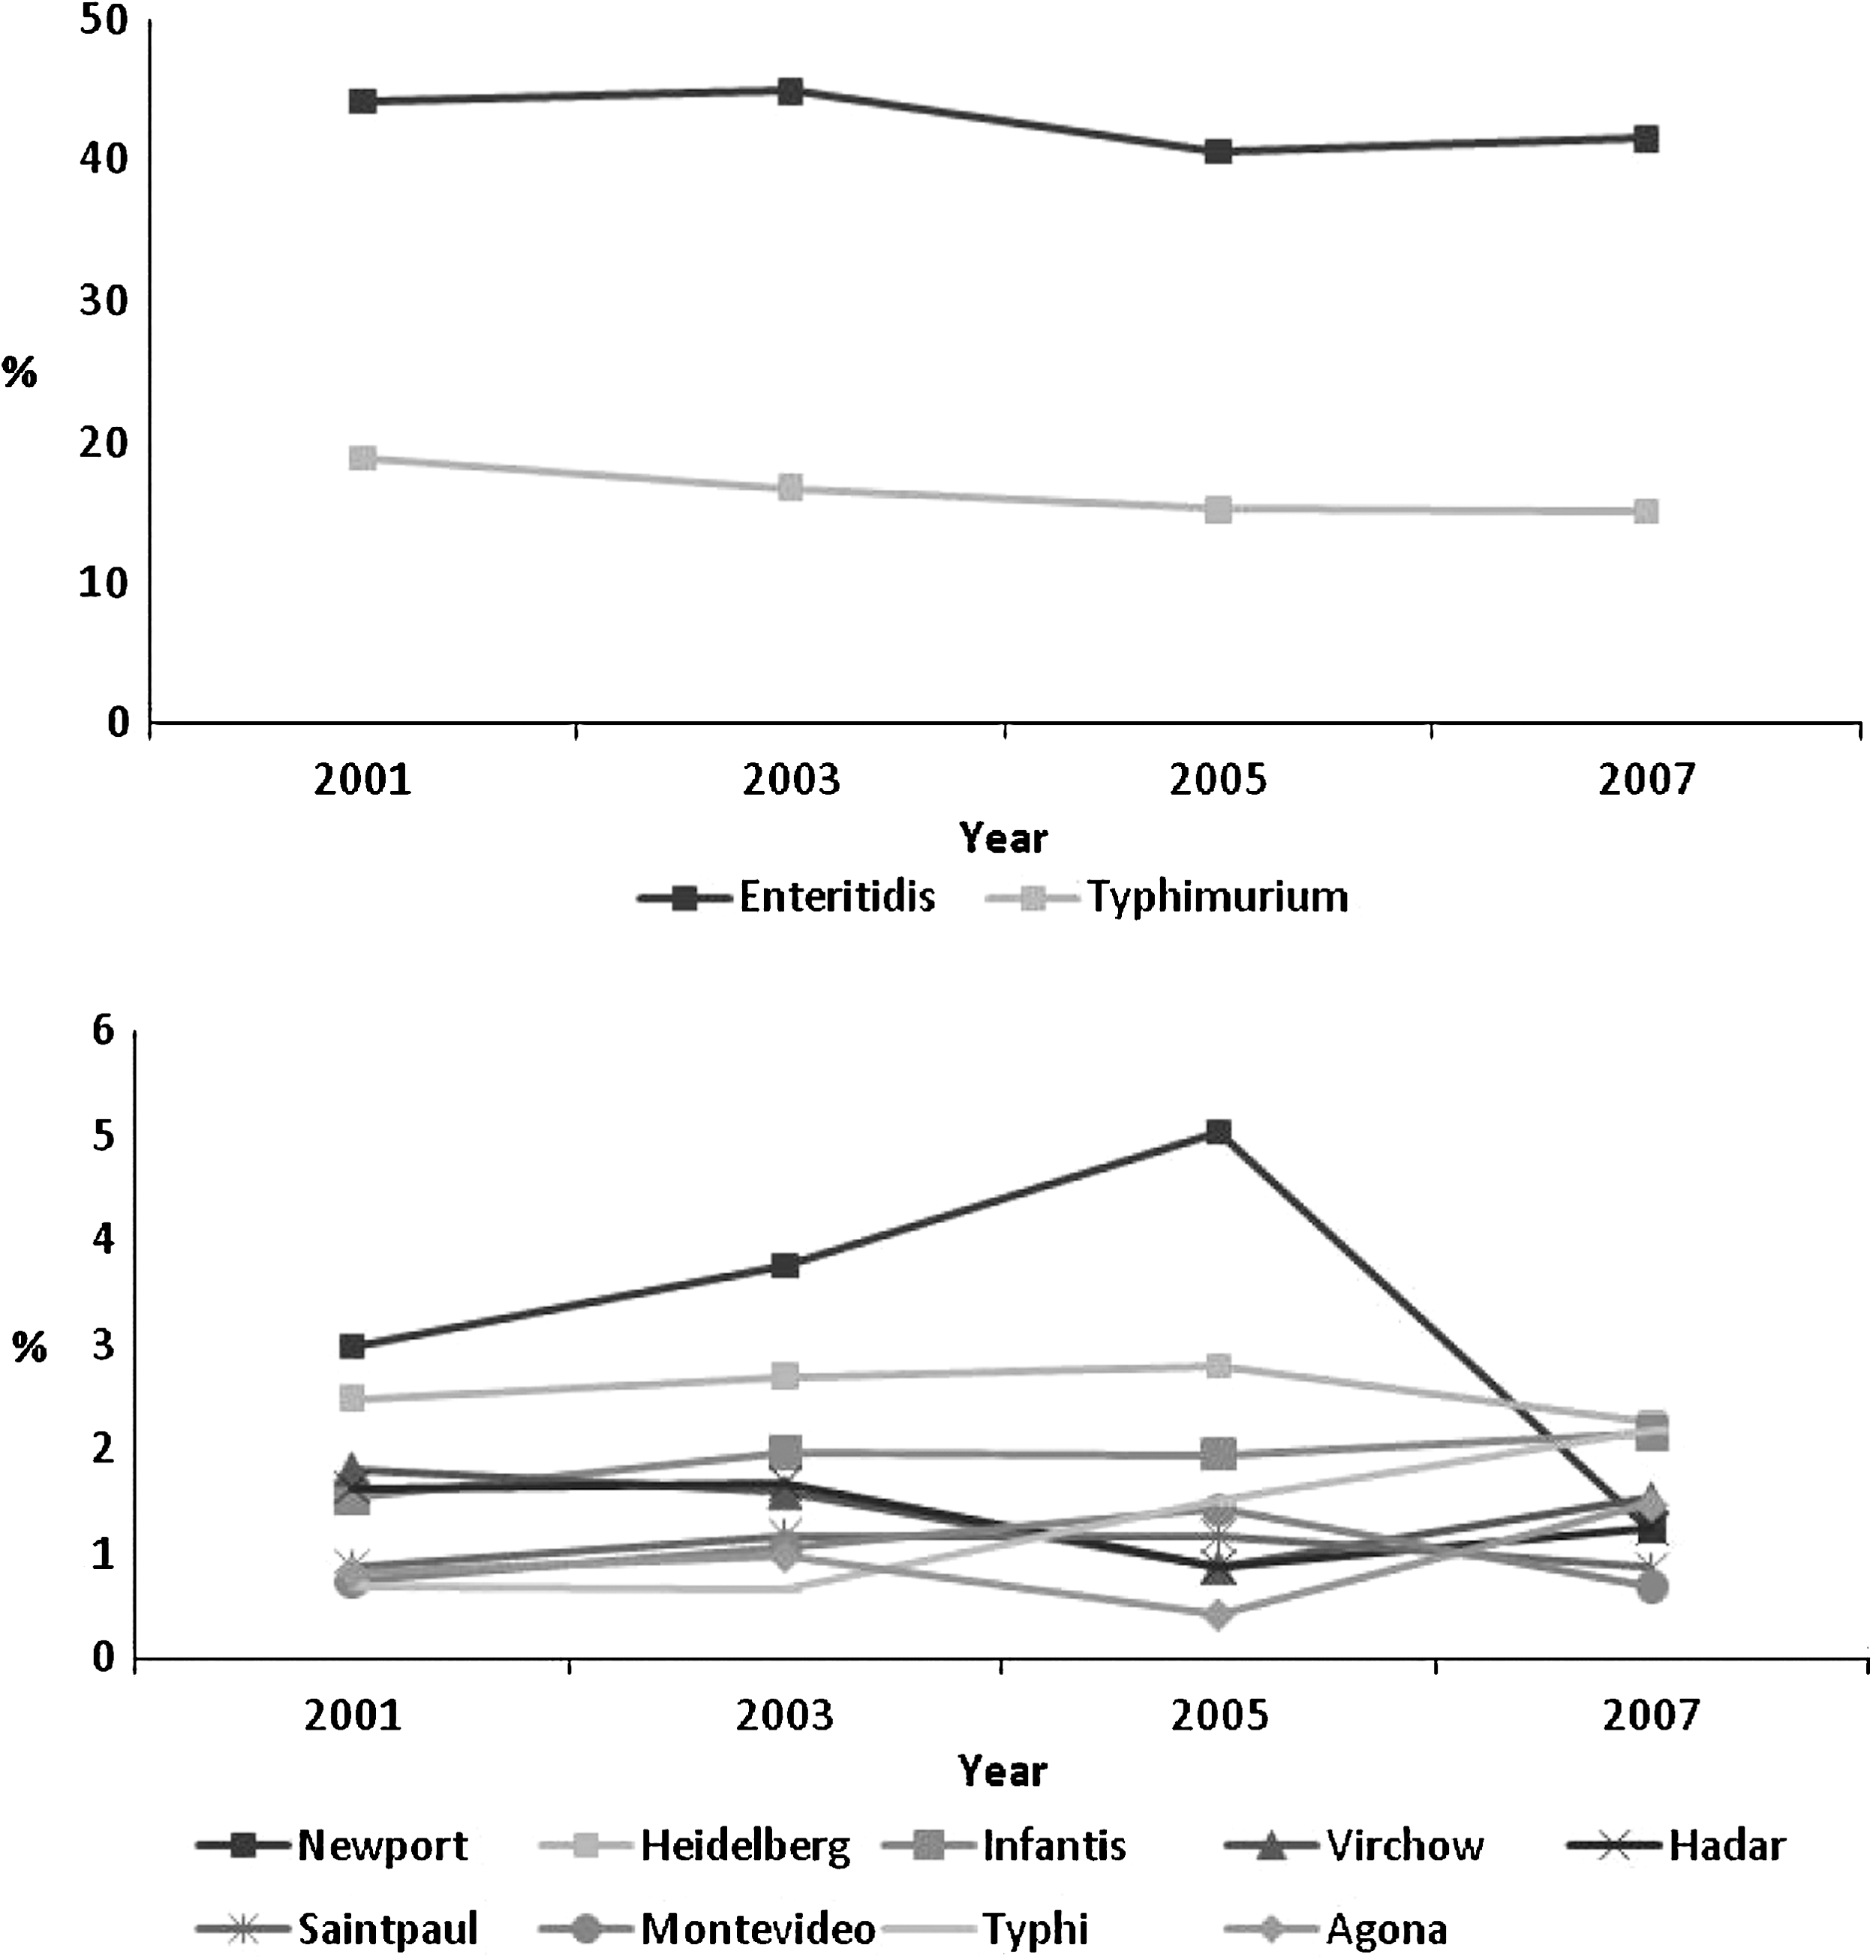
Overall distribution of specific Salmonella serovar proportions in 37 selected countries over time.
The changes were not equally distributed between countries within the same region. Thus, the increase of Salmonella serovar Enteritidis in Africa was due to a major increase of this serovar in Tunisia, and the decrease of Salmonella serovar Typhimurium was mainly due to a decrease of this serovar in Cameroon (Table 1). Similarly, the decrease of Salmonella serovar Enteritidis in Asia was due to decreases in Japan and Korea (Table 2). Salmonella serovar Enteritidis increased in three countries of Latin America, but decreased in four (Table 6).
Salmonella serovar Typhi
An increase in the proportion of Salmonella serovar Typhi in all regions combined was initially observed in 2003. Since 2003, the overall proportion of Salmonella serovar Typhi has increased from 0.7% 2001 to 2.2% 2007 (Fig. 4). This increase was observed in both developed countries, mainly driven by New Zealand, and developing countries, during the studied period (Fig. 3).
In the Oceania region, Salmonella serovar Typhi was the 15th most common serovar reported to the CDB (Table 5). A similar level was also observed in the North American region, being mainly represented by Canada (Table 4). In the African region, Salmonella serovar Typhi was ranked as the fifth most common serovar. In Senegal, Salmonella serovar Typhi decreased from 7.8% in 2001 to 4.9% in 2007 (Table 1), whereas in Cameroon, the proportion of Salmonella serovar Typhi increased from 5.4% (2001) to 16.2% (2007) and was first reported in Tunisia among the top 15 in 2007 (Table 1).
All countries in the Latin American region, with the exception of Costa Rica, Paraguay, and Uruguay, reported Salmonella serovar Typhi among the top 15 most common serovars nationally. In Brazil and Chile, the proportion decreased from 9.7% in 2001 to 3% in 2007 and from 15.4% in 2001 to 4.1% in 2007, respectively, whereas the proportion increased in Colombia from 2.1% in 2001 to 12.2% in 2007 (Table 6). In the Asian region, Salmonella serovar Typhi was the third most common serovar reported by the Republic of Korea and the most common serovar reported by Malaysia and the Philippines (Table 2). In the European region, Salmonella serovar Typhi was, in general, listed only as the 35th most common serovar (data not shown).
Other nontyphoidal Salmonella serovars
In addition to Salmonella serovars Enteritidis and Typhimurium, Salmonella serovar Infantis was also among the serovars reported from all regions (Tables 1 –6). Globally, the overall proportion of Salmonella serovar Infantis ranged over the years, from 1.5% to 2.2% (Fig. 4). The increase was mainly associated with the developed regions (Fig. 3). The serovar was ranked as the fifth most common serovar in the European region (Tables 3a and 3b).
Salmonella serovar Agona was frequently observed in Latin America, ranking among the top three most common nontyphoidal serovars. This serovar was also ranked 7th in Europe and 13th in North America (Tables 3a, 3b, and 4). Overall, the proportion of this serovar changed from 0.8% to 1.5% between 2001 and 2007. This increase was observed in both developed and developing countries, and was accentuated between 2005 and 2007 (Fig. 3).
Heidelberg was much more common among developed countries and ranked 4th in North America, whereas lower frequencies were seen in Europe (9th) and Latin America (19th) (Tables 3, 4, and 6). It is noteworthy that Salmonella serovar Heidelberg was not found among the 20 most common serovars in the African and Asian region.
Salmonella serovar Virchow was only reported among the top serovars in Asia, Europe, and the Oceania regions. However, in these regions, Salmonella serovar Virchow often represented a high proportion of the Salmonellae isolated from countries (Tables 2, 3, and 5). The overall proportion of this serovar has fluctuated over the years (Fig. 4) and since 2005, an increase, mainly driven by Israel and New Zealand, has been seen among developed countries with proportional decrease reported by developing countries (Fig. 3).
High frequencies of Salmonella serovar Thompson were seen in Europe and North America (Tables 3 and 4). Additionally, Salmonella serovar Newport has consistently been reported among the top six serovars by the North American, European, and Latin American regions. Nevertheless, the overall proportion of Salmonella serovar Newport, increased from 3% in 2001 to 5% in 2005, but showed a decrease in 2007 (1.2%) (Fig. 4). Salmonella serovar Oranienburg was only observed in North and Latin America and was reported as the 10th and 15th most common serovar, respectively (Tables 4 and 6).
Salmonella serovar Hadar and Salmonella serovar Montevideo were reported by almost all regions. However, the frequencies varied considerably. Salmonella serovar Hadar was observed among the top three serovars in Europe, but was seen at lower frequencies in other regions (Tables 3a and 3b). Finally, Salmonella serovar Montevideo was more common in North and Latin America (the United States, Argentina, and Chile), whereas Salmonella serovar Saintpaul was more predominant in Oceania and North America (Tables 4 –6).
Discussion
The data presented in this study are the first attempt to establishing a global monitoring based on quality-assured data of the occurrence of Salmonella infections in humans. In general, the highlighted serovars among humans presented by Galanis et al. (2006), based on nonselected data available in the CDB between 2000 and 2002, seem to be in agreement with the data from this study submitted by laboratories that perform at or above the quality standard threshold of the EQAS. This observation suggests that the majority of the human data in the CDB could be regarded as valid and therefore be included in future analysis of aggregated data. However, as the EQAS results of individual laboratories are confidential, the general user of the CDB data cannot assess the validity of data provided by a single source. Therefore, care should be taken when interpreting results from direct comparisons between single countries, especially when these are geographically distinct and have no links through travel or trade.
In this study, the data provide microbiologists and epidemiologists with a unique tool to understand the epidemiology of Salmonella worldwide in humans. Today, we are all residents of a global village; with the increased trade of food, animal feed, and livestock, as well as increased travel and human migration, infectious disease is no longer confined to a single country. The data presented in this study reveal the complexity of global epidemiology, particularly as frequency and occurrence change over time in countries and regions. Epidemiologists may gain valuable knowledge for outbreak detection and hypothesis generation regarding the origin of the infections by knowing which serovars predominate in which regions. This information may lead an investigation to a specific country to which patients have traveled or to where a certain food source originates. This quality-assured monitoring data can also serve as a tool for launching targeting interventions to diminish the burden of salmonellosis caused by specific serovars since limited surveillance data are public available. The data reveal that developing regions may harbor a potentially broader serovar spectrum to foster new emerging serovars that could be critical for global food safety. This may require food safety authorities to take alternative actions in implementing intervention and control programs in reservoirs of specific predominant Salmonella serovars. This could, for instance, be a targeted early action to decrease the frequency of Salmonella serovar Typhi in a specific region or against Salmonella serovar Infantis, which are increasing heavily in Europe (Anonymous, 2007d). Further, it is necessary to encourage food and veterinary institutes to upload additional data to the CDB, which might reveal linkages between human illness and the different reservoirs of the Salmonella serovars.
There were major differences among the most commonly isolated serovars between regions, but fewer differences between countries within the same region. In addition, we observed major differences between countries and regions in serovars detected by year, and we believe that several parameters may have influenced these differences. In developed countries, the production of food animals are limited to the most common species/breeds and the production systems are often effective and high scale (Swanson, 1995). In addition, the production stock commonly stems from highly centralized rearing facilities. This has a great potential for spread of one or more Salmonella serovars to a large number of herds and flocks, as was demonstrated by the Salmonella serovar Enteritidis pandemic throughout the 1990s, which affected both developed and developing countries. In developing countries, the production scale is normally not intensive. In addition, developing countries in tropical regions typically raise native crops and animals that are then consumed locally. This locally produced food may harbor a greater diversity of less commonly reported serovars.
There are many potential reasons why the proportion of isolates serotyped may differ between countries. An apparent reason may be due to geographical, cultural, or socioeconomic factors in-country that limit the population's access to medical care; limited access to laboratory testing; or a truly low proportion of serotyped Salmonella in these countries due to a low number of human cases. In contrast, a high proportion of isolates serotyped may be due to a national outbreak in a specific year or time period. The CDB does not gather this information when representatives submit data from their countries. The proportion of serotyped isolates is certainly also influenced by active surveillance programs that are in place in several countries. Potentially, there might be huge variations in the surveillance systems between the countries including when isolates are forwarded to the national reference laboratory. Therefore, the representativeness of the data at the national level is likely not the same in all countries, the data from countries with few isolates likely being less reliable than the ones from countries where many isolates are submitted. However, we believe this to have a minor effect on the ranking of the serovars, as long as the data are captured from a representative sample of the population.
Salmonella serovars Enteritidis and Typhimurium
Consistent with other compulsory Salmonella surveillance reporting's from New Zealand (Anonymous, 2007a), South Africa (Anonymous, 2007c), the United States (Anonymous, 2008), Canada (Anonymous, 2007b), Europe (Anonymous, 2007d), and Thailand (Anonymous, 2006), our data revealed that Salmonella serovar Enteritidis, followed by Salmonella serovar Typhimurium, were the most frequently isolated serovars from humans worldwide. This trend was also observed in an article describing nonselected data from the CDB in 2000–2002 (Galanis et al., 2006). Interestingly, despite some fluctuations between countries, we observed a global decrease in the proportion of Salmonella serovars Enteritidis and Typhimurium. This decrease could be explained by the intense focus worldwide on these particular serovars and the introduction of specific monitoring and control programs.
Salmonella serovar Typhi
Salmonella serovar Typhi was by far the most commonly reported of the typhoidal serovars and present among the top 20 most common serovars in almost all of the regions, including both developing and developed countries. However, specific countries—Argentina, Brazil, Chile, Columbia, Peru, Philippines, and Malaysia—and regions—Latin America and Southeast Asia—seem to be much more affected by this serovar than others. Our data correspond well with the data from the Pan American Health Organization showing that most of the countries in this region have Salmonella serovar Typhi ranked among the top five most common serotypes (Anonymous, 2004). In endemic countries, typhoid fever is typically associated with poor sanitation (Vollaard et al., 2004); in developed countries, most cases of typhoid occur in travelers returning from developing countries (Steinberg et al., 2004). While the epidemiology of typhoid varies by development status, these data suggest that there is a need to increase awareness and prevention measures of typhoidal Salmonella in both developed and developing countries.
Other nontyphoidal Salmonella serovars
A few serovars predominate worldwide, which we believe to be caused mainly by central rearing of production animals, international trade of food, animal feed and livestock, and travel. It was not possible to test these hypotheses within the scope of these data, but several publications/surveillance reports support the observation that serovars follow trade patterns. For example, a recent outbreak in the United States was caused by Salmonella serovar Saintpaul, which originated from imported jalapenos peppers from Mexico [Centers for Disease Control and Prevention (CDC, 2008)]. In 2004, several countries in Europe also observed a regional outbreak caused by Salmonella serovar Thompson in rucola lettuce originating from one producer in Italy (Nygård et al., 2008). Data from recent studies have also identified indistinguishable pulsed-field gel electrophoresis patterns of Salmonella serovar Schwarzengrund from patients in Denmark, the United States, and Thailand and chicken meat originating from Thailand (Aarestrup et al., 2007). Similarly, identical clones of Salmonella serovar Rissen were found among Thai patients and Danish patients with a history of travel to Thailand (Hendriksen et al., 2008). Source attribution data from Denmark also support that trade and international travel play a major role in the transmission of Salmonella (Hald et al., 2007).
It is noteworthy that while Salmonella serovars Enteritidis and Typhimurim decreased during the observational period, a number of other serovars such as Salmonella serovars Typhi, Infantis, and Virchow increased in relative importance. This is also in agreement with what have been observed in many other countries/regions such as in Europe (Anonymous, 2007d) and New Zealand (Anonymous, 2007a). This could indicate that some of the control measures taken against Salmonella serovars Enteritidis and Typhimurium are not equally efficient against other serovars, or that other sources that act as reservoirs for these serovars have become increasingly important (e.g., unconventional food animal species, wild or free-range domestic animals). Therefore, we may have to develop and implement novel control strategies for these serovars. To determine the sources toward which control programs should be initiated, as well as to determine the impact of the programs in place, there is a continuing need for national, regional, and global monitoring.
The data set and limitations
This study is based on reported data from 37 countries. This only represents about 20% of all WHO Member States. We observed huge differences between the representativeness of the data from different regions: Asia was represented by five countries, of which the two largest (China and India) were not being represented; Africa was represented by only three countries, and North America and Oceania by two countries each. Together with the irregular reporting performed by some countries, providing data only for some of the evaluated years, this could affect the overall interpretation of the results. One would also expect higher degrees of participation from developed countries such as in Europe, where resources for isolation, identification, and serotyping of Salmonella to a large extend are available. The reason why only a limited number of countries from Europe have been included in this study was not because of them not qualifying. We believe that the reason is that in Europe, the monitoring of Salmonella offered by the European Union is mandatory (Anonymous, 2007d). Many European countries see no reason to participate/submit data to two surveillance systems. Despite the lack of participation from European countries, our results correspond well with the data collected annually by the European Food Safety Authority (Anonymous, 2007d).
Salmonella serovar Typhi is endemic in many developing countries, that is, countries with weaker health-care systems than industrialized countries. In such countries, we would expect the chance of getting diagnosed (and the disease reported) with typhoid fever is much higher than for noninvasive serotypes. In this study, it might result in an over-representation of this invasive serovar why it should be interpreted with care.
In the period 2001–2007, only data from every second year were included in the study for easy of analysis and interpretation. Despite the fact that some geographical regions are represented by a limited number of countries and only data of every second year were included, we assume that the data are broad enough and of sufficient quality to describe global trends in Salmonella serovar distribution.
Institutional data from Cameroon, Malaysia, Belarus, Croatia, Germany, and Malta were included to obtain a better coverage of countries in the regions (Tables 1 –6). For some countries, national data submitted by the national reference laboratory might have also included data collected from other institutes that may or may not have been participating in the EQAS program. Consequently, the validity of these data is not entirely known, but is expected to be high, based on the skills and quality of the national reference laboratories.
The data sets in the CDB are limited to the proportion of the top 15 most commonly found serovars and the total number of samples serotyped per country and per year. Due to this limitation not all serovars isolated in a specific country are included, for example, top 15 most common serovar observed. This limitation also results in a limitation in the summary of the regional top 20. WHO GFN has as a result of this limitation decided to expand the CDB to in the future to cover all serovars reported by the respective countries.
In general, we observed a decreasing number of isolates being serotyped and the number of isolates available for the analysis was variable and being very small in some countries. It is generally recognized that salmonellosis is not decreasing at the global level. However, we do not know if this reflects a global decrease in national funds available for this area of public health care, or fewer countries reporting to the CDB. It is a problem that the number of countries providing data to the analysis decreased over time why WHO GFN needs to encourage participants to ensure a more timely submission of data. The same delay in reporting surveillance data has also been observed in European surveillance program where the notification rates decreased from ∼44% in 2004 to ∼33% in 2007 (Anonymous, 2007d).
The CDB was designed to be a self-updating database where the designated members are responsible for populating the database. However, the submission of data to the CDB is voluntary, and the task is not always automatically transferred to a successor when a designated member institution representative leaves the post.
Conclusion
The outcome of this study shows large differences in the top 20 most commonly isolated serovars between regions, but lesser differences between the top 15 most commonly isolated serovars between countries within the same region. Noting this, a few serovars are more frequent than others in many of the regions and countries. Additionally, we observed that the consistency with which serovars were reported by the countries varied by both region and development status. In general, the serovar spectrum and serovar distribution reported by developed countries remained relatively consistent over the years in comparison with what was observed in developing countries, showing considerable year-to-year variability in both the serovar spectrum and serovar distribution. Our findings highlight the complexity of the global epidemiology of Salmonella and the urgent need and importance for improving monitoring data of those serovars of highest epidemiologic importance and initiate early actions to control further spread of those serovars. We also advise carefully monitoring some serovars on a global level, such as Salmonella serovars Infantis, Hadar, Newport, Virchow, and Agona. In addition, the data show a decreasing tendency to isolate and serotype in the countries included this study. This is a concerning trend as isolates and the subtype data obtained from them are the cornerstone of laboratory-based surveillance systems for Salmonella. We encourage laboratories to work with their clinical counterparts to increase the number of samples submitted for culture and serotyping. We also stress the use of quality methods and the timely reporting of data to national surveillance networks. The effect of using quality-assured data, based on EQAS participation, was minor, but we recommend using aggregate data in contrast to data originating from single institutes. The data presented in this study may guide the development of regional and serovar-specific intervention and control programs. As such, we urge food and veterinary institutes to upload the data on the 15 most commonly isolated Salmonella serovars to the CDB. Nonhuman data are essential to the CDB; these data, when supplemented with human clinical data, can help to identify important reservoirs and help initiate longer-term prevention and control measures.
Footnotes
Acknowledgments
We are grateful to Dr. Frederick J. Angulo, Miss. Stephanie M. DeLong, and Mr. Matthew Mikoleit (CDC) for reviewing the article and improving the English. This work was supported by the WHO GFN (
Disclosure Statement
No competing financial interests exist.