
Abstract
A common approach to reducing microbial contamination has been the implementation of a Hazard Analysis and Critical Control Point (HACCP) program to prevent or reduce contamination during production. One example is the Pathogen Reduction HACCP program implemented by the U.S. Department of Agriculture's Food Safety and Inspection Service (FSIS). This program consisted of a staged implementation between 1996 and 2000 to reduce microbial contamination on meat and poultry products. Of the commodities regulated by FSIS, one of the largest observed reductions was for Salmonella contamination on broiler chicken carcasses. Nevertheless, how this reduction might have influenced the total number of salmonellosis cases in the United States has not been assessed. This study incorporates information from public health surveillance and surveys of the poultry slaughter industry into a model that estimates the number of broiler-related salmonellosis cases through time. The model estimates that–following the 56% reduction in the proportion of contaminated broiler carcasses observed between 1995 and 2000–approximately 190,000 fewer annual salmonellosis cases (attributed to broilers) occurred in 2000 compared with 1995. The uncertainty bounds for this estimate range from approximately 37,000 to 500,000 illnesses. Estimated illnesses prevented, due to the more modest reduction in contamination of 13% between 2000 and 2007, were not statistically significant. An analysis relating the necessary magnitude of change in contamination required for detection via human surveillance also is provided.
Introduction
F
Foodborne illness is often the result of an acute microbial pathogen exposure. Many countries have surveillance systems to monitor occurrences of these illnesses and estimate the total number of these illnesses for the pathogen of interest (Mead et al., 1999; de Jong and Ekdahl, 2006; Scallan et al., 2011). For example, the FoodNet surveillance system in the U.S. monitors pathogen-specific illnesses (Wallace et al., 1997). Given the imperfections of surveillance systems, however, substantial uncertainty surrounds the estimated number of illnesses (Powell et al., 2000; Ebel et al., 2004; Scallan et al., 2011).
To determine the number of pathogen-specific illnesses associated with a particular food commodity requires partitioning of the human disease burden to specific sources that is referred to as source attribution (Batz et al., 2005; Pires et al., 2009). A number of different approaches exist for assessing attribution fractions (Batz et al., 2005). Examples of attribution studies that use epidemiologic evidence to support estimation of the risk from various food products include the microbial subtyping approach of Hald et al. (2004) and Guo et al. (2011) and the analysis of outbreak data (Pires et al., 2010; Painter et al. [in review]).
In the United States, the pathogen reduction/Hazard Analysis and Critical Control Point (PR/HACCP) program was implemented by FSIS in the mid- to late-1990s (USDA, 1996). The emphasis of this program has been reducing Salmonella and Escherichia coli O157:H7 in meat and poultry. Since the inception of the PR/HACCP program, the frequency of contaminated carcasses has decreased, particularly for broiler chickens (FSIS, 1996a, 2001, 2011a; Wilhelm et al., 2011). Since the inception of the FoodNet surveillance during the 1996–1998 timeframe, there is some evidence that human Salmonella and E. coli O157:H7 illnesses have decreased (CDC, 2002). It is possible that these patterns are related and that PR/HACCP is responsible for some of the improvements in public health.
One problem with assessing the effectiveness of the PR/HACCP program is that its implementation occurred prior to implementation of the FoodNet surveillance system. In addition, programmatic changes for PR/HACCP and FoodNet during their development confuse interpretations of the evidence generated from the systems. These issues complicate any assessment of the effect of PR/HACPP on public health.
Given the lack of FoodNet data prior to the implementation of PR/HACCP, inferences about the annual number of salmonellosis cases require a risk assessment approach. This approach combines a causal model with available data to predict changes in the frequency of illness (Cox, 2006). Inferences are made using a risk assessment framework that combines information from multiple sources and conditions inferences on available surveillance data (Williams et al., 2011).
This study uses this risk assessment framework to estimate the total foodborne salmonellosis cases and the number of illnesses associated with broiler consumption in 1995, which was prior to the implementation of both PR/HACCP and the FoodNet surveillance system. Estimates of the number of cases in subsequent time periods (2000 and 2007) are used to estimate the change in the total number of illnesses and those attributed to broilers. Results describing the power of the surveillance system to detect changes in illness rates due to changes in contamination of broilers are also provided.
Modeling Framework
Estimating broiler-related illnesses requires partitioning the estimated number of illnesses into those which are broiler-related and those related with other causes. The complexity lies in identifying a model that can be parameterized with the limited available information and adopting a solution technique that can generate inferences with appropriate measures of uncertainty.
Partitioning illnesses into broiler-related and other sources
The number of illnesses reported by a surveillance system (Iobserved ) for a pathogen will differ from the total number of illnesses for the pathogen (Itotal ) and the number of illnesses (Ibroiler ) caused by a product-pathogen pair. The FoodNet surveillance system identifies human cases associated with a pathogen, but it is subject to underreporting bias (Scallan et al., 2011).
Numerous factors relate the total number of illnesses for a single product-pathogen pair to the number of illnesses observed by FoodNet. The first factor describes the number of unreported illnesses (ρ) for each observed FoodNet illness (i.e., Itotal =ρIobserved ). The FoodNet surveillance system covers only a fraction of the population (κ); this fraction is the catchment of the surveillance system. Additional factors are adjustments accounting for the number of illnesses acquired from domestic sources (δ) versus during overseas travel, and the proportion of illnesses acquired from food (φ) as opposed to waterborne or direct contact with animals or infected individuals. These adjustment factors lead to the number of domestically acquired foodborne illnesses being Ifood =δφItotal . Given the total number of foodborne illnesses, another factor is needed that describes the proportion of illnesses, α, attributed to the product of interest. This attribution fraction modifies Ifood to describe the illness rate for the product-pathogen pairing of interest. For this application, interest lies in estimating Ibroiler =α Ifood at different points in time.
These factors modify the number of foodborne illnesses to estimate the number of observed illnesses whose etiology is the pathogen, so that
The total foodborne illnesses attributed to broilers is
Modeling broiler-related illnesses
The annual number of broiler-related illnesses, denoted Ibroiler
, can be determined using three components. The first component is the number of broiler-derived servings consumed annually (N
servings). The second component is the frequency of exposure to contaminated servings (P(exp)). Exposure to a contaminated serving can be defined at any point in the farm-to-table continuum, so we assume P(exp) is proportional to the percent of positives carcasses (i.e., it differs by a multiplicative constant). The third component is the probability that an individual serving, derived from a contaminated carcass, results in human illness. This probability is denoted by P(ill|exp). It summarizes the variable effects of factors such as subdividing carcasses into servings, storage, handling, cooking, and pathogenicity of different strains of the pathogen. Using these three components, we estimate the annual number of salmonellosis cases from broilers as
This formula summarizes the components of a typical food safety risk assessment.
Given the large number of servings, probability theory suggests that the Poisson process reasonably models the number of annual sporadic illnesses (Williams et al., 2011). The number of reported salmonellosis cases is estimated as a function of the observed broiler-carcass prevalence using the following model
Because we want to estimate the number of reported illnesses at different points in time, the parameters of the equation are subscripted for time, t. For example, the catchment of the FoodNet system has changed over time so that the proportion of the population under surveillance in 2000 and 2007 was κ2000=0.109 and κ2007=0.152, respectively. Poisson rate parameters for other parameters (Table 1) can be formed and similarly subscripted (e.g., λ broiler,t , λ food,t ). We use the year 2000 as a baseline because data are available from various sources to parameterize all parts of this model and because the change in illnesses between 1995 and 2000 is of primary interest. We use Equation 1 as a likelihood function in a Bayesian framework (Green et al., 2000; Powell et al., 2006; Williams et al., 2011) and construct prior distributions, which are summarized in Table 2, using available data. This model predicts illnesses in 1995 (i.e., prior to FoodNet implementation) and compares the numbers of illnesses to the years 2000 and 2007.
Empty boxes indicate that the parameter is treated as a latent variable in the Bayesian model.
Inferential approach
Williams et al. (2011) describe Bayesian approaches that combine data from multiple sources to make inferences about the various components of a model. One approach uses Bayesian Monte Carlo techniques that incorporate the sampling-importance-resampling (SIR) routine (Rubin, 1987; Raftery et al., 1995; Powell et al., 2006). This Bayesian method provides an objective approach for calibrating a risk assessment model.
The algorithm for implementing the SIR routine is:
(1) Prior distributions describing uncertainty in each parameter of the Poisson distribution are defined (i.e., each component of
(2) A large number (n=6,000,000) of random samples are drawn from each distribution and the parameters are combined to estimate the rate parameter for the number of observed illnesses in 2000.
(3) A weight wi is assigned to each sample by determining how likely the observed number of illnesses (Iobserved ,2000) is for each of the n rate parameters; this step assumes a Poisson likelihood function.
(4) A with-replacement sample of size m<< n is chosen from the n original samples using sample weights wi (m=300,000).
(5) The with-replacement sample is a posterior predictive distribution. Inferences are derived by combining the appropriate parameters as described in Table 1. Random variables (e.g., Ik,t
) are modeled as functions of these rate parameters, where k indexes the subpopulation of interest (e.g., k=broiler, total, observed …). Differences in random variables across time (e.g.,
The R software package (R Development Core Team, 2010) was used for modeling, to assess the convergence, and to perform the sensitivity analysis.
The model describing the rate parameter for the Poisson distribution (eq. 1) comprises seven parameters. Development of these parameters (and their uncertainty) requires synthesizing data from numerous sources, which are provided in Table 2.
The attribution fraction α is the one parameter that is not readily available in the literature. An assessment of publically available Centers for Disease Control and Prevention (CDC) outbreak cases for chicken-related illnesses provides a point estimate of α=0.17 (FSIS, 2011b). It assumes only simple foods implicated in outbreaks (i.e., it ignores outbreaks that did not/could not implicate a food vehicle and outbreaks that implicated foods with multiple ingredients); and it determines attribution based on numbers of cases involved in the outbreaks. Measures of uncertainty for the point estimate were derived by examining the effects of reassigning the unattributed illnesses. Using this heuristic approach, the uncertainty distribution chosen had 10th and 90th percentile values for α of 0.1 and 0.4, with a mean of 0.17 (i.e., we are 80% confident the true attribution proportion for broiler chicken-related salmonellosis cases is between 10% and 40%). A uniform distribution was also used in the model to assess the impact of the assumption inherent in this parameter. Outputs modestly differed, but the implications were consistent with those reported below.
Results
Estimating Itotal,t
The model estimates the total number of foodborne salmonellosis cases for the 3 years when broiler surveys were performed by FSIS (Fig. 1). Substantial uncertainty surrounds these estimates; the 5th and 95th percentiles range from as few as approximately 710,000 in 2000 to as many as 1.6 million illnesses in 1995. There is more uncertainty about total salmonellosis cases for 1995 because that distribution is the result of a prediction from the model, rather than being directly generated from FoodNet data (as is the case for the 2000 estimates). Note that there is a slight increase in the total number of illnesses between 2000 and 2007; an increase of 21 million persons in the U.S. population and the increased consumption of chicken likely drives this increase.

Distributions of the predicted total number of salmonellosis cases in the United States in 1995, 2000, and 2007. Vertical lines represent the 5th, 50th, and 95th percentiles of the distributions. Histograms
Estimating Ibroiler,t and
\documentclass{aastex}\usepackage{amsbsy}\usepackage{amsfonts}\usepackage{amssymb}\usepackage{bm}\usepackage{mathrsfs}\usepackage{pifont}\usepackage{stmaryrd}\usepackage{textcomp}\usepackage{portland, xspace}\usepackage{amsmath, amsxtra}\pagestyle{empty}\DeclareMathSizes{10}{9}{7}{6}\begin{document}$$\Delta_{broiler , t_1 - t_2}$$ \end{document}
The estimated median number of broiler-related illnesses exceeded 390,000 in 1995 (Fig. 2a), though the 5th and 95th percentiles of the prediction intervals range from 80,000 to about 1,000,000 illnesses. In contrast, the estimated median numbers of broiler-related illnesses substantially drops and is quite similar when comparing the 2000 and 2007 predictions (Fig. 2b, c), with the medians being roughly 200,000 and 210,000, respectively.
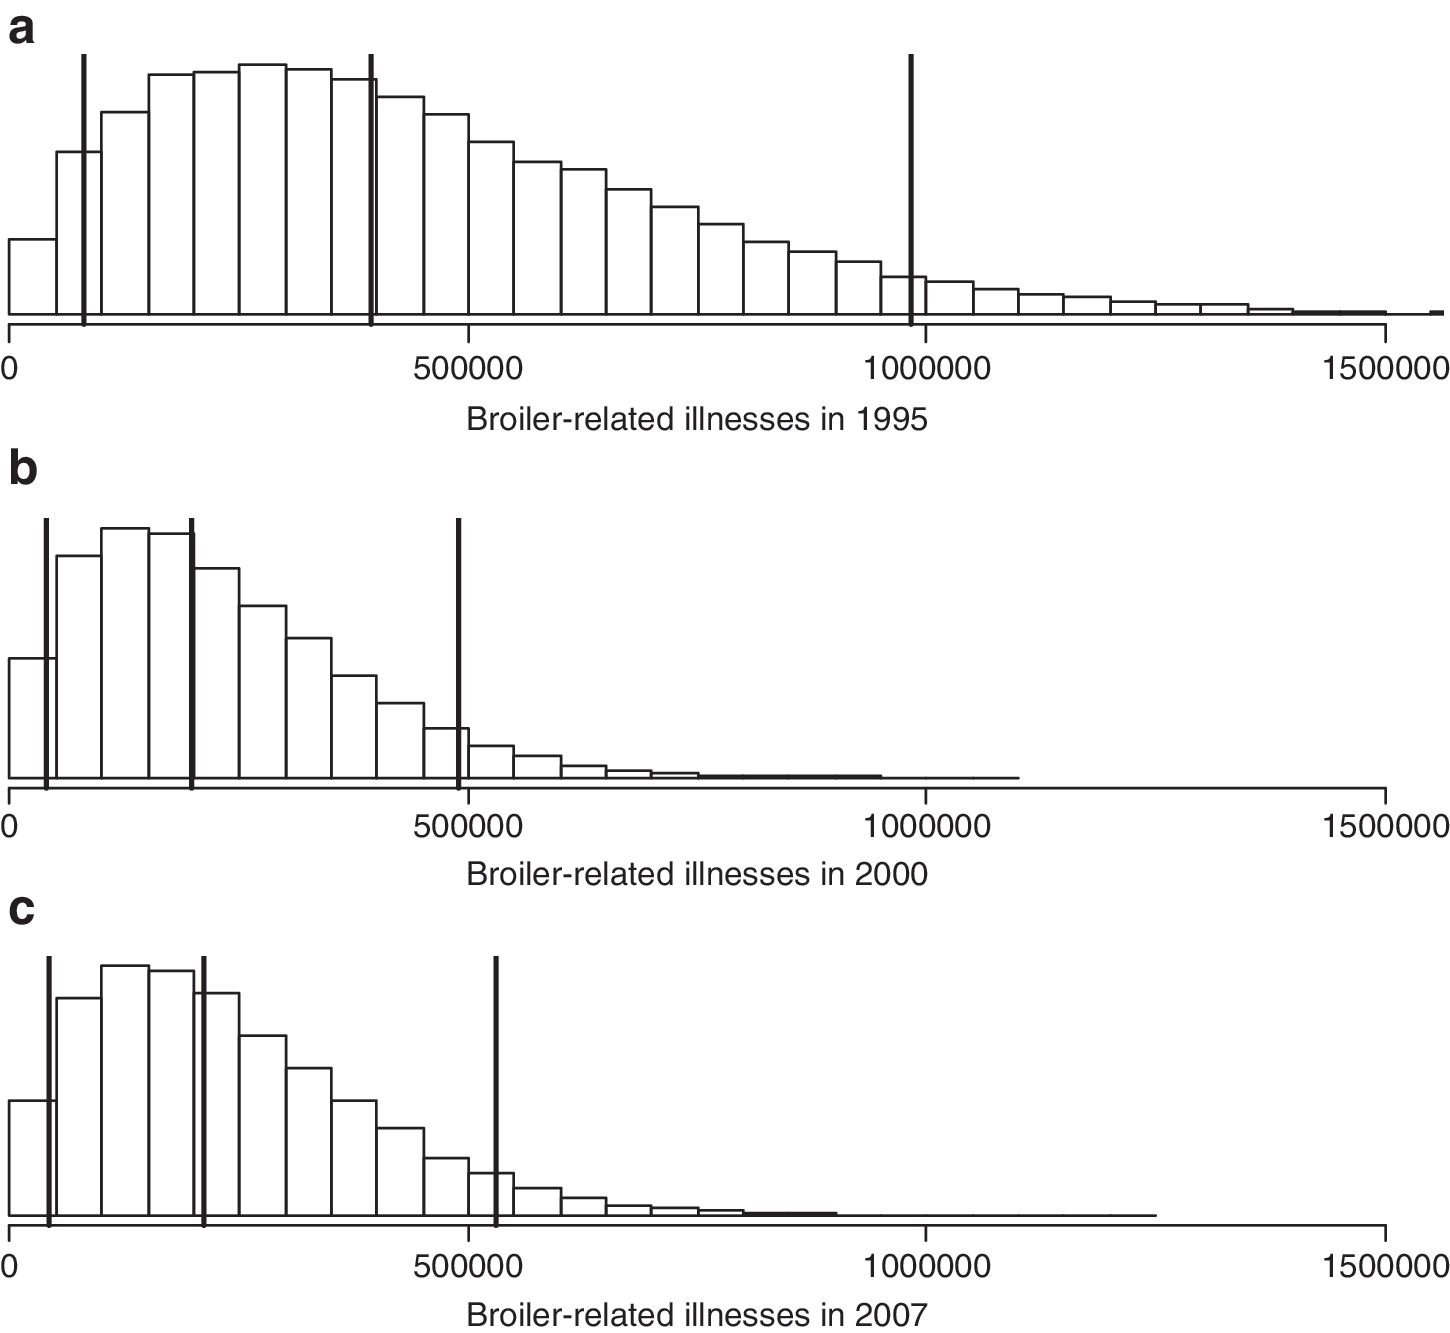
Broiler-related salmonellosis cases in 1995, 2000, and 2007. Vertical lines represent the 5th, 50th, and 95th percentiles of the distributions. Histograms
The estimated median reduction in the numbers of broiler-related illnesses between 1995 and 2000 is approximately 190,000, with 5th and 95th percentiles of 37,000 to about 500,000 (Fig. 3a). In contrast, the estimated median change in the numbers of broiler-related illnesses between 2000 and 2007 is an increase of 9000 (Fig. 3b), with the prediction interval ranging from minus 75,000 (i.e., an increase in cases) to slightly more than 25,000.
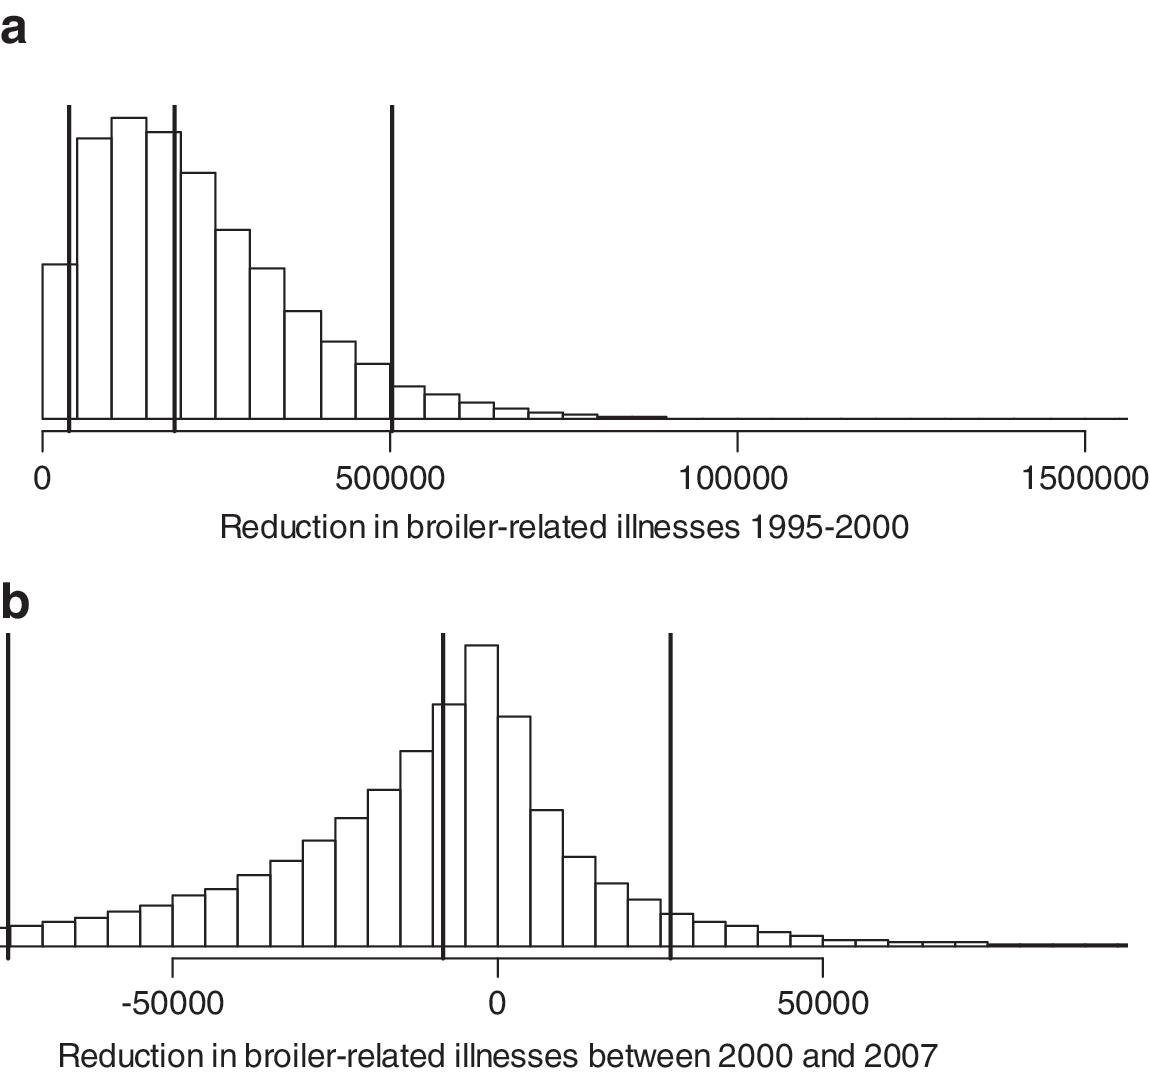
Distributions describing the uncertainty in the reductions in the numbers of broiler-related illnesses between 1995–2000 and 2000–2007. A substantial reduction was predicted for the first time period
While the number of estimated broiler-related illnesses prevented is substantial, it is important to keep in mind that these changes are more modest in the context of all cases of salmonellosis. The model estimates that the rate of domestically acquired, foodborne illnesses from Salmonella decreased by roughly 19% between 1995 (the year before the PR/HACCP rule was enacted) and 2000 (Fig. 4a). Nevertheless, this estimate is highly uncertain with the 5th and 95th percentiles being 4% and 36%, respectively. A modest reduction between 2000 and 2007 of 0.5% was estimated (Fig. 4b), with the prediction interval ranging from a 5% decrease to a 5% increase in illness rate.
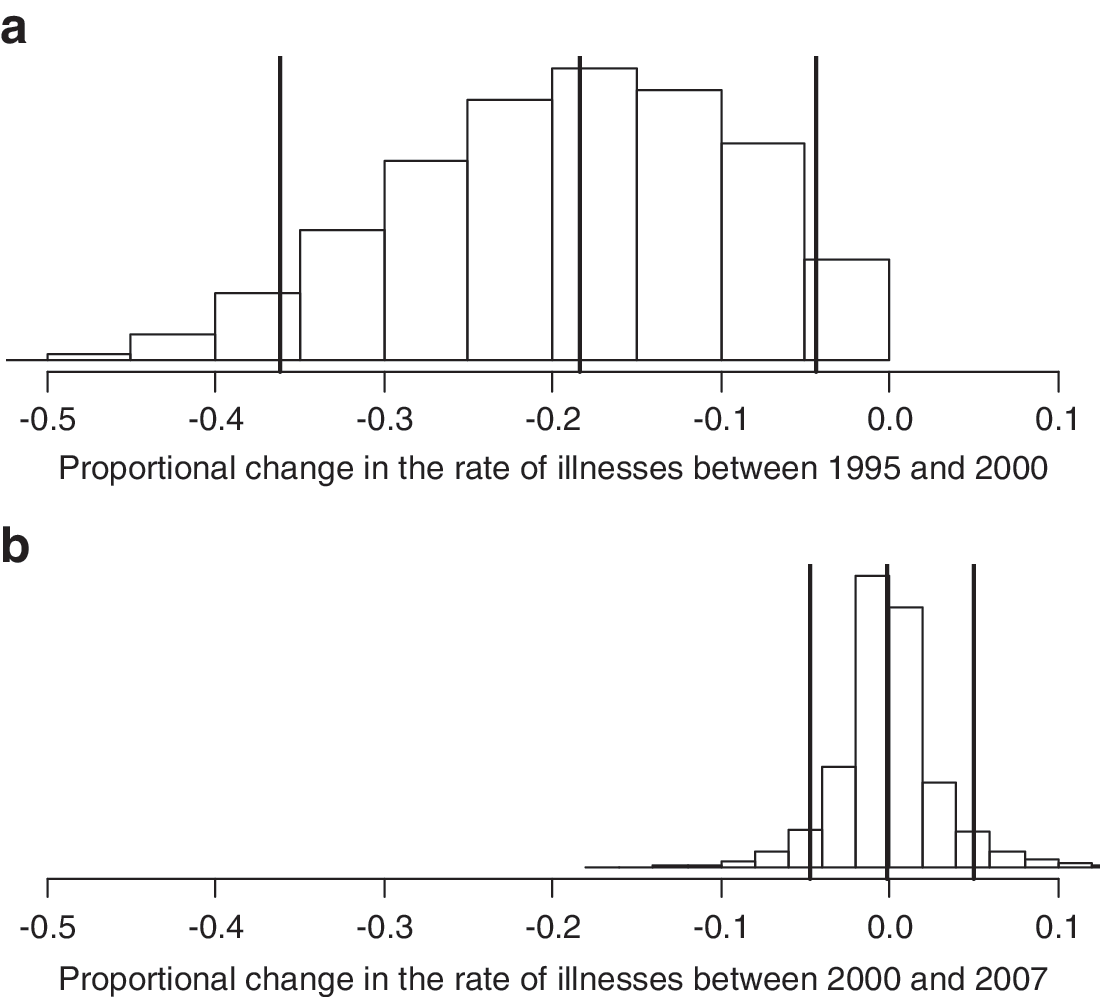
Uncertainty distributions for the change in the illness rates between 1995, 2000 and 2007. A significant reduction of approximately 19% was predicted for the earlier period, whereas the change in the rate of illnesses was not significant in the latter period. Vertical lines represent the 5th, 50th, and 95th percentiles of the distributions. Histograms
Estimating
\documentclass{aastex}\usepackage{amsbsy}\usepackage{amsfonts}\usepackage{amssymb}\usepackage{bm}\usepackage{mathrsfs}\usepackage{pifont}\usepackage{stmaryrd}\usepackage{textcomp}\usepackage{portland, xspace}\usepackage{amsmath, amsxtra}\pagestyle{empty}\DeclareMathSizes{10}{9}{7}{6}\begin{document}$$\Delta_{observed , broiler , t_1 - t_2}$$ \end{document}
Another objective of this study is to understand how observed illnesses detected by the public health surveillance system change in response to changes in the frequency of contaminated carcasses. Figure 5 demonstrates the estimated change in the contribution of broilers to total observed cases. The estimated distribution for 1995 assumes the FoodNet catchment area in 1995 would have been the same as the catchment in 2000. The model predicts that the median annual reduction in observed broiler-related salmonellosis cases would have been approximately 660, with 5th and 95th percentiles of 125 and 1800 (Fig. 5a). Figure 5b illustrates the uncertainty in the change of observed broiler-related illnesses between 2000 and 2007. The model predicts an average reduction of roughly 100 illnesses per year with prediction interval bounds of −70 to 450. The possibility of an increase in broiler-related illnesses occurs despite a decrease in the rate of exposure; this effect is offset by increases in the population size and number of servings.
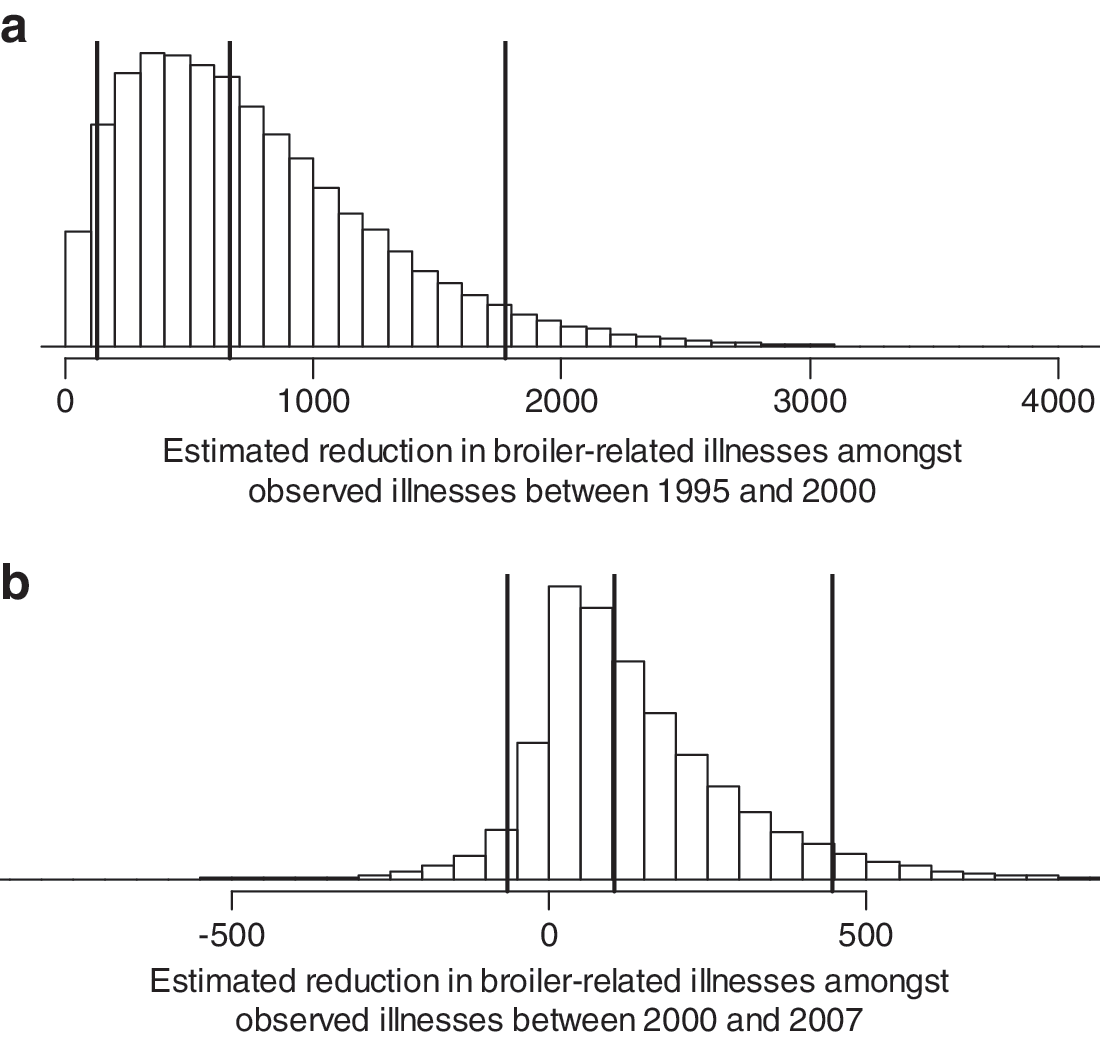
Distributions describing the estimated reduction in the predicted number salmonellosis cases that would have been reported to FoodNet and were attributed to the consumption of broilers. Note that a negative reduction constitutes an increase in observed illnesses. Vertical lines represent the 5th, 50th, and 95th percentiles of the distributions. Histograms
Discussion
Frequency of contaminated carcasses arguably changes in response to food safety policies and the primary objective of this study is to estimate the number of salmonellosis cases prevented by the observed changes in frequency of contaminated carcasses across the 3 survey years. This model predicts that a substantial number of broiler-related salmonellosis cases were prevented in the United States between 1995 and 2000. The implementation of PR/HACCP by FSIS is a putative explanation for the reduction in broiler carcass prevalence observed in the 1995 and 2000 FSIS baseline surveys and the estimated reduction in human cases of salmonellosis. Nevertheless, this model's estimates only refer to those 2 years. Because the interval is 5 years, the estimated change is not necessarily applicable to each year, nor is it necessarily an average effect.
This model predicts few if any reductions in broiler-related illnesses between 2000 and 2007, which agrees with CDC analyses that indicate the incidence of salmonellosis has not significantly changed since 2000 (CDC, 2011), despite modest reductions in the frequency of contaminated carcasses observed in the FSIS baseline surveys. During this time period, FSIS developed stricter Salmonella performance standards (FSIS, 2003) that seemingly motivated better sanitation within many broiler slaughter establishments, though there is some evidence of a rise and subsequent reduction in prevalence between 2000 and 2007 (FSIS, 2010).
The CDC provides estimates that support the results of the study. This agency provides two estimates of the reduction in salmonellosis cases, the different estimates representing changes in the surveillance system and comparisons of illness rates across multiple years. Their official longitudinal estimator shows that in 2007 Salmonella incidence was 8% lower than the baseline estimate, with 95% confidence intervals ranging from 2% to 15% (CDC, 2009). This estimate combines the 1996–1998 illness counts to establish the baseline, so it potentially underestimates the reduction. The second set of estimates does not combine surveillance data across years to create the baseline incidence or include the increase in the population under surveillance that occurred between 1996 and 2000. For these estimates, CDC examined the yearly incidence for the original five surveillance sites. The incidence of salmonellosis declined at each site used in the original 1996 study (CDC, 2002), with an estimated reduction in the incidence of salmonellosis of 25% between 1996 and 2000. No confidence intervals were provided with these estimates. While some of the reported reduction in salmonellosis cases was attributed to eggs (CDC, 2002; Marcus et al., 2004), estimates of the change in contamination for this product are not available. It should be noted that a 26% reduction in campylobacteriosis cases was also observed during this period (Samuel et al., 2004) and consumption of chicken has been identified as a risk factor for campylobacteriosis (Friedman et al., 2004), whereas egg consumption is generally not a risk factor.
Directly comparing the model estimates with CDC estimates, however, requires the assumption that risk factors (other than chicken) are invariant across time. This assumption implies that strain type, pathogenicity, and size of the total reservoir of Salmonella are invariant. This assumption likely overestimates the burden of salmonellosis attributed to chicken and is tenuous because reductions in other meat products were observed after PR/HACCP implementation. For example, the prevalence of contaminated carcasses appeared to decrease in the beef and pork industries (e.g., FSIS, 1996b, 1999), but the results of these studies are not easily compared because differences in animal class (e.g., market hogs vs. all swine) and sampling method (tissue vs. sponge sampling) confuse a direct interpretation of the results. Nevertheless, we feel that assigning the reductions in illnesses to broilers is reasonable because this product class is thought to account for a clear majority of food-animal related illnesses in the United States (Guo et al., 2011) and a meta analysis assessing the effect of HACCP systems does not support a significant reduction in Salmonella in any commodity other than chicken (Wilhelm et al., 2011). Further, data from baseline surveys that are similar in design to the FSIS surveys are not available for other commodities, such as fruits, vegetables, milk, and eggs. Therefore, we cannot rule out the influence of changing risks from these commodities on total salmonellosis cases.
The approach used in this model assumes that contamination levels on broiler carcasses are independent of the frequency of contaminated carcasses. The available evidence does not reject this assumption. For test-positive samples, the average concentration of Salmonella per mL of rinsate was 0.16 and 0.14 CFU in the 1995 and 2007 baseline surveys, respectively (FSIS, 1996a, 2011a).However, the prevalence of positive carcasses was demonstrably different in those surveys.
For the purposes of monitoring the effectiveness of a food safety program, we can ask - how likely is it that we would observe changes in reported FoodNet cases as a result of changes in the occurrence of Salmonella on broiler carcasses? This is a question that addresses the power of the current surveillance system to detect differences across time.
Our results suggest that–had FoodNet been operational in 1995–the estimated changes in broiler-associated salmonellosis cases would be manifested in total reported FoodNet illnesses by 2000. Our results also suggest that the estimated changes in broiler-associated salmonellosis cases would not be detectable between 2000 and 2007. In this case, the modeled change in the frequency of contaminated broiler carcasses was insufficient for detection by FoodNet.
This study's results highlight a conundrum for food safety programs. As these programs become more effective, the power of public health surveillance systems to detect and report on these changes becomes smaller.
Solving the limited power of public health surveillance would require a substantially increased investment in that system to increase the number of illnesses observed (e.g., increase the catchment area, reduce the underreporting fraction) and/or improve the data and methods to estimate attributable fraction [e.g., intensive ongoing case-control studies, improved modeling methods (Hald et al., 2004; Guo et al., 2011)]. In lieu of such improvements, however, food safety regulatory officials can rely on models such as this one to monitor the effect of reduced contamination on products they regulate. FSIS monitors prevalence of contaminated products via its PR/HACCP performance standards. The changes observed in monitoring programs suggest the effectiveness of FSIS efforts in reducing the risk of foodborne illness. Although the magnitude of these changes may be large enough to expect a noticeable decline in observed illnesses via FoodNet, it is important to note that the inability to observe less substantive changes is neither evidence of failure to improve food safety nor indicative of problems with public health surveillance.
Footnotes
Disclosure Statement
No competing financial interests exist.