




Abstract
Listeria monocytogenes is a foodborne pathogen that can persist in food processing environments. Six persistent and six non-persistent strains from fish processing plants and one persistent strain from a meat plant were selected to determine if expression of genes in the regulons of two stress response regulators, σB and CtsR, under salt stress conditions is associated with the ability of L. monocytogenes to persist in food processing environments. Subtype data were also used to categorize the strains into genetic lineages I or II. Quantitative reverse transcriptase–polymerase chain reaction (qRT-PCR) was used to measure transcript levels for two σB-regulated genes, inlA and gadD3, and two CtsR-regulated genes, lmo1138 and clpB, before and after (t=10 min) salt shock (i.e., exposure of exponential phase cells to BHI+6% NaCl for 10 min at 37°C). Exposure to salt stress induced higher transcript levels relative to levels under non-stress conditions for all four stress and virulence genes across all wildtype strains tested. Analysis of variance (ANOVA) of induction data revealed that transcript levels for one gene (clpB) were induced at significantly higher levels in non-persistent strains compared to persistent strains (p=0.020; two-way ANOVA). Significantly higher transcript levels of gadD3 (p=0.024; two-way ANOVA) and clpB (p=0.053; two-way ANOVA) were observed after salt shock in lineage I strains compared to lineage II strains. No clear association between stress gene transcript levels and persistence was detected. Our data are consistent with an emerging model that proposes that establishment of L. monocytogenes persistence in a specific environment occurs as a random, stochastic event, rather than as a consequence of specific bacterial strain characteristics.
Introduction
The goal of this study was to test the hypothesis that persistent and transient L. monocytogenes differ in baseline expression and induction of the σB and CtsR regulons; activity of σB and CtsR was measured by using quantitative reverse transcriptase–polymerase chain reaction (qRT-PCR) to measure transcript levels of (i) inlA and gadD3, which are directly regulated by σB (transcript levels of these genes serve as indirect measures of σB activity); and (ii) lmo1138 and clpB, which are directly regulated by CtsR (transcript levels of these genes serve as indirect measures of CtsR activity). We hypothesized that persistent strains obtained from food processing environments would demonstrate higher induction of σB- and CtsR-regulated genes after exposure to salt shock compared to non-persistent strains. The target genes (Table 1) used for qRT-PCR were chosen not because we hypothesized that they are directly responsible for persistence, but were chosen as reporters for the activity of these two key transcriptional regulators to provide insight into differences in expression of their regulons based on classification of strains by persistence or lineage. The use of reporter genes (e.g., lacZ promoter or gene fusion constructs) to study the activity of transcriptional regulators is a well-established practice (Boylan et al., 1993). Our study uses qRT-PCR as an appropriate technology to assess transcript levels of key reporter genes known to be directly regulated by σB or CtsR.
qRT-PCR, quantitative reverse transcriptase–polymerase chain reaction.
Materials and Methods
Bacterial strains and growth conditions
Isolates (six persistent and six non-persistent; Table 2) were selected from a 24-month longitudinal study of L. monocytogenes contamination patterns in four smoked fish plants (Lappi et al., 2004). An isolate was considered to represent a persistent strain if multiple isolates belonging to the same ribotype were recovered in the same plant ≥5 times and over a period of >3 months (Lundén et al., 2008). Conversely, isolates representing a ribotype found only once in a plant during the course of the study were deemed representative of non-persistent strains. An additional persistent L. monocytogenes strain (FSL F6-154; previously J2818), which persisted in a food processing plant for >10 years (Orsi et al., 2008), was also included. All isolates were classified to lineage based on ribotyping data (Nadon et al., 2001). L. monocytogenes 10403S and selected isogenic mutant strains (Hu et al., 2007) were included as reference strains because strain 10403S has been used in a number of previous studies of L. monocytogenes stress response systems. Bacteria were grown from frozen stock cultures as previously described (Ollinger et al., 2008), except that cells were grown to mid-exponential phase (OD600=0.4) after the final 1:100 dilution into 50 mL of pre-warmed brain heart infusion (BHI).
Salt shock experiments
Salt shock experiments were performed as previously described (Sue et al., 2004), with modifications. Briefly, 4.5 mL aliquots of mid-exponential phase cells (OD600=0.4) were collected from 50 mL cultures, and 10% phenol in ethanol was added to a final concentration of 1% phenol to stop transcription (Bhagwat et al., 2003). To another 4.5 mL aliquot of the same culture, 4.5 mL of pre-warmed 12% NaCl (w/v)+BHI was added, and the culture was incubated for an additional 10 min at 37°C with shaking, followed by addition of the phenol solution as described above. Phenol-treated samples were placed on ice and centrifuged within 5 min at 1,800×g for 10 min at 4°C. Pellets were kept on ice until RNA extraction, which immediately followed cell collection.
Total RNA isolation
Cell pellets were resuspended in 1 mL TRI Reagent (Applied Biosystems, Foster City, CA), and manufacturer's instructions were followed to obtain purified total RNA after mechanical lysis with acid-washed 0.1 mm zirconium beads (Biospec, Bartlesville, OK) in a beadbeater (Mini-beadbeater-8; Biospec) for 4 min. RNA concentration and integrity were assessed as described elsewhere (Bergholz et al., 2010).
TaqMan qRT-PCR
cDNA was synthesized from total RNA (RIN value ≥ 7.0) treated with DNAse, following manufacturer's instructions (TURBO DNA-free; Applied Biosystems), in a reaction mixture (100 μL) of TaqMan RT-PCR reagents with 500 ng total RNA. qPCR reactions were performed as previously described (Bergholz et al., 2010).
Transcript levels of four target genes (gadD3 [lmo2434], inlA, lmo1138, and clpB) and one housekeeping gene (rpoB) were quantified, using the ABI Prism 7000 Sequence Detection System (Applied Biosystems), to indirectly measure the activity of the transcriptional regulators σB and CtsR. TaqMan primers and probes (Table 3) were designed with Primer Express v1.0 software (Applied Biosystems) using target genes sequences obtained for all isolates used here (for primers, see Table 4). Separate clpB primer and probe sets were designed for lineage I and II strains due to high sequence divergence between lineages.
qRT-PCR, quantitative reverse transcriptase–polymerase chain reaction.
Transcript levels of the four target genes were normalized to the housekeeping gene rpoB. Induction, defined as fold change in transcript levels after salt shock (t=10 min) relative to levels before salt shock (t=0), was calculated, using the Pfaffl method (Pfaffl, 2001), for each biological replicate for each isolate. Efficiency values of primer and probe reactions were calculated for each isolate by including duplicate 10-fold dilutions of cDNA (10−1 to 10−4) for each gene in reactions, and efficiency values were used in subsequent calculations. These values were 91–100%, with an average of 98±8%.
To compare mRNA transcript levels among isolates at both time points [i.e., before (t=0) and after salt-shock (t=10 min)], the ΔΔ-Ct method (Livak and Schmittgen, 2001) was used to calculate transcript levels relative to a calibrator sample, which was total RNA collected from L. monocytogenes 10403S during one biological replicate of salt shock. Ct values obtained from this sample of 10403S cells collected at t=0 were used to calculate fold changes relative to expression levels of 10403S, using rpoB as an internal control. Thus, this relative quantification method represents transcript levels in arbitrary units of “fold change, relative to 10403S at t=0.”
Statistical analysis
Induction and transcript levels relative to 10403S were analyzed using two-way analysis of variance (ANOVA) with JMP (JMP 9.0; SAS, Inc., Cary, NC). Data from two biological replicates of salt stress experiments for the 13 strains investigated were coded by persistence (N [Non-persistent] vs. P [Persistent]) or lineage (I vs. II) for each gene. The following formula was used to determine effects of lineage and persistence and an interaction effect:
Two biological replicates per strain were considered sufficient, because we did not perform statistical analyses to compare transcript levels for individual strains. Two-way ANOVA was performed on induction data and relative transcript level data separately. Data for transcript levels relative to 10403S were log transformed to fulfill ANOVA assumptions of normality.
Results
Comparison of relative transcript levels of σB- and CtsR-regulated genes by persistence and lineage classifications of L. monocytogenes strains from food processing plants
Before salt shock, mean relative transcript levels, in exponential growth phase cells, of σB-regulated genes gadD3 and inlA (in fold changes relative to 10403S at t=0) were 1.3–46.3 and 1.1–12.4, respectively, compared to 1.3 and 1.0 for 10403S (Fig. 1). Mean relative transcript levels of CtsR-regulated genes lmo1138 and clpB were 2.5–7.4 and 2.7–20.4, respectively, compared to 1.6 and 1.4 for 10403S. Statistical analysis of relative transcript levels before salt shock (t=0) revealed no significant differences in transcript levels between persistent and non-persistent isolates for any of the four genes (p>0.05; two-way ANOVA) (Fig. 2). However, significantly higher clpB transcript levels were observed in lineage I strains before salt stress (p=0.004; two-way ANOVA). A significant interaction of persistence and lineage for relative transcript levels of inlA (p=0.028; two-way ANOVA) before salt shock was also detected, but a contrast of the means showed no significant separation of the lineage/persistence pairings (p>0.05; post-hoc Tukey HSD).

Transcript levels (relative to transcript levels of 10403S at t=0) of σB-regulated genes gadD3 (
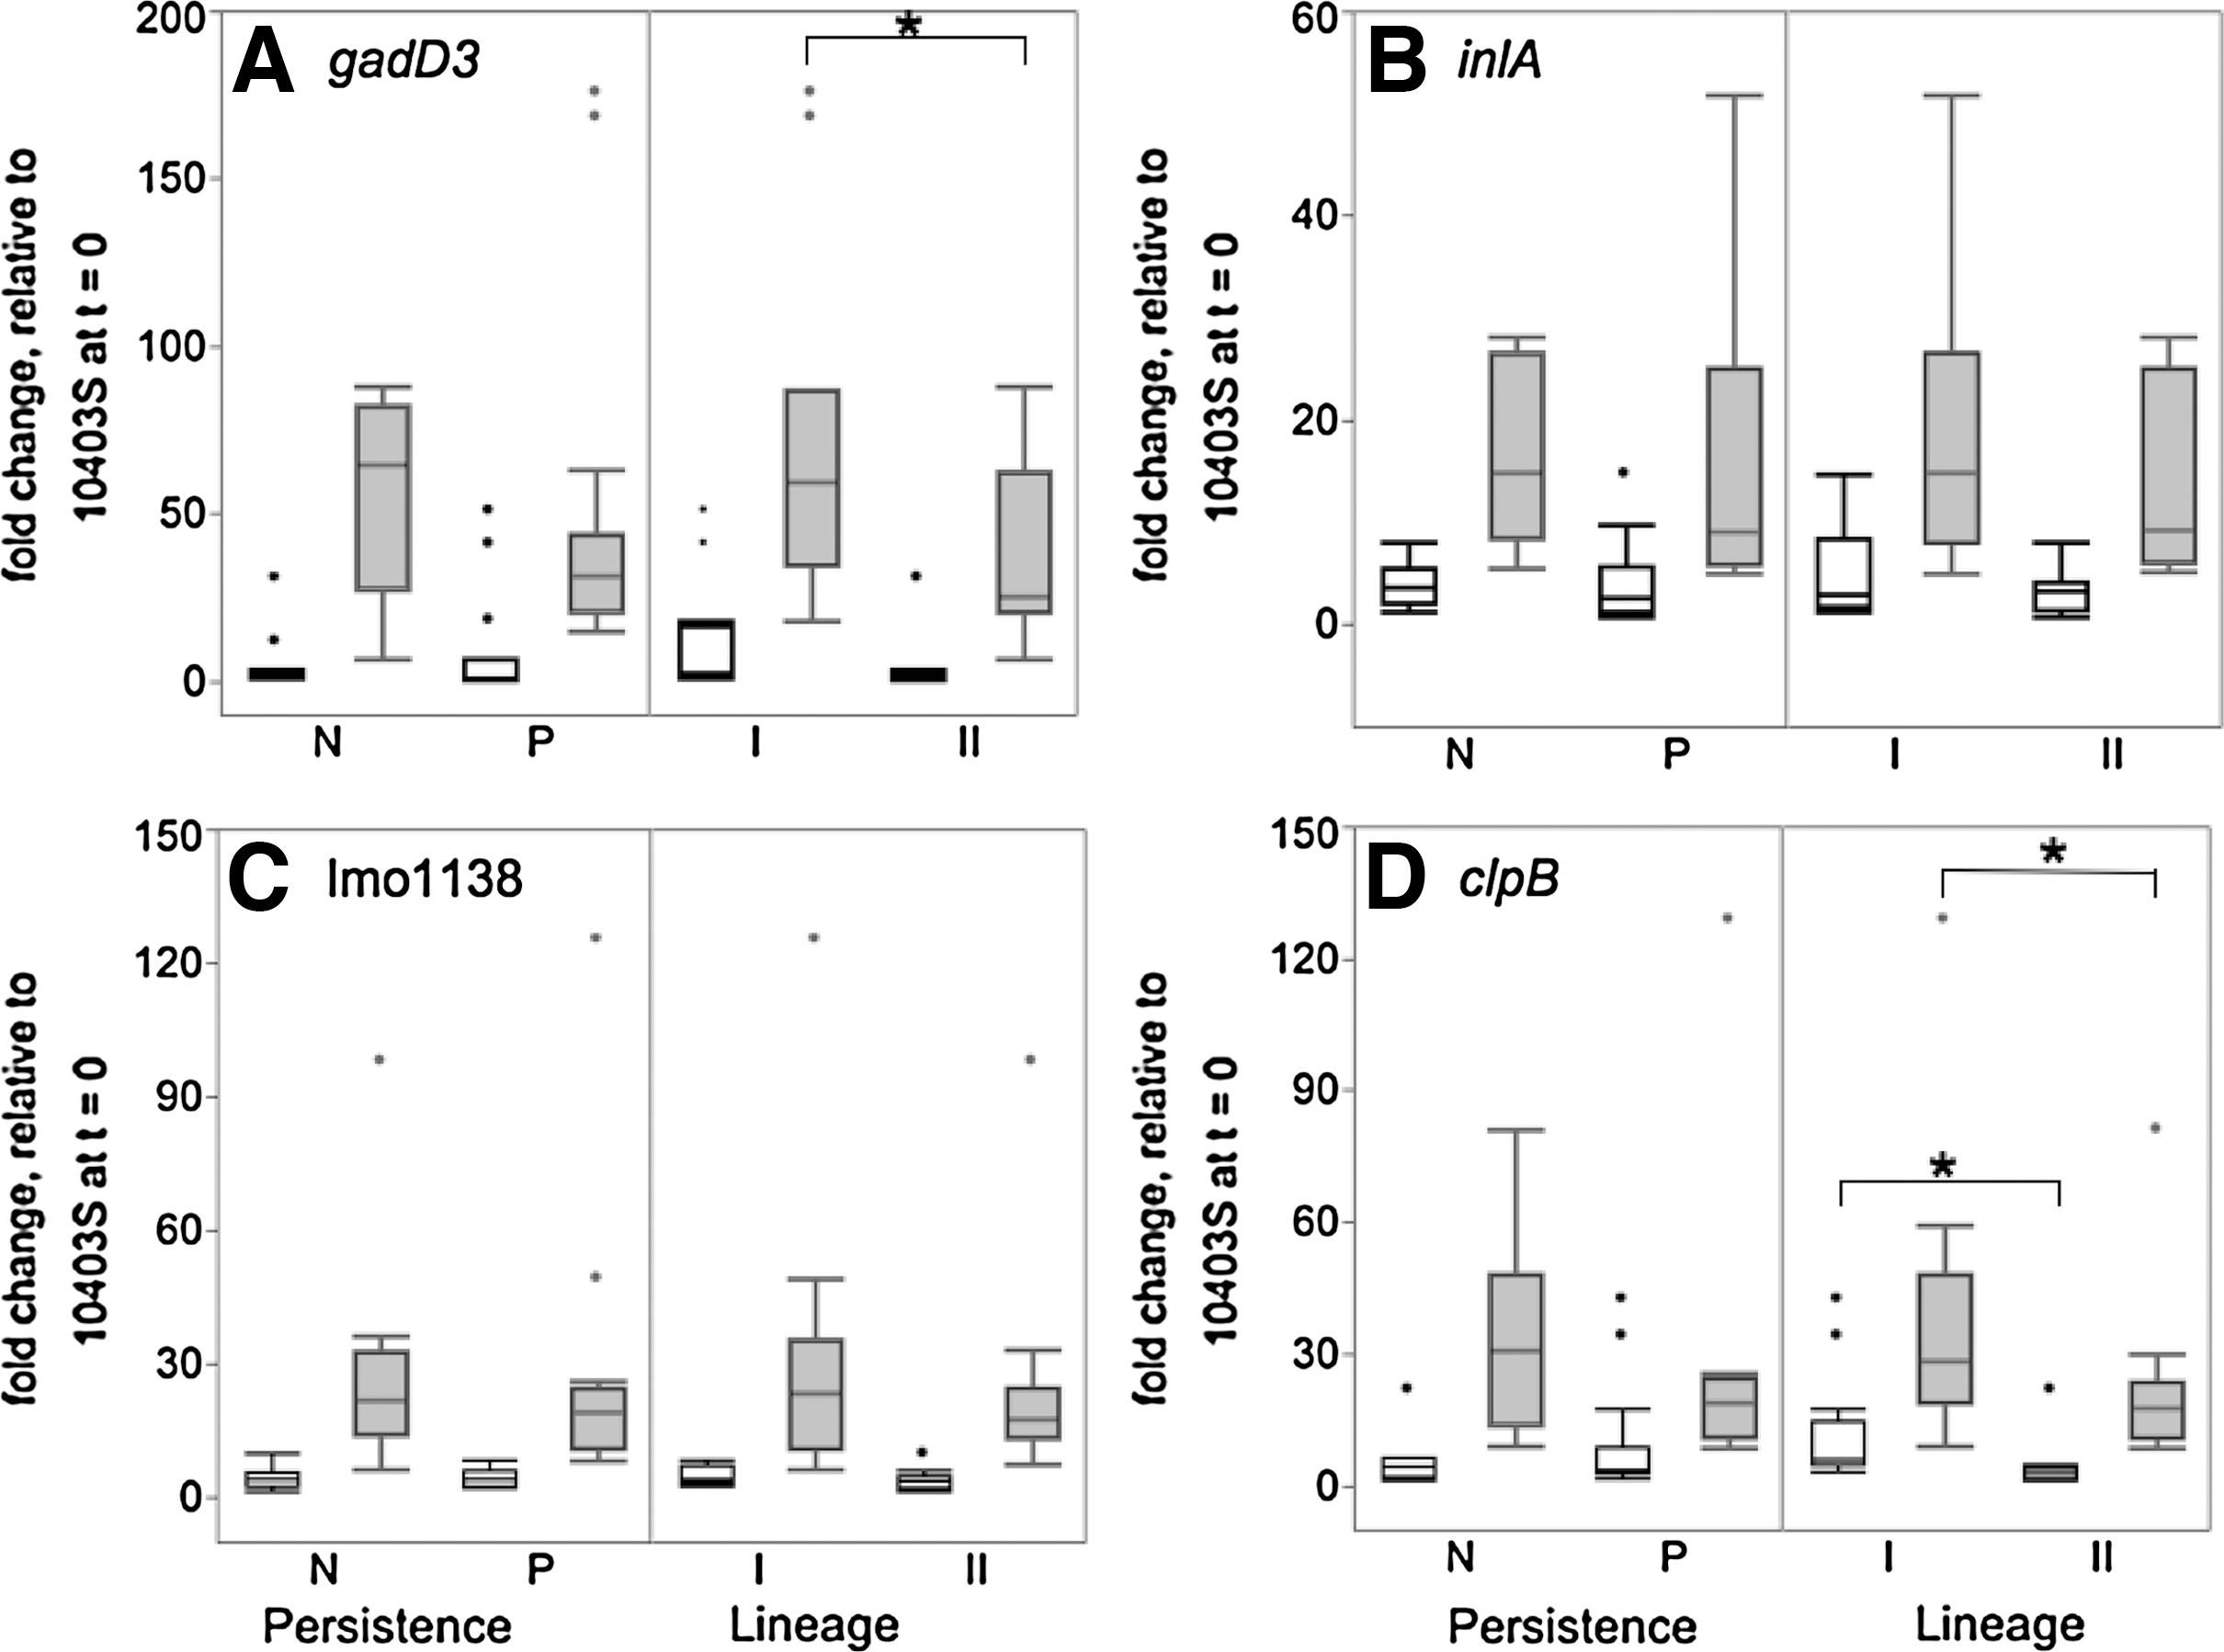
Box plots of transcript levels, relative to transcript levels for 10403S at t=0, of σB-regulated genes gadD3 (
Relative transcript levels of σB-regulated genes gadD3 and inlA after salt shock were 17.6–172.5 and 6.7–42.5, respectively (for the 13 strains from food processing plants), compared to 12.3 and 4.6 for 10403S. Relative transcript levels of CtsR-regulated genes lmo1138 and clpB were 11.7–87.6 and 10.3–77.6, respectively, compared to 5.8 and 5.3 for 10403S. These ranges indicate considerable variation of transcript levels in response to salt shock for the strains from food processing plants. Analysis of relative transcript levels after salt shock (t=10 min) indicated higher relative transcript levels of gadD3 (p=0.024; two-way ANOVA) for lineage I strains. Borderline significantly higher relative transcript levels of clpB (p=0.053; two-way ANOVA) were also observed in lineage I strains. Sequencing and analysis revealed no polymorphisms in the putative CtsR binding site upstream of clpB.
Comparison of salt shock induction of σB- and CtsR-regulated genes by persistence and lineage classification of L. monocytogenes strains
Individual induction fold changes of gadD3, inlA, lmo1138, and clpB (Fig. 3) in all strains from food processing plants were >1.0, indicating that the salt stress presented by our experimental conditions induced transcription of these genes. For σB-regulated genes, mean fold changes were 3.7–44.6 for gadD3 and 1.7–16.6 for inlA. Induction, after salt shock, of gadD3 and inlA in 10403S (9.8 and 4.4 fold change, respectively), but not in 10403SΔsigB (0.5 and 1.0 fold change, respectively), confirmed σB-regulated transcription of gadD3 and inlA in response to salt stress. A two-way ANOVA found no significant effects of persistence or lineage on induction of either gadD3 or inlA after salt shock (p>0.05, two-way ANOVA; Fig. 4).

Induction of σB-regulated genes gadD3 (

Box plots of induction of σB-regulated genes gadD3 (
For CtsR-regulated genes, a two-way ANOVA found that induction of clpB after salt shock was significantly higher in non-persistent compared to persistent strains (p=0.020, two-way ANOVA; Fig. 4). No significant effects of persistence or lineage were observed on induction of lmo1138 after salt shock (p>0.05; two-way ANOVA). Transcript levels of lmo1138 and clpB did not increase after salt shock in the ΔctsR strain (fold change of 1.0 and 1.1, respectively) but increased in 10403S (4.5 and 3.9 fold change, respectively). Combined with the higher absolute transcript levels in the ΔctsR strain (as compared to the parent strain 10403S; Fig. 1), these data support that CtsR represses transcription of these genes in the absence of stress conditions (Hu et al., 2007; Nair et al., 2000) with complete derepression of lmo1138 and clpB before and after salt shock in the ΔctsR strain. Induction of lmo1138 and clpB after salt shock in 10403SΔsigB, with fold changes of 4.5 and 2.6, suggests that upregulation of these genes in response to salt shock is σB-independent.
Discussion
Characterization of exponential phase transcript levels and salt induction of four stress response genes among 13 different L. monocytogenes isolates, representing strains that persisted in food processing plants and strains with no evidence of persistence, was performed to evaluate stress response gene expression patterns as well as CtsR and σB activity in these strains. Overall, our data indicate that (i) the σB-dependent genes gadD3 and inlA and the CtsR-dependent genes lmo1138 and clpB are induced, across strains and lineages, after salt stress exposure; (ii) lineage I strains show higher transcript levels, as compared to lineage II strains, for some stress response genes (e.g., gadD3 and clpB, after salt stress exposure); and (iii) L. monocytogenes isolates representing persistent and non-persistent strain do not differ in transcript levels or induction of the stress responsive genes gadD3, inlA, and lmo1138.
σB-Dependent genes gadD3 and inlA and the CtsR-dependent genes lmo1138 and clpB are induced, across strains and lineages, after salt stress exposure
The salt stress conditions used in this study consistently led to an increase in transcript levels of σB- and CtsR-regulated genes in a broad range of L. monocytogenes strains comprised of 12 ribotypes and two lineages. All four genes studied here showed higher relative transcript levels after salt shock in strains from food processing plants compared to the potentially laboratory-adapted strain 10403S. Induction of the σB-regulated genes inlA and gadD3 across various salt concentrations (Hu et al., 2007; Olesen et al., 2009; Sue et al., 2004) shows that induction of σB-regulated genes occurs over a large range of osmolarity, which may induce cross-protection of L. monocytogenes cells from additional stresses such as sanitizer treatment, low temperatures, or bile stress by “priming” cells with active σB (Begley et al., 2002; Wemekamp-Kamphuis et al., 2004). In addition to induction of σB regulon members, we observed induction of CtsR-regulated genes in response to salt stress in all wildtype strains tested. Our finding that CtsR-regulated genes are induced by salt stress suggests that other stresses besides heat (Chastanet et al., 2004; Hu et al., 2007; Nair et al., 2000) lead to derepression of the CtsR regulon and indicates that some members of the CtsR regulon may contribute to salt stress response.
Lineage I strains show higher transcript levels, as compared to lineage II strains, for some stress response genes (i.e., gadD3 and clpB)
Among several lineage-specific differences in transcript levels of genes chosen in this study, we observed higher clpB transcript levels in exponential phase cells before salt exposure in lineage I strains as compared to lineage II strains, as well as higher gadD3 and clpB transcript levels after salt exposure in lineage I strains. GadD3 (Lmo2434) is one of three glutamate decarboxylases found in L. monocytogenes (Cotter et al., 2005) that have been demonstrated to facilitate L. monocytogenes survival in low pH conditions, including gastric fluid (Cotter et al., 2001, 2005). ClpB has been shown to be necessary for virulence in a mouse model (Chastanet et al., 2004). Our data suggest either higher transcription of these genes or that these mRNA transcripts are more stable in lineage I strains. As we found no sequence differences in the CtsR binding sites of clpB (Chastanet et al., 2004; Hu et al., 2007), genetic differences elsewhere in the chromosome are likely to be responsible for altered regulation of clpB in lineage I and II strains. It is also tempting to speculate that the difference in transcript levels between lineage I and II strains may relate to the potentially higher virulence potential of lineage I strains (Chen et al., 2006; Norton et al., 2001; Wiedmann et al., 1997), which are more commonly associated with human L. monocytogenes isolates, as opposed to lineage II isolates, which are overrepresented among food isolates in many countries (Gray et al., 2004). The lineage differences in transcript levels identified here further support that that genetic relatedness may affect stress gene and virulence factor expression in L. monocytogenes, as previously observed (Bergholz et al., 2010; Moorhead and Dykes, 2003; Oliver et al., 2010).
L. monocytogenes isolates representing persistent and non-persistent strains do not differ in transcript levels or induction of the stress responsive genes gadD3, inlA, and lmo1138
Our data found no evidence for a link between persistence and transcriptional response to one environmental stress, salt, as we observed only one gene, clpB, to be induced at significantly higher levels in non-persistent strains exposed to salt stress compared to persistent strains. Conceptual models explaining L. monocytogenes persistence in food processing environments include a model (Aase et al., 2000; Earnshaw and Lawrence, 1998; Kastbjerg and Gram, 2009; Lundén et al., 2008) that certain L. monocytogenes strains or subpopulations (Kastbjerg et al., 2009) have unique phenotypic characteristics (e.g., increased biofilm formation, sanitizer resistance, resistance to heat or acidic conditions) that facilitate establishment of a persistent population. An alternative model (Ferreira et al., 2011) is that most, if not all, L. monocytogenes can establish persistence if introduced into an appropriate niche (i.e., a location where they are protected from cleaning and sanitizers) at an opportune time. Some previous studies reported unique stress resistance phenotypes for persistent strains (Aase et al., 2000; Lundén et al., 2003a, 2008), supporting the first model. Other studies, however, did not identify any differences in stress resistance between persistent and non-persistent strains (Jensen et al., 2007; Kastbjerg and Gram, 2009), consistent with our observations here that did not find evidence for increased transcript levels or enhanced induction of stress response genes in persistent strains. Our data support the model that establishment of persistence is not a reflection of specific strain characteristics. Future studies using a larger number of strains from food processing environments are needed to further support this model. Use of whole genomic transcriptomic and proteomics approaches can also lead to insights on transcriptional differences, other than σB and CtsR regulation, that may exist between persistent and non-persistent strains.
Footnotes
Acknowledgments
This work was supported by the USDA National Research Initiative (grant 2005-35201-15330 to K.J.B.). D.R. was supported by the USDA National Needs Graduate Fellowship (competitive grant 2007-38420-17751 from the National Institute of Food and Agriculture).
Disclosure Statement
No competing financial interests exist.