
Abstract
The temperature of packaged lettuce was recorded throughout a retail supply chain in Canada during the various stages of storage and shipping from the processor to retail. Temperatures were monitored in 27 cases of lettuce destined for three stores in three replicate trials conducted during the winter. A dynamic model that predicts the effect of temperature on the growth or die-off of Escherichia coli O157:H7 in packaged fresh-cut lettuce was applied to simulate the behavior of E. coli O157:H7 in the system. Simulations were carried out using distributions to account for variation in the temperature parameter and the die-off coefficient of the dynamic growth/death model. The results indicate that there was a predicted overall mean decline in cell numbers of 0.983 log cfu g−1 and that the extent of cell death was proportional to the total time spent in the cold chain. Slight growth was predicted in a few instances when the dynamic temperature was above the permissive temperature of 5°C. These results suggest that generally there would be little or no growth of E. coli O157:H7 in product maintained at the proper temperature in the chain. Moreover, the predicted decline in cell numbers at refrigeration temperatures suggests that storage at 5°C or below prior to consumption would reduce populations of the pathogen in fresh-cut lettuce.
Introduction
Produce temperatures are known to fluctuate in distribution systems, and individual steps (storage, transportation, and retail display) may be highly variable in duration. There have been few attempts to establish time/temperature profiles in fresh produce along the entire chain. Most studies to date report averages for individual steps (Hébert et al., 2003; Dallaire et al., 2006) or end-point measurements at specific stages (Nunes, 2008). Realistic and repeated temperature profiles in commercial distribution systems will therefore be required to improve predictions about the fate of E. coli O157:H7. Consequently, the objectives of this study were to (1) measure time-temperature profiles for fresh-cut lettuce in a typical commercial distribution system; and (2) apply a dynamic mathematical model to predict the behavior of E. coli O157:H7 along the system.
Methods
Collection of time-temperature data
Nine cases of ready-to-eat baby leaf lettuce containing six 454-g clam shells were followed from processing to retail in three separate trials carried out in February 2010. Lettuce temperatures were recorded in one instrumented clam shell per case with hypodermic thermocouple probes (model HYP1-3-1/2-T-G-60-SMP-M; Omega Engineering, Laval, QC, Canada) connected to miniature temperature recorders (Hobo U12-014; Hoskin Scientific, Montreal, QC, Canada). The thermocouples were imbedded in the stem of a lettuce leaf in the center of the shells immediately after processing, and temperatures were recorded at 5-min intervals. The cases were distributed evenly in pallets (Fig. 1) to examine the effect of position on lettuce temperature. Air temperatures surrounding the pallet were also measured with miniature recorders (Hobo U23-002; Hoskin Scientific) fastened to the exterior of instrumented clams shells in cases on the top layer of the pallet.

Position of nine instrumented cases of ready-to-eat baby leaf lettuce in a pallet (three instrumented cases per layer: types A, B, and C; three instrumented layers per pallet: bottom, middle, and top).
The retail supply chains examined in this study include five stages: processor storage, transportation to a distribution center, distribution center storage, transportation to retail, and retail storage. The pallets were dismantled at the distribution center, and three instrumented cases were added to shipments for three retail stores. Each store received a case from each layer and each position for all replicate experiments. Recordings from the instrumented cases on the top layer of the pallet were used to estimate the start and finish times at each step of the supply chain.
The instrumented pallets were handled according to standard practice at each stage along the chain: (1) storage in stacks at the processor storage facility (2°C) until shipment to the distribution center in a refrigerated transport trailer; (2) dismantlement of the stacks upon delivery at the distribution center to accommodate storage room height (instrumented cases were placed in a separate stack), storage at 1°C; (3) distribution within 48 h to three participating retail stores on three different delivery routes in refrigerated trailers; and (4) storage in retail walk-in coolers until required for stocking of the display cabinets. Storage time in the walk-in cooler varied for each replicate and each retail store. The experiment was ended when the clam shells were removed from the instrumented cases for retail display.
Model equations
Survival and growth of E. coli O157:H7 was simulated using a combined dynamic growth/death model taken from McKellar and Delaquis (2011). This approach combines a square root model for growth and a simple linear die-off coefficient for death:
where N=cell number (cfu g−1); t=time (h); b=temperature coefficient; Tmin=notional minimum growth temperature (°C); T=dynamic temperature (°C); and k=die-off coefficient. Growth and death are both in units of ln cfu g−1 h−1. A temperature of 5°C was set as the cut-off point at which the growth and death models change. Parameter values are given in Table 1. The initial cell numbers were set at 1×10³ cfu g−1 for all simulations.
Lower and upper parameter values refer to the 95% prediction limits.
SD, standard deviation.
Simulations
Simulations of E. coli O157:H7 survival and growth using temperatures recorded in individual cases were carried out using ModelMaker 4.0 (AP Benson Ltd., London;
where Nt is the number of cells at time=t. Parameter values for growth (b) were expressed as a triangle distribution (lower, mean, upper) from Table 1, with the corresponding value of Tmin calculated from equation 4 (McKellar and Delaquis, 2011)
Statistical analysis
Two-way analysis of variance (ANOVA) with Bonferroni post test was performed using GraphPad Prism version 5.04 for Windows (GraphPad Software, San Diego, CA;
Results
Lettuce temperatures recorded in cases delivered to each store are shown in Figure 2. Temperature profile lines with different hues indicate the location of the instrumented cases in the pallet (Bottom, Middle, or Top layer) and their position in the layer (Case type A, B, or C; Fig. 1). Different shades of rectangles are included in Figure 2 to show the duration of each step (width) and the mean temperature of the three cases for each step (height). Temperature profiles recorded during Trials 1–3 are shown in Figure 2a–c.
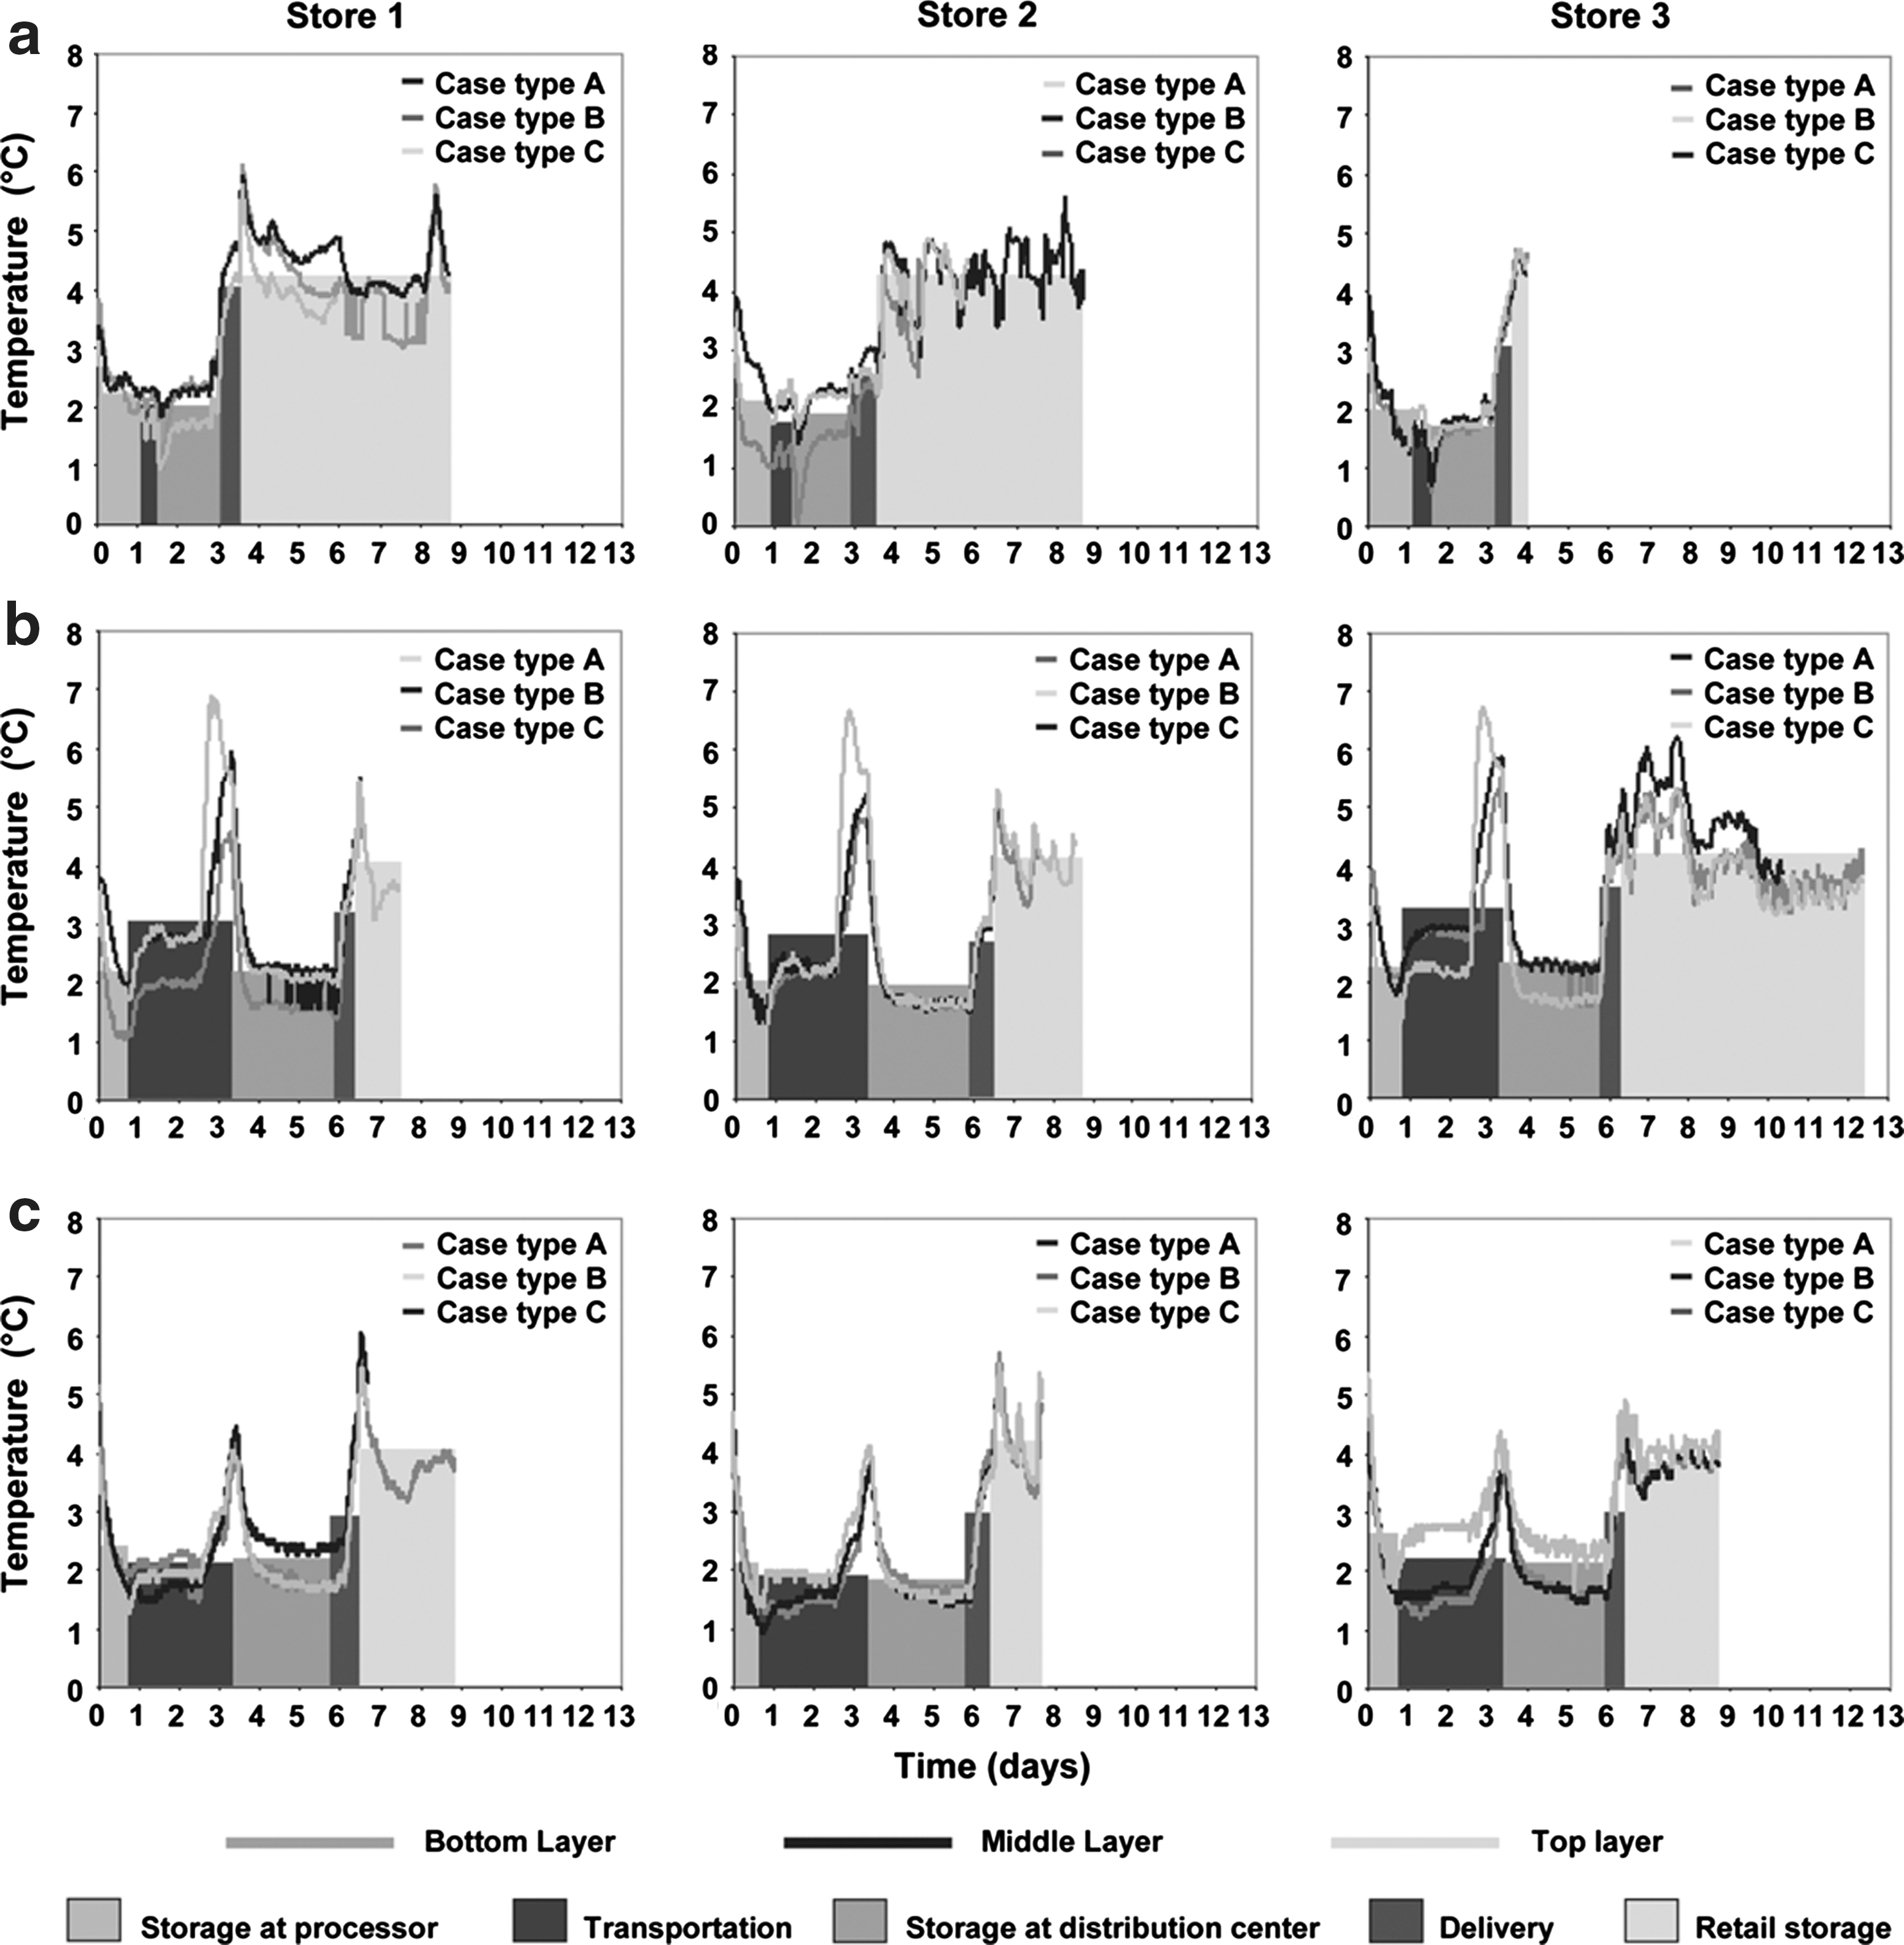
Temperature profiles from Trials 1–3
We were particularly interested in situations where growth permissive temperatures (>5°C) occur during shipping and handling, although it should be stressed that we found few such instances. Two temperature profiles generated from Trial 2 were selected for comparison. In the first (Store 1, Top layer—Case type A), there was an increase in temperature above 7°C during transportation from the processor to the distribution center and a similar increase upon arrival at retail (dotted line in Fig. 3a). A similar increase was noted in the second profile (Store 3, Middle layer—Case type A), but the increase was larger and storage duration was prolonged at retail (dotted line in Fig. 3b). Simulations for Trials 1 and 2 are shown as the solid lines in Figure 3a,b. In both examples the initial temperature increase resulted in higher cell numbers, but this was less extensive in lettuce delivered to Store 3 than Store 1. Retail storage had the largest effect on cell numbers; the increase simulated over this period was greater for Store 3 than Store 1 (Fig. 3). Interestingly, the simulation predicted a higher overall decline in cell numbers in Store 3 (0.996 and 0.838 for Stores 3 and 1, respectively).
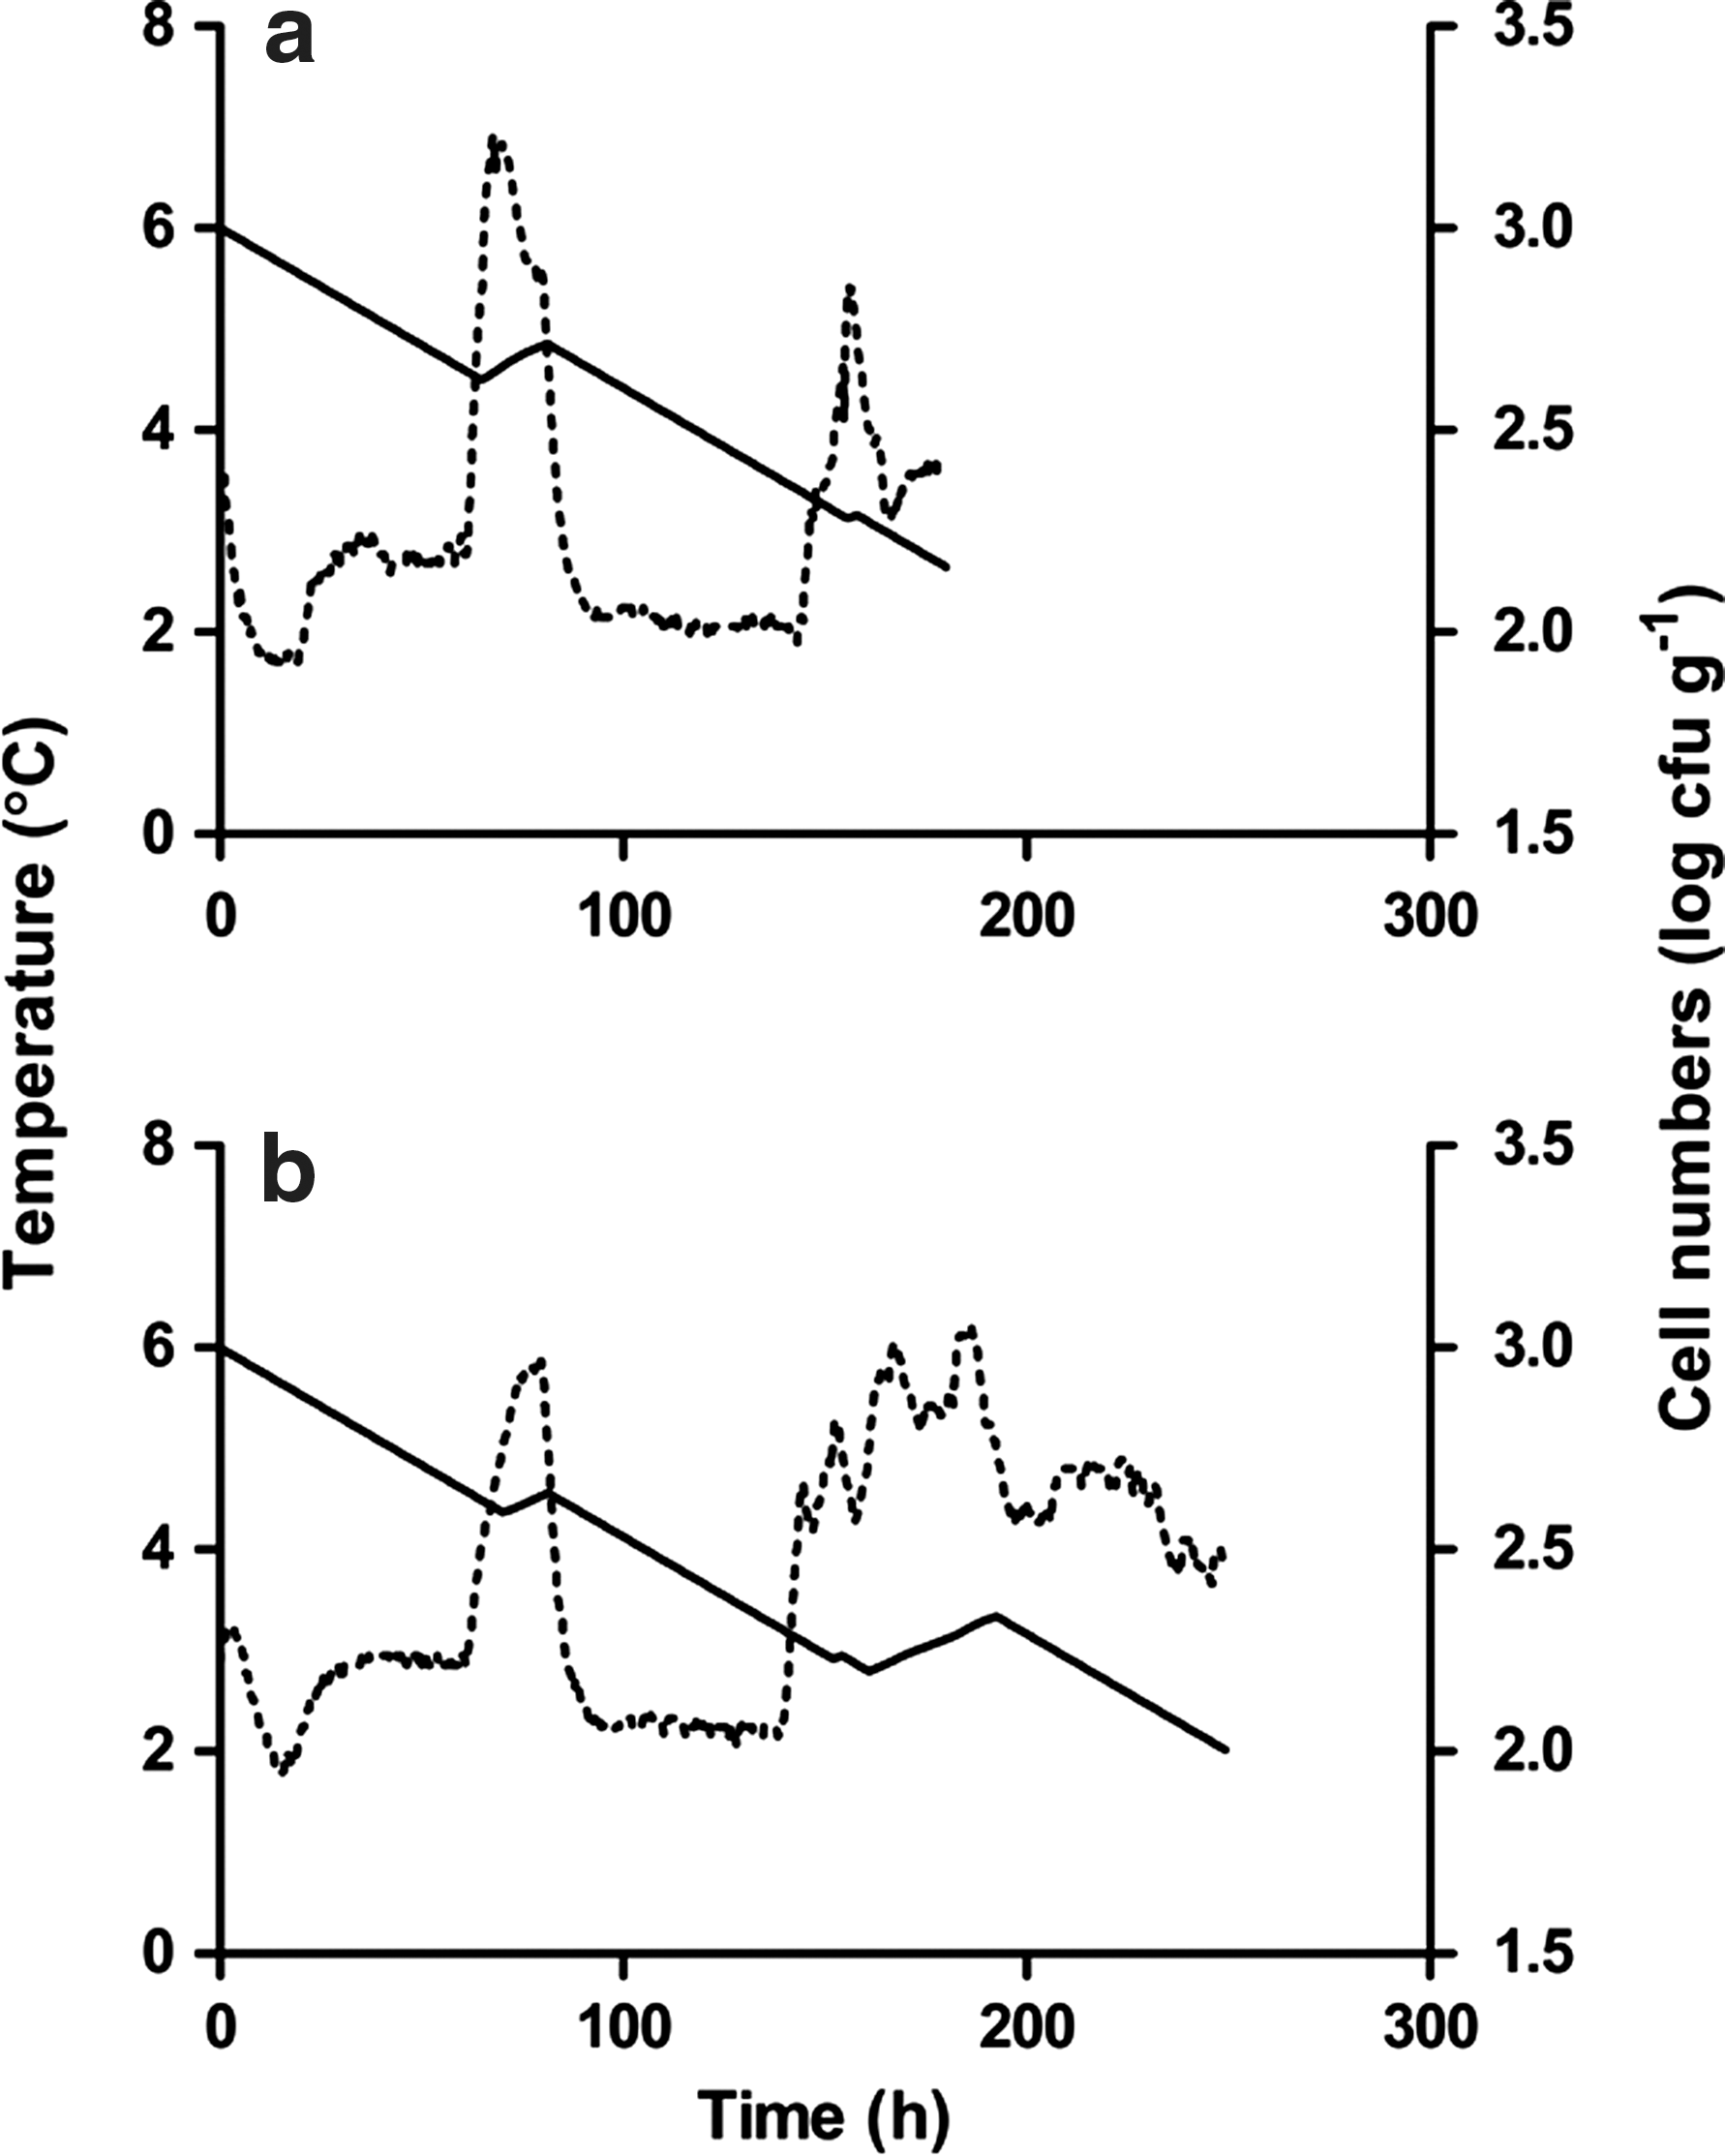
Simulated change in cell numbers (solid lines) corresponding to the Trial 2 temperature profiles (dotted lines) for Store 1, Top layer—Case type A
Total expected changes in cell numbers for all the temperature profiles were simulated using the distribution parameters from Table 1. The output distributions, when expressed as positive numbers, were generally shifted log normal, which was selected as the best fit by chi-squared comparison in 13 of 27 profiles; Pearson 5 and inverse Gaussian distributions were selected first in seven of 27 profiles; and the inverse Gaussian was the second most appropriate distribution in 16 profiles, while the Pearson 5 was selected as third most appropriate in 16.
An example of the shifted log normal output distribution is shown in Figure 4 (Trial 2, Store 3, Middle layer—Case type A). Parameter values for the distribution are given in Table 2. A mean average die-off of 0.983 log cfu g−1 was found over 27 profiles, with a minimum of 0.556 and a maximum of 1.60. Input distribution (b and k) influences on overall simulated cell die-off were also determined with @RISK. The sensitivity analysis given in Table 3 shows that k had a high positive correlation with die-off, while b had only a very slight effect to reduce overall die-off.

Example of the output shifted log normal distribution from the simulation using temperature profile from Trial 2, Store 3, Middle layer—Case type A.
SD, standard deviation.
Mean values of the total change in cell numbers, with Trial and Store as the factors, were compared by two-way ANOVA. Table 4 shows that there was a significant Trial effect, with 22.93% of the variation explained by the Trial. The interaction between Trial and Store was also very significant and accounted for 44.53% of the variation. When the data were analyzed using Trial and Case position as the two factors (Store was used as the replication), neither of the factors nor the interaction was significant (Table 4).
The results in Figure 3 suggest that time in the chain might be an important factor in the extent of cell die-off. Total elapsed time recorded for each instrumented case was compared to the corresponding predicted extent of cell die-off (Fig. 5), and an inverse relationship was found (r2=0.887). It is interesting to note that several points are above the regression line, and one furthest from the line (arrow in Fig. 5) corresponds to the temperature profile described in Figure 3b. Thus, the extent of die-off is determined mainly by residence time in the cold chain, and where there is significant time spent above the permissive temperature of 5°C, the die-off is reversed, resulting in points that deviate from the regression line.

Regression line for the comparison of the total predicted decrease in cell numbers from each simulated temperature profile from Trials 1–3. Arrow indicates the point corresponding to the temperature profile in Figure 3b.
Discussion
Temperature increases in the supply chain occurred during transportation between the processor and the distribution center (Trials 2 and 3) or between the distribution center and retail (Trials 1—3), a somewhat unexpected observation considering the study was conducted in winter. However, it should be noted that produce transport trailers are frequently heated in Canada to prevent freezing injury. In addition, shipments were delivered directly from the processor to the distribution center for Trial 1 but remained in the trailer over the weekend prior to delivery to the distribution center for Trials 2 and 3. Temperature increases seemed to occur only while the transport trailer was traveling between the processing plant and the distribution center, and not when the trailer was parked. Similar increases occurred during delivery from the distribution center to each retail store for Trials 1–3 (i.e., when the trailer was in transit). Temperature increases during transportation to the distribution center were reversed during subsequent cold storage but not if the increase occurred during delivery to the retail store. Higher temperatures could be expected during retail storage if larger increases occur during the transportation steps (during summer months, for example).
The temperature profiles documented here reflect what appears to be a well-controlled cold chain. Temperatures were generally lower than the reported minimum temperature that permits growth of E. coli O157:H7 (6°C) (Delaquis et al., 2007) and lower than the cut-off temperature of 5°C used as the point at which the growth model switches to the die-off model. Because this study was carried out in winter, we expected temperature would rarely reach “abusive” levels. However, increases in temperature occurred when the lettuce was transported or removed from the trucks, and smaller increases occurred during retail storage. There were also significant differences in time spent at the various stages along the supply chain, notably in retail storage, which is bound to fluctuate according to demand. It should be noted here that consumption patterns for fresh produce can vary with season. Hence, a similar study should be conducted during the summer months when changes in product demand and refrigeration burden could affect temperature profiles along the chain.
One of the clearest observations from this study was that distribution of the product would not result in overall growth, but rather a slight die-off (average of 0.556–1.60 log cfu g−1) of E. coli O157:H7. Doering et al. (2009) studied the effect of transportation temperature (4°C or 12°C) and time (0, 10, or 72 h) on E. coli O157:H7 inoculated onto lettuce. These workers found there was no significant effect on cell numbers; however, this work was conducted under laboratory conditions designed to mimic the various stages of transportation, processing, and storage. There have been few reports in the literature of actual temperature profiles under commercial shipping and storage conditions, which can be used to assess the safety of the supply chain.
Rediers et al. (2008) present temperature profiles of fresh-cut endives in a realistic food supply chain consisting of a producer, a processor, a distributor, and three restaurants. The cold chain evaluated by Rediers et al. (2008) was generally properly maintained, with temperature increases during transportation steps and temperature fluctuations during storage in restaurants similar to those found in the present study. Some investigators have reported mean produce temperatures measured before and after various steps in the supply chain. Hébert et al. (2003) measured mean whole lettuce temperatures of 6.1°C, 7.0°C, and 10.7°C upon delivery, and 5.3°C, 5.3°C, and 9.1°C following storage at three different retail stores. Nunes et al. (2008) reported mean surface temperatures for bagged salads of 6.8°C, 7.7°C, and 8.1°C upon delivery to three retail stores. The temperatures measured by Hébert et al. (2003) and Nunes et al. (2008) were also higher than those measured in the present study; however, both studies were conducted under warmer ambient conditions. Koseki and Isobe (2005) monitored the supply chain for whole lettuce in Japan and reported temperatures that allowed substantial growth of E. coli O157:H7. They observed that lettuce was normally shipped in non-refrigerated trucks, and that temperatures fluctuated between 3°C and 15°C during transportation. This contrasts with conditions reported here, but fresh-cut lettuce requires refrigeration to ensure an anticipated shelf-life of 10–14 days.
We incorporated distributions to describe the variation in parameter values found when initially generating the model using literature data (McKellar and Delaquis, 2011). This was necessary due to the fairly extensive variability in the literature data used for model development. The best fit output distribution was a shifted log normal for most temperature profile simulations, reflecting the shifted log normal distribution used to describe the input parameter, k, the die-off coefficient. The temperature coefficient for growth, b, was described by a Triangle distribution, and according to the sensitivity analysis, had very little impact on the output, as would be expected from the extent of die-off observed over all the temperature profile simulations.
Recently, Danyluk and Schaffner (2011) reported the development of a square root model based on literature data for the growth of E. coli O157:H7 on leafy green vegetables. This model was part of a preliminary framework for a farm to consumption quantitative risk assessment. In agreement with our earlier findings (McKellar and Delaquis, 2011), these workers showed that the Koseki and Isobe (2005) model tended to overpredict growth when compared to a model derived from literature data, but model variability or error were not considered. It is also difficult to compare our results with those of Danyluk and Shaffner (2011), since they applied their growth model to retail and home storage but did not consider the effects of shipping or storage at a distribution center, as described in the current work. These workers used an extreme value distribution to describe the range of temperatures during retail storage, which gave a mean value of 6.58°C and a maximum temperature of 31.7°C, much higher than was found in the present study. The increase in log cell numbers was generally less than 1 log, with 4% of the simulations being above 3 log increase (Danyluk and Shaffner, 2011). The present study reports an overall decline in cell numbers during shipping and storage. The temperature profiles are generally below the cut-off point for growth in our model (5°C), whereas the cut-off for the Danyluk and Shaffner (2011) model was the Tmin temperature of 2.6°C.
Statistical analysis also revealed that predictions for E. coli O157:H7 varied in response to overall differences in temperature profiles between Trials. Interaction between Trial and Store was also noted, indicating that the temperature profiles for each Store over the whole experimental period were affected mainly by the time spent in retail storage, which also varied between Trials. There appeared to be no significant influence on survival due to the position of the instrumented cases in the pallet. Interestingly, the most significant influence on die-off was the length of time the lettuce spent in the cold chain. The longer the lettuce was in the supply chain, the lower were the predicted counts. A very high correlation was predicted between these two factors, suggesting that E. coli O157:H7 cell populations may decline in packaged fresh-cut lettuce stored under ideal temperatures.
Footnotes
Disclosure Statement
No competing financial interests exist.