
Abstract
Thermonuclease is known as a specific virulence factor in Staphylococcus aureus. It is widely used as a genetic marker for detection of S. aureus in various types of food. Previous studies have revealed the existence of two functional thermostable nucleases encoded by two different genes (nuc1 and nuc2) in S. aureus. To identify the expression characteristics of these two genes, comparative mRNA analysis of nuc1 and nuc2 was carried out by quantitative real-time polymerase chain reaction (PCR). Distinct expression patterns were observed at different growth stages, and expression was under the control of the sae regulatory system in strain RN4220. The maximum level of nuc1 transcripts was at the post-exponential growth phase, and expression was notably down-regulated in a sae mutant. In contrast, nuc2 transcript levels declined after the early exponential phase, and they were slightly up-regulated in the sae mutant. Furthermore, unlike the expression of nuc1, which varied in three different S. aureus clinical strains, the transcription of nuc2 remained relatively constant. The nuc1 transcription level correlated well with thermonuclease activity results, which suggests that nuc1 plays a primary role in thermonuclease activity in S. aureus. This information will be useful for understanding thermonuclease gene function and alterations of regulation for pathogenesis and diagnosis of S. aureus.
Introduction
The expression of the thermostable nuclease is under the control of a complex regulatory network during the growth cycle such as agr, sae, sarA, and sigB (Novick, 2000, 2003; Beenken et al., 2010; Kullik et al., 1998). The sae system is a central downstream regulator, coordinating environmental signals with the internal regulatory circuitry governing virulence and other adaptive processes (Novick and Jiang, 2003; Geiger et al., 2008). It carries the saeR, a response regulator, and saeS, a histidine protein kinase (Giraudo et al., 2003). The activated response regulator may function as a transcriptional regulator via a specific DNA-binding domain (Steinhuber et al., 2003). Microarray analysis and proteomic data suggest that transcription of the nuc1 gene is down-regulated by the inactivation of the sae locus (Liang et al., 2006; Rogasch et al., 2006). However, the nuc2 gene expression pattern during growth or under the control of the sae locus is still unknown. To understand the differences in expression of these two thermonuclease genes, knowledge at the mRNA transcript level is required.
The aim of this study was to assess the expression levels of both the nuc1 and nuc2 genes in S. aureus during in vitro growth and investigate the expression difference of these two genes in the sae mutant and in three clinical strains. The findings will allow a better understanding of the respective roles of nuc1 and nuc2 in producing thermonuclease among S. aureus strains.
Methods
Bacterial strains and growth conditions
The bacterial strains used in this study are listed in Table 1. S. aureus strains were grown in Tryptic Soy Broth (TSB; Difco, BD, Franklin Lakes, NJ) with aeration at 37°C. Overnight S. aureus cultures were diluted 100-fold in fresh medium, and then samples were removed at 2, 3, 5, and 7 h post-inoculation for determination of the OD600nm, performing RNA isolation, and determining thermostable nuclease activity.
RNA preparation and reverse transcription
Total RNA was prepared using the RNeasy mini kit (Tiangen, Beijing, China) according to the manufacturer's recommendations. DNA was removed with RNase-free DNase (Qiagen, Courtaboeuf Cedex, France). Genomic DNA contamination was tested by polymerase chain reaction (PCR) with 16sRNA primers. In case of a positive result, another RNase-free DNase treatment was performed until a negative result was obtained. Total RNA was quantified measuring absorbance at 260 nm, and the integrity and purity were determined by agarose gel electrophoresis. DNA-free RNA was resuspended in 25 μL of DEPC–water and stored at −75°C.
Reverse transcription reactions were performed using Primescript RT Enzyme Mix I (TakaRa Bio, Shiga, Japan), following the manufacturer's recommended protocol. RNA isolation and cDNA synthesis were repeated three times for each growth condition.
Quantitative real-time PCR
Amplification and detection of the specific products were performed using an ABI 7500 Real-Time PCR System (Applied Biosystems, Carlsbad, CA). The sequences of the primers and probes are listed in Table 2. The PCR reaction was performed using the Premix Ex taq™ according to the manufacturer's recommendations (TakaRa Bio). Reaction mixtures were denatured at 95°C for 30 s, which was followed by 40 cycles at 95°C for 5 s and 60°C for 34 s, with data collection at 60°C.
PCR efficiency was calculated as described in Methods. A PCR efficiency of 100 is indicative for the amount of PCR product doubles in each cycle.
PCR efficiency using a fivefold cDNA dilution series.
Comparative analysis of the relative expression
Fivefold dilutions of cDNA were used to determine the PCR efficiency (E) for subsequent Q-PCR analysis. The PCR efficiency for each primer was determined by the cDNA dilution curves depicted by the SDS 2.0 software of Applied Biosystems. The expression of the staphylococcal nuclease genes at different growth phases were calculated relative to the calibration sample and an endogenous control (16S rRNA) to normalize the sample input amount (Eleaume and Jabbouri, 2004) using the formula 2-ΔCt (ΔCt=Ct gene of interest-Ct endogenous control) (Schmittgen and Livak, 2008). Three replicates were performed.
When comparing two target genes in the same sample, relative expression ratios were calculated with PCR efficiency correction and the Ct value using the formula deduced below
where E X1 is the efficiency of nuc1 amplification, and E X2 is the efficiency of nuc2 amplification.
Determination of thermonuclease activity
Each sample was heated at 100°C for 20 min, and supernatants were tested for nuclease activity using toluidine blue DNA agar according to the method described by Lachica et al. (1971). A spectrophotometric assay was also carried out for quantifying the difference among samples according to Man and Chesbro (1980) with modifications. Briefly, appropriately diluted boiled sample aliquots were tempered in a 50°C water bath, followed by addition of 20 μL of 2 mg/mL heat-denatured salmon sperm DNA and 20 μL of 50mM Tris buffer (pH 9.0) with 1 mM CaCl2. After 30 min of incubation, test reactions were stopped by adding an equal volume of 10% ice-cold perchloric acid. The solutions were held on ice for 10 min, and then 0.9 mL of cold distilled water were added to each tube, and they were centrifuged at 8000×g for 5 min at 4°C. Reagent blanks were prepared with 10 μL of ddH2O instead of sample aliquots. Supernatant fluids were measured at 260 nm using a DU-800 spectrophotometer. One unit of thermonuclease activity is equivalent to an increase at A260nm of 0.5 under the aforementioned reaction conditions.
Results
Comparative expression of nuc1 and nuc2 at different growth phases
To determine the expression profiles of the two thermostable nuclease genes during growth, the growth curves of wild-type RN4220 in batch cultures were characterized. Three replicates displayed similar growth curves, reaching the post-exponential phase at 5 h (Fig. 1A). The mRNA levels of nuc1 and nuc2 were quantified and calculated as transcripts per cell, assuming 104 copies of the ribosomal RNA per cell (Scheu et al., 1998). A low mRNA level of nuc1 was found at the early-exponential phase (2 h), and then increased 4.33-fold and 6.13-fold at 3 and 5 h on average, simultaneously with the growth of the bacterial cells. The maximum level of nuc1 transcription was reached at the post-exponential growth phase. However, the nuc2 transcripts did not follow the same pattern as nuc1 (Fig. 1A). Higher levels of nuc2 transcription were found at 2 and 3 h, and subsequently decreased 41% and 61% at 5 and 7 h compared with the level at 3 h.
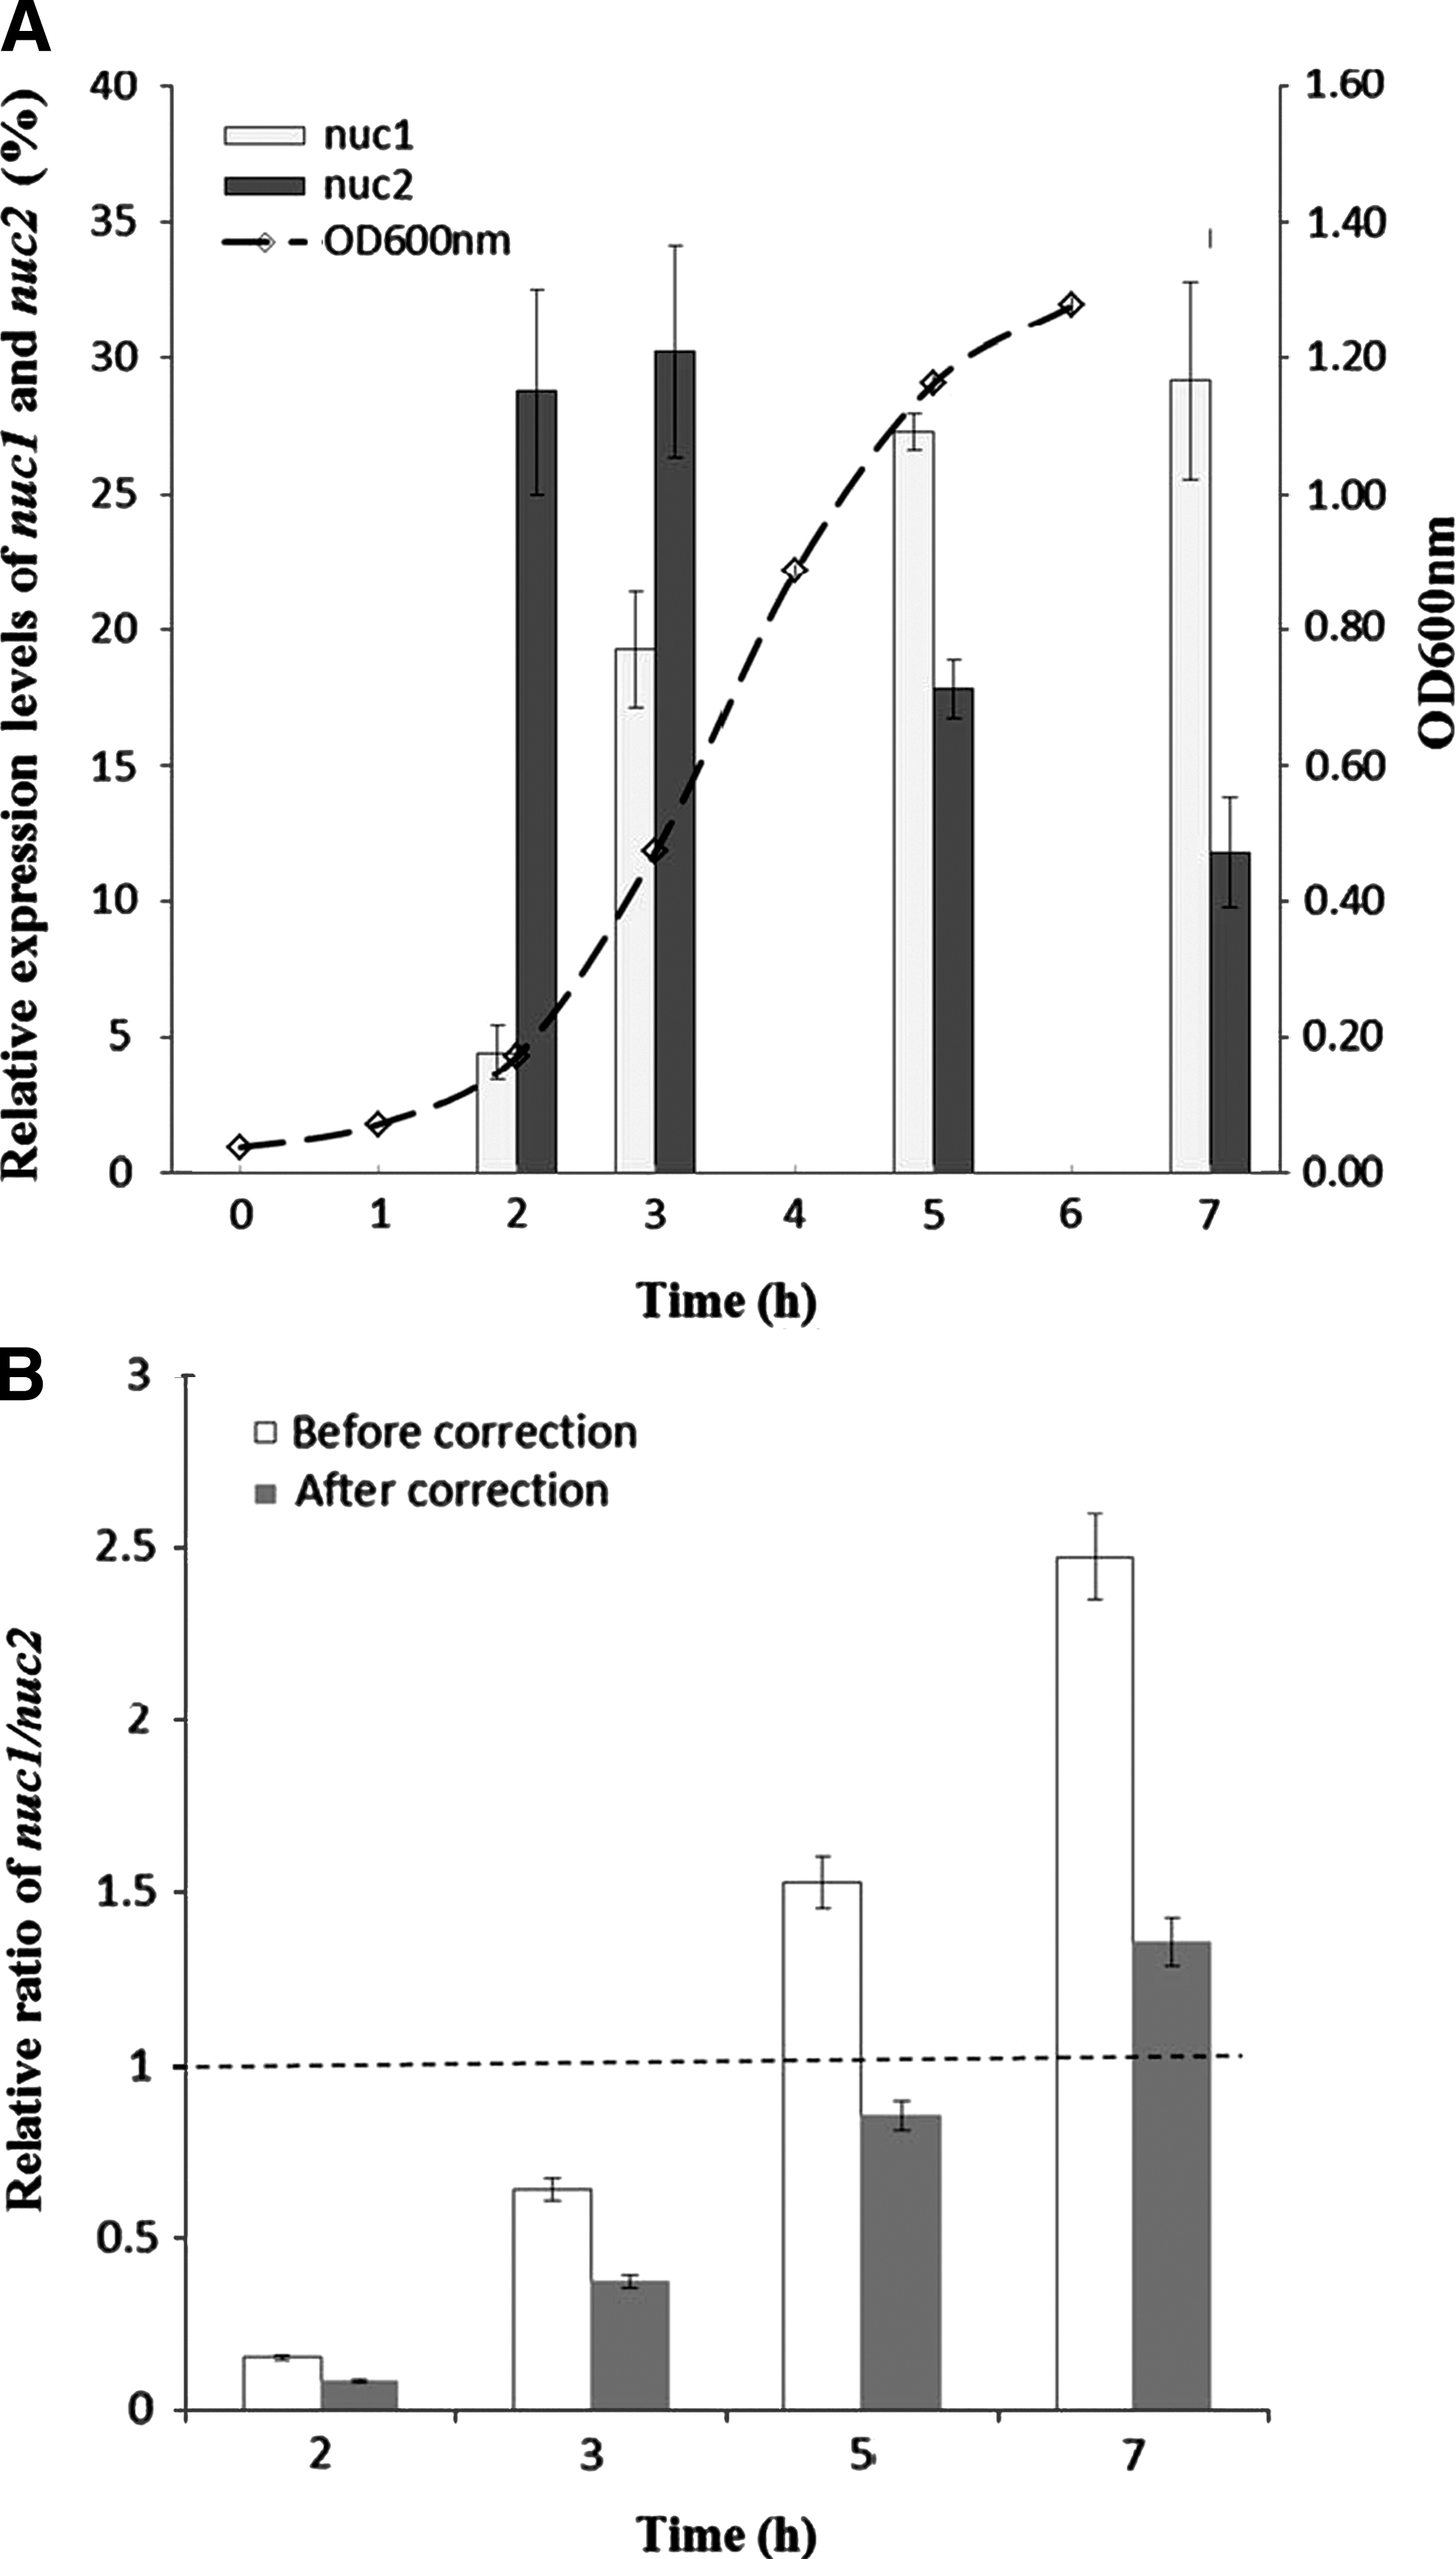
The nuc1 and nuc2 mRNA levels in strain RN4220 grown in Tryptic Soy Broth (TSB) medium at 2, 3, 4, 5, and 7 h post-inoculation
The relative ratio of nuc1/nuc2 transcripts was calculated in order to investigate the expression connection between nuc1 and nuc2. The ratio increased from 0.15 to 2.47, from 2 to 7 h (Fig. 1B). When corrected by the amplification efficiency (Table 2, formula 1), the value of the ratio decreased, ranging from 0.08 to 1.35. Nevertheless, the increasing ratio of nuc1/ nuc2 suggested that nuc1 has a more pronounced role in expression of thermonuclease than nuc2 during growth.
Effects of sae mutation on the expression of thermostable nuclease in RN4220
To determine whether the expression of nuc1 and nuc2 was coordinately regulated by sae, a sae mutant of RN4220 was constructed and nuc1 and nuc2 mRNA levels of the mutant were compared to the wild type during growth. A significant decrease of nuc1 gene expression was observed in the sae mutant (Fig. 2). In comparison to the wild type, the nuc1 transcripts were down-regulated 8.8-, 9.6-, 8.5-, and 24.4-fold at 2, 3, 5, and 7 h in the sae mutant, respectively, indicating a more pronounced impact of the sae gene at the post-exponential phase. On the contrary, there was only a slight change (1.62-fold increase on average) of the nuc2 transcripts in the sae mutant compared to the wild type, ranging from 0.68 to 2.23 during growth. This implied that there was not a strong influence of sae deletion on the nuc2 expression.

Effect of sae mutation on both nuc1 and nuc2 transcripts. Wild-type strain RN4220 was used as the calibration sample at every time point with the mutants. The endogenous control (16S rRNA) was used to normalize the sample input amount. The relative value of nuc1 (white bars) and nuc2 (black bars) transcripts in the sae knockout mutant is shown in logarithmic scale by the 2-ΔΔCt method.
To determine the correlation between the mRNA levels and the expressed enzyme, thermonuclease activity was tested in the wild type and the sae mutant. As expected, the toluidine blue DNA agar showed a comparatively smaller size of the clear zones in the sae mutant at different stages of growth (Fig. 3A). Besides, the spectrophotometric assay revealed the thermonuclease activity had decreased 4.8-fold in the sae mutant at 5 h (Fig. 3B). The ratio of the activity in the sae mutant versus the wild type (dashed line in Fig. 3B) decreased during growth, indicating stronger regulation of sae at the post-exponential phase, which corresponded with the changes in nuc1 transcription levels.

Thermonuclease activity of the RN4220 (wild type) and sae mutant during growth.
Expression of thermonuclease in different strains
Virulence factors in different strains are not always regulated in the same way (Bronner et al., 2004). To determine the expression of the two thermonuclease genes in different strains, expression quantification in 3 clinical strains: B272, ATCC6538, and S6 was performed. The level of nuc gene expression by strain RN4220 was assigned a value of 1 dot for easy comparison with clinical strains. Notable differences in the relative levels of nuc1 transcript in strains S6, ATCC6538, and B272 were found compared to RN4220, ranging from 12.9- to 0.45-fold (Fig. 4A). Unlike the nuc1 gene, the relative level of nuc2 transcripts varied less than 2.2-fold compared to RN4220. Higher nuc1 and nuc2 transcript levels in strain S6 and ATCC6538 were consistent with their relatively higher thermonuclease activity at 3 h (Fig. 4B) compared to strain RN4220. Surprisingly, we did find relatively low transcript levels for nuc1 and nuc2 in strain B272, which produces 10 types of enterotoxins (Table 1), and correspondingly, the thermonuclease activity was the lowest at 3 and 5 h compared to the other strains (Fig. 4B).

Thermonuclease expression in strain S.6, ATCC6538, and B272.
Discussion
In the present study, we identified the expression patterns of two thermonuclease genes by a TaqMan-based real-time PCR method. To obtain reliable quantification results, normalization and efficiency correction were applied, and results of the two nuc genes at the mRNA levels were compared. 16S rRNA was chosen as the endogenous control to reduce sample-to-sample variation because the expression levels of 16S rRNA were constant and relatively stable between 3 and 7 h when compared to the other housekeeping genes in S. aureus (Eleaume and Jabbouri, 2004; Sabersheikh and Saunders, 2004). The amplification efficiency differences between the nuc gene and reference 16S rRNA gene were 1.6% and 3.1%, which were similar enough to apply the comparative Ct method with the endogenous normalization (Schmittgen and Livak, 2008). Nonetheless, when comparing the expression of the two nuc genes, the amplification efficiency difference was 4.7%. Since 5% difference in amplification efficiency can result in a twofold difference in the PCR product after 26 cycles of PCR (Freeman et al., 1999), we made a correction after the initial ratio using formula 1. Although the ratio variation still followed the same trend during growth, the value did decrease 41–45% (e.g., the level of nuc1 transcript became lower than that of nuc2 at 5 h post-inoculation after correction; Fig. 1B). The actual fold change may be exaggerated without correction even when the efficiency differences are close to 5%; however, more than a twofold change could be convincing when the differences in efficiency are close to 5%.
Quantification of transcription levels of genes plays a central role in the understanding of gene function and alterations in regulation (Overbergh et al., 2003). Transcription of these two thermonuclease transcripts were both expected to rise at the late-exponential phase of growth, because the thermonuclease was observed mainly synthesized at the post-exponential phase and continued at a high rate into the stationary-growth phase (Erickson and Deibel, 1973; Smeltzer et al., 1993). Furthermore, agr, sigB, and sae regulators had been reported to activate the expression of thermonuclease during the post-exponential phase (Dunman et al., 2001; Rogasch et al., 2006; Kullik et al., 1998). In the current study, the increasing trend of nuc1 transcripts during growth is consistent as expected. However, unlike nuc1, nuc2 transcript levels reached maximum at the early-exponential phase but decreased 61% at late-exponential phase (Fig. 1A). The results suggest that nuc1 and nuc2 are not co-regulated, and their regulation mechanism might be different during growth. The increasing ratio of nuc1/nuc2 combined with increasing thermonuclease activity with growth (Fig. 3B) indicated that nuc1 plays a primary role in producing thermonuclease during growth.
The sae locus was found to be a crucial element in the regulatory cascade governing the staphylococcal virulon (Li and Cheung, 2008). Microarray analysis and proteomics have revealed that most of the genes activated by sae are involved in bacterial adhesion, immune modulation, or toxicity (Rogasch et al., 2006). The production of thermonuclease was measured and shown to be either directly or indirectly upregulated by sae at the transcriptional level (Giraudo et al., 1997; Goerke et al., 2001; Rogasch et al., 2006). In this study, nuc1 gene expression was significantly down-regulated due to the sae mutation at every time point, while an inconspicuous impact of the sae deletion on the expression of the nuc2 gene was found (Fig. 2). The production of thermonuclease was decreased in the sae mutant at different growth phases (Fig. 3), which was consistent with the variation in nuc1 gene transcription, suggesting that sae affects the thermonuclease activity by down regulating the expression of nuc1 gene, which could explain why nuc2 was not considered to express the thermonuclease in sae mutants in previous studies (Giraudo et al., 1994, 1996). A stronger relevance between thermonuclease activity and nuc1 expression was found, and this may due to the activity and function differences of nuc1 and nuc2. A functional characterization of these genes is currently under way in our laboratory.
Different S.aureus strains showed significant variations in their expression patterns of virulence genes, including hla, spa, and the enterotoxin genes (Sabersheikh and Saunders, 2004; Lee et al., 2007). Variation in thermonuclease activity among different S. aureus strains has also been reported (Erickson and Deibel, 1973; Man and Chesbro, 1980; Sabersheikh and Saunders, 2004; Rogasch et al., 2006). However, few data are available on the transcript levels of either nuc1 or nuc2 among different strains of S. aureus. In the current study, three additional strains were chosen to investigate the expression of the nuc genes. S. aureus S6 is a naturally occurring toxinogenic strain characterized as a hyper-producer of the exoprotein virulence factors, staphylococcal enterotoxin B (SEB), and lipase (Hart et al., 2001). Significantly higher nuc1 expression was observed in S6, i.e., 11.4 and 12.9-fold increases compared with the laboratory strain RN4220 at 3 and 5 h, respectively. ATCC6538 also showed a higher expression of the nuc1 gene, 6.5-fold higher than RN4220 at 5 h. B272 is a S. aureus strain isolated by the Peking University Health Science Center, which is methicillin-resistant S. aureus (MRSA) strain that carries 10 different enterotoxin genes (Table 1). Interestingly, the lowest expression of nuc genes was observed in this strain, and a correlation between nuclease activity and enterotoxin type was not evident. Furthermore, less variation of nuc2 transcripts among different strains were found than that of nuc1, implying that nuc1 and nuc2 are regulated differently in S. aureus. In addition, higher levels of nuc1 mRNA transcripts corresponded with higher thermonuclease activity: however, the differences were not as obvious among these four strains. This may be due to the regulation after transcription in different strains. The regulation mechanism of the nuc genes among different strains requires further investigation.
Conclusion
The comparative expression analysis of two analogous nucleases (nuc1 and nuc2) illuminated a distinct expression pattern of nuc1 and nuc2 in both laboratory and clinical strains. The nuc1 transcripts were consistent with the thermonuclease activities during growth and in the sae mutant, which suggested nuc1 expression plays a more pronounced role in thermonuclease activities than that of nuc2. Furthermore, unlike the expression of nuc1 that varied in three different S. aureus clinical strains, the transcription of nuc2 remained relatively constant. This study helps us to better understand the relationship between the two co-existent thermostable nucleases in S. aureus. However, further studies are required for deciphering different regulation mechanisms of nuc1 and nuc2 and their individual function.
Footnotes
Acknowledgments
This work was jointly supported by the Ministry of Science and Technology of China (grants 2011DFA31220, SS2012AA101001, and 2009BADB9B01), the National Natural Science Foundation of China (grants 30972485 and U1031003), and the Science & Technology Commission of Shanghai Municipality (grants 10DZ0503500 and 10142201300).
Disclosure Statement
No competing financial interests exist.