
Abstract
An 11-gene multiplex polymerase chain reaction (mPCR) was developed based on genes that code for serogroup-specific O-antigens and four major virulence factors (intimin, enterohemorrhagic hemolysin, and Shiga toxins [Stx] 1 and 2), to detect O157 and the “top six” non-O157 (O26, O45, O103, O111, O121, and O145) Shiga toxin–producing Escherichia coli (STEC). The assay specificity was validated with pure cultures of seven major STEC (185 strains), 26 other STEC (65 strains), non-STEC (five strains), and 33 strains of other genera and species. Sensitivity of the assay with cattle fecal sample spiked with pooled cultures of seven major STEC was 105 colony-forming units (CFU)/g before enrichment and 102 CFU/g after enrichment. The applicability of the assay to detect STEC in fecal samples (n=50), before and after enrichment, was evaluated by comparing with culture-based methods for O26, O111, and O157. The mPCR assay of 50 fecal samples showed seven (14%) positive before enrichment and 23 (46%) positive after enrichment for one or more of the seven O-groups. Overall, 17 isolates from 17 fecal samples and 27 isolates (four for O26, three for O45, and 20 for O103) from 19 fecal samples were obtained, by culture-based methods, for O157 and non-O157 serogroups, respectively. None of the 27 non-O157 isolates possessed the stx genes, suggesting that cattle harbor Shiga toxin–negative E. coli belonging to the “top six” non-O157 serogroups. Our data, although based on a limited number of samples, suggest that the sensitivities of the mPCR and culture-based methods in detecting the seven serogroups of STEC in feces differed between O-groups. An obvious limitation of our mPCR is that the concurrent detection of virulence genes and the serogroups in a sample does not necessarily associate the virulence genes with the prevalent serogroups in the same sample. The major application of our 11-gene mPCR assay may be in identifying putative colonies of STEC obtained by culture-based methods.
Introduction
Multiplex polymerase chain reaction (mPCR)–based detections have been developed to identify non-O157 STEC in food and carcass samples (DebRoy et al., 2005, 2011; Fratamico et al., 2009; Monday et al., 2007; Perelle et al., 2004, 2007; Valadez et al., 2011). However, none of them has evaluated applicability of the mPCR to detect O157 and the “top six” non-O157 serogroups in fecal samples of cattle. We designed an 11-gene multiplex PCR assay to detect the seven major STEC serogroups (O26, O45, O103, O111, O121, O145, and O157) concurrently with the four major virulence genes (stx1, stx2, ehxA, and eae). The assay was validated with pure cultures of STEC, and applicability of the assay to detect the seven STEC in fecal samples was evaluated.
Methods
Primer design
The wzx gene, which encodes for a flippase required for O-polysaccharide export, was used to design primers for serogroups O26, O45, O103, O111, and O145. The wbqE gene, which encodes for a putative glycosyl transferase, and wbqF, which encodes for a putative acetyl transferase (Fratamico et al., 2003), were used to design primers for O121. Primers used for virulence genes were validated in our previous study (Bai et al., 2010). Primers were designed to amplify the targets with distinct amplicon sizes and were designed to match all available sequences for the respective O-serogroups at the time of designing. The primer sequences are given in Table 1.
PCR reactions and visualization
All primer stocks were prepared in 1× TE buffer (10 mM Tris, bring to pH 8.0 with HCl, 1 mM EDTA; Integrated DNA Technologies, Inc., Coralville, IA) at concentrations of 100 pM/μL. Equal volumes and concentrations of the 11-primer pairs (22 primers), except for O111, which was doubled, were mixed together. One microliter of the primer mix was used in a 20-μL PCR reaction resulting in final primer concentrations of 0.42 μM for O111 and 0.21 μM for all other primers in the reaction. Each reaction also contained 10 μL of BioRad (Hercules, CA) iQ Multiplex Powermix (without additional supplement), 1 μL of boiled bacterial cells, or DNA extracted from fecal, spiked fecal, or enriched fecal samples, and 8 μL nuclease-free water. The PCR amplification program included a 5-min denaturation at 94°C, followed by 25 (for pure culture) or 35 cycles (for all others) of 94°C for 30 sec, and 67°C for 80 sec. The PCR products were run on a 1.2% agarose gel and visualized with a GelDoc 2000 Fluorescent Imaging System (BioRad).
Template DNA preparation
Bacterial cultures, stored in CryoCare beads (Key Scientific Products, Stamford, TX) at −80°C, were streaked on blood agar plates (BAP; Remel, Lenexa, KS) and incubated overnight at 37°C. One or two colonies of each strain were suspended in 1 mL of distilled water and boiled for 10 min. After a quick centrifugation, 1 μL of the supernatant was used as the DNA template. GeneClean DNA extraction kit (MP Biomedicals, Solon, OH) was used for Escherichia coli (EC) broth (Oxoid Ltd., Hampshire, UK) (Vimont et al., 2007)/enriched fecal samples; the QIAamp DNA stool mini kit (Qiagen, Valencia, CA) was used for all other fecal samples.
STEC strains used in the initial assay development
Strains representing the seven O-serogroups were used for the initial assay development and to determine detection sensitivity. Strains TW 1597 (O26; stx1+, eae +, ehxA +) and 2566:58 (O45; eae +) were kindly provided by The Thomas S. Whittam Microbial Evolution Laboratory, Michigan State University. Strains 15612-1 (O103; stx1+, eae +, ehxA +), 4190 (O121; negative for all 4 virulence genes), 7726-1 (O111; stx1+, stx2+, eae +, ehxA +), and 1234-1 (O145; stx1+, stx2+, eae +, ehxA +) were from our collection (Renter et al., 2005). Strain 43894 (O157; stx1+, stx2+, eae +, ehxA +) was from the American Type Culture Collection (ATCC; Manassas, VA). For assay development, single colonies of the seven strains from BAP were cultured overnight in Luria Bertani (LB) broth individually, and 100 μL was inoculated into 10 mL of LB broth and incubated for 4–5 h until they reached an absorbance of 0.5 at 600 nm (∼108 CFU/mL). The seven-strain cultures were mixed in equal amounts, and 1 mL of the pooled mixture was boiled for 10 min; 1 μL of the supernatant after a quick spin was used in the mPCR reactions. For the pure culture sensitivity test, six 10-fold dilutions were made from the seven-strain culture mixture, and 1 mL of each dilution was boiled and centrifuged as before for use as template in mPCR. Aliquots of the same dilutions were spread-plated on MacConkey agar to determine bacterial cell concentrations.
E. coli and non-E. coli strains used for assay specificity validation
A collection of 185 strains belonging to the seven major STEC (Table 2), 65 strains belonging to 26 other STEC serogroups (O6, O8,
PCR assay sensitivity with pure cultures and cattle fecal sample spiked with pure cultures
The seven STEC strains were grown individually to an absorbance of 0.5 at 600 nm (∼108 CFU/mL), and equal volumes of the cultures were pooled together. Serial 10-fold dilutions were made, and 1 mL of each dilution was boiled and used for the mPCR assay. For fecal samples spiked with the seven STEC strains, the pooled cultures were prepared as before, and 1 mL of 10-fold serially diluted mixtures were inoculated into aliquots (10 g of fecal sample for each dilution) of a fecal sample collected from a feedlot steer. Another aliquot (10 g) of feces inoculated with 1 mL of sterile LB broth served as an uninoculated control. Each aliquot of the fecal sample, inoculated with different dilutions of the culture mixture, was also enriched by placing 1 g in 9 mL of EC broth and incubating for 6 h at 40°C. DNA was extracted from inoculated fecal samples before and after enrichment. The dilutions of the seven-strain mixture used for spiking the fecal samples were also spread-plated on MacConkey agar to determine bacterial cell concentrations. The experiment to determine assay sensitivity was repeated with a different fecal sample.
PCR assay versus culture detection of STEC in cattle fecal samples
A total of 50 fecal samples were collected from feedlot cattle, and ∼1 g of each sample was mixed in 9 mL of EC broth, and incubated at 40°C for 6 h. DNA was extracted from fecal suspensions in EC broth, before and after enrichment, with the GeneClean kit and used in mPCR assay. The enriched samples were also subjected to immunomagnetic separation (IMS) with Dynabeads (Invitrogen, Carlsbad, CA) for O26, O111, and O157. The O157 beads were plated on sorbitol MacConkey agar (SMAC) with cefixime (0.5 mg/L) and potassium tellurite (2.5 mg/L), six sorbitol-negative colonies were picked for O157 antigen latex agglutination test, and colonies positive for agglutination were subjected to mPCR assay. The O26 and O111 beads were streaked on MacConkey agar plates, and 10 colonies, randomly picked from each sample, were streaked individually on BAP and incubated overnight. A single colony from each of the 10 cultures was suspended individually in 1 mL of distilled water, and 100 μL of suspensions from each of the 10 colonies from each sample were pooled together and subjected to the mPCR assay. For samples that were positive for any of the STEC based on the mPCR assay of the pooled cultures, the 10 individual colonies were subjected to mPCR to identify the positive pure culture. The isolates positive for STEC were stored at −80°C. Strains of stx positive E. coli that did not belong to the seven major STEC were submitted to the Pennsylvania State University E. coli Reference Center for identification of serogroup.
Results
mPCR assay with pure cultures
The specificity of each primer pairs was tested individually using the mixture of the seven E. coli serogroups (O26, O45, O103, O111, O121, O145, and O157). The primers only amplified the corresponding STEC serogroup (data not shown). The serogroup-specific primers were then mixed with the primers for the four virulence genes, stx1, stx2, eae, and ehxA. After optimizing PCR conditions (stated in the materials and methods section), 11 distinct bands were obtained (Fig. 1). The sizes of the amplicons were as follows: 890 (wzx O45), 740 (wzx O103), 655 (stx1), 587 (wbq O121), 523 (wzx O145), 477 (stx2), 417 (wzx O26), 375 (eae), 296 (rfb O157), 230 (wzx O111), and 199 bp (ehxA).

Gel image of amplicons of 11 genes amplified by multiplex polymerase chain reaction of a pooled mixture of pure cultures of Escherichia coli O26, O45, O103, O111, O121, O145, and O157 strains. Lane 1, molecular size markers; lane 2, amplicons of 11 gene segments.
A total of 185 strains belonging to the seven major serogroups (30 [O26], 4 [O45], 41 [O103], 39 [O111], 12 [O121], 15 [O145], and 44 [O157]) were tested. The 11-gene mPCR assay confirmed the serogroup of each of the 185 strains and their virulence gene profiles. The prevalence of the four virulence genes varied between the serogroups (Table 2). None of the O-serogroup primer pairs amplified any of the 65 strains in the other STEC O-serogroups or from the five non-STEC ATCC strains; however, the primer pairs of the virulence genes amplified the virulence genes in other STEC O-serogroups. None of the 33 non-E. coli strains, representing both Gram-positive and Gram-negative bacterial species, showed any amplification (data not shown).
Assay sensitivity with pure cultures and spiked fecal samples
The initial concentration of pooled cultures of the seven O-serogroups was 6.5×10⁷ CFU/mL (mean of two replications), which was subjected to four additional 10-fold dilutions to obtain 6.5×10⁶ to 6.5×10³ CFU/mL. The minimum concentration of the pooled culture that amplified all 11 genes was 6.5×10⁴ CFU/mL (Fig. 2). In fecal samples spiked with different concentrations of the pooled cultures of the seven O groups, the sensitivity of detection was 6.5×10⁵ CFU/g before enrichment (Fig. 3) and 6.5×10² CFU/g after enrichment for 6 h in EC broth (Fig. 4).
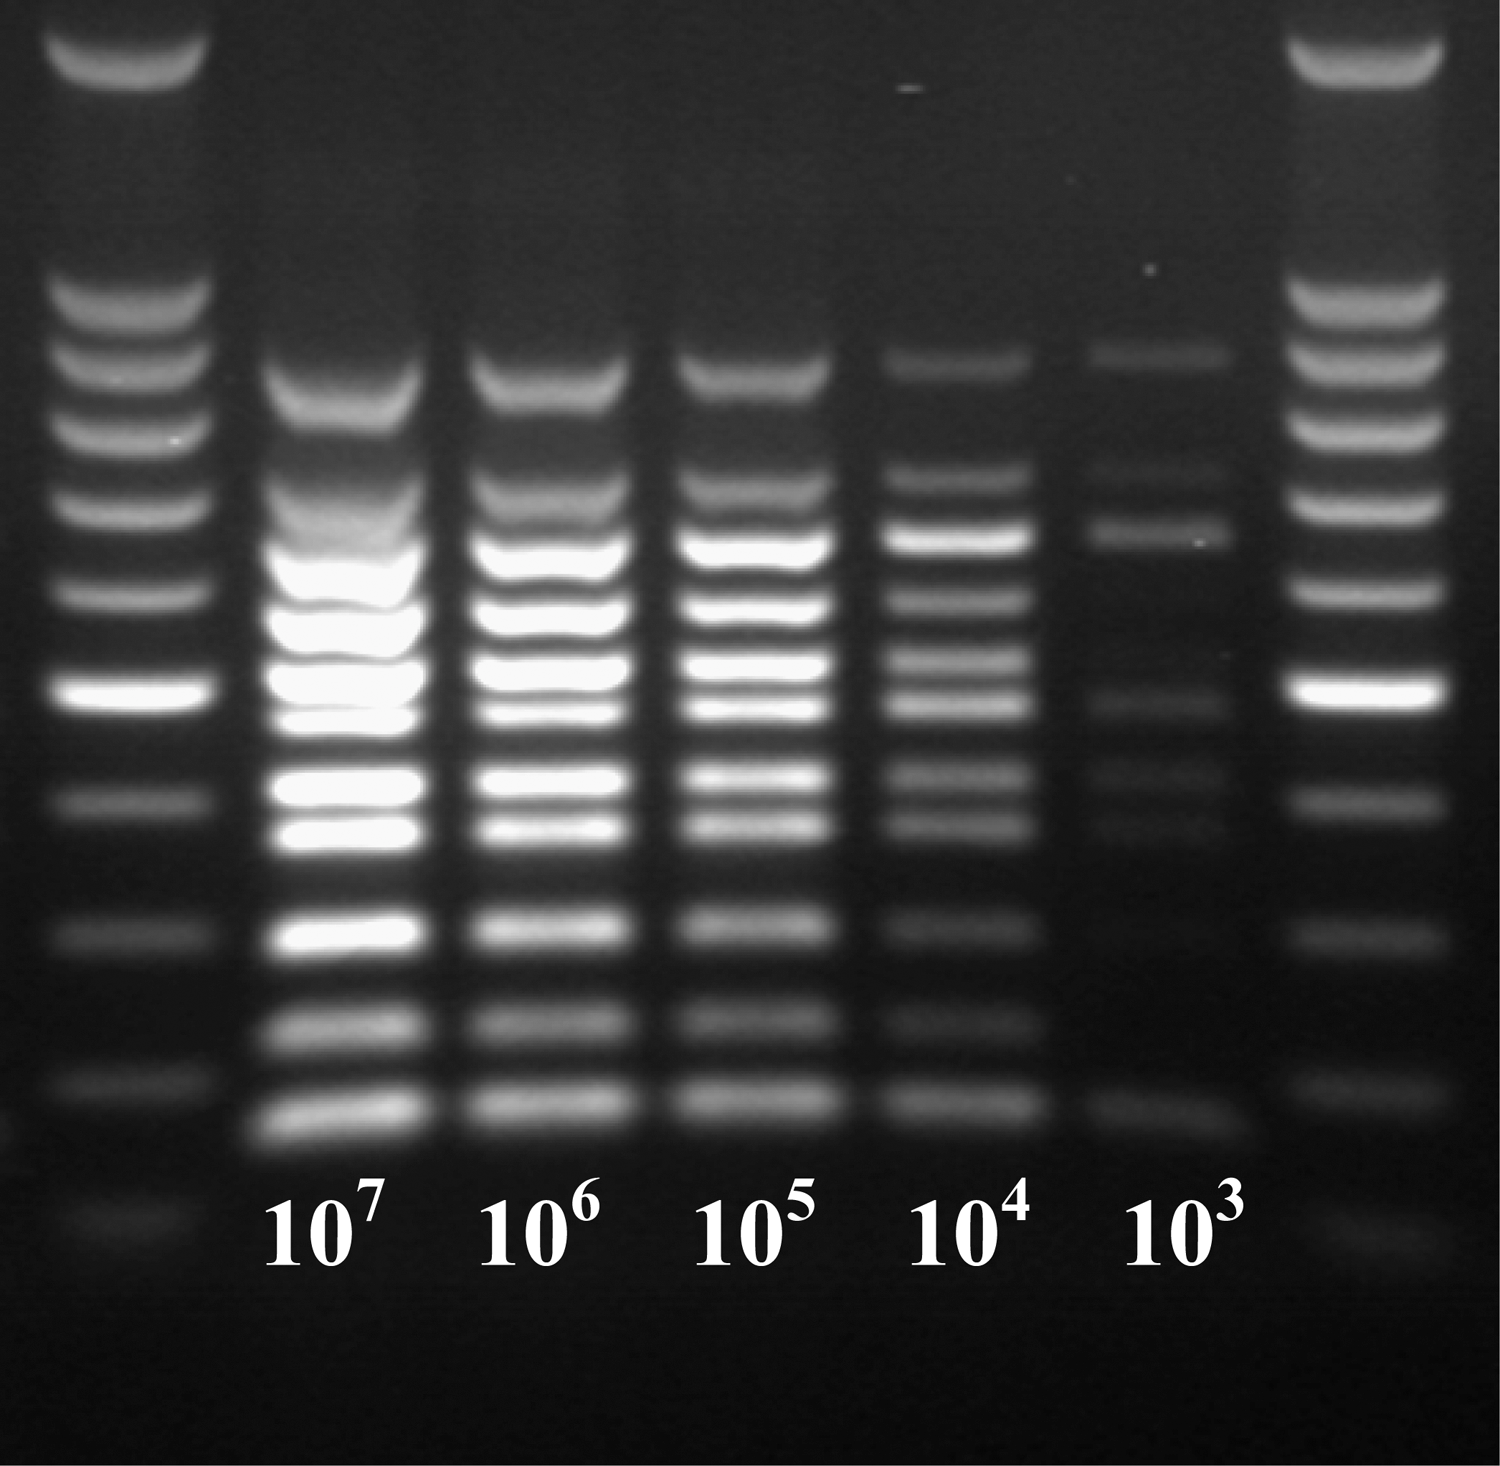
Sensitivity of the 11-gene multiplex polymerase chain reaction tested with 10-fold, serially diluted pooled cultures of Escherichia coli O26, O45, O103, O111, O121, O145, and O157 strains. Lanes 1 and 7, molecular size markers; lanes 2–6, amplicons from pooled cultures with concentrations of 107, 106, 105, 104, and 103 CFU/mL.
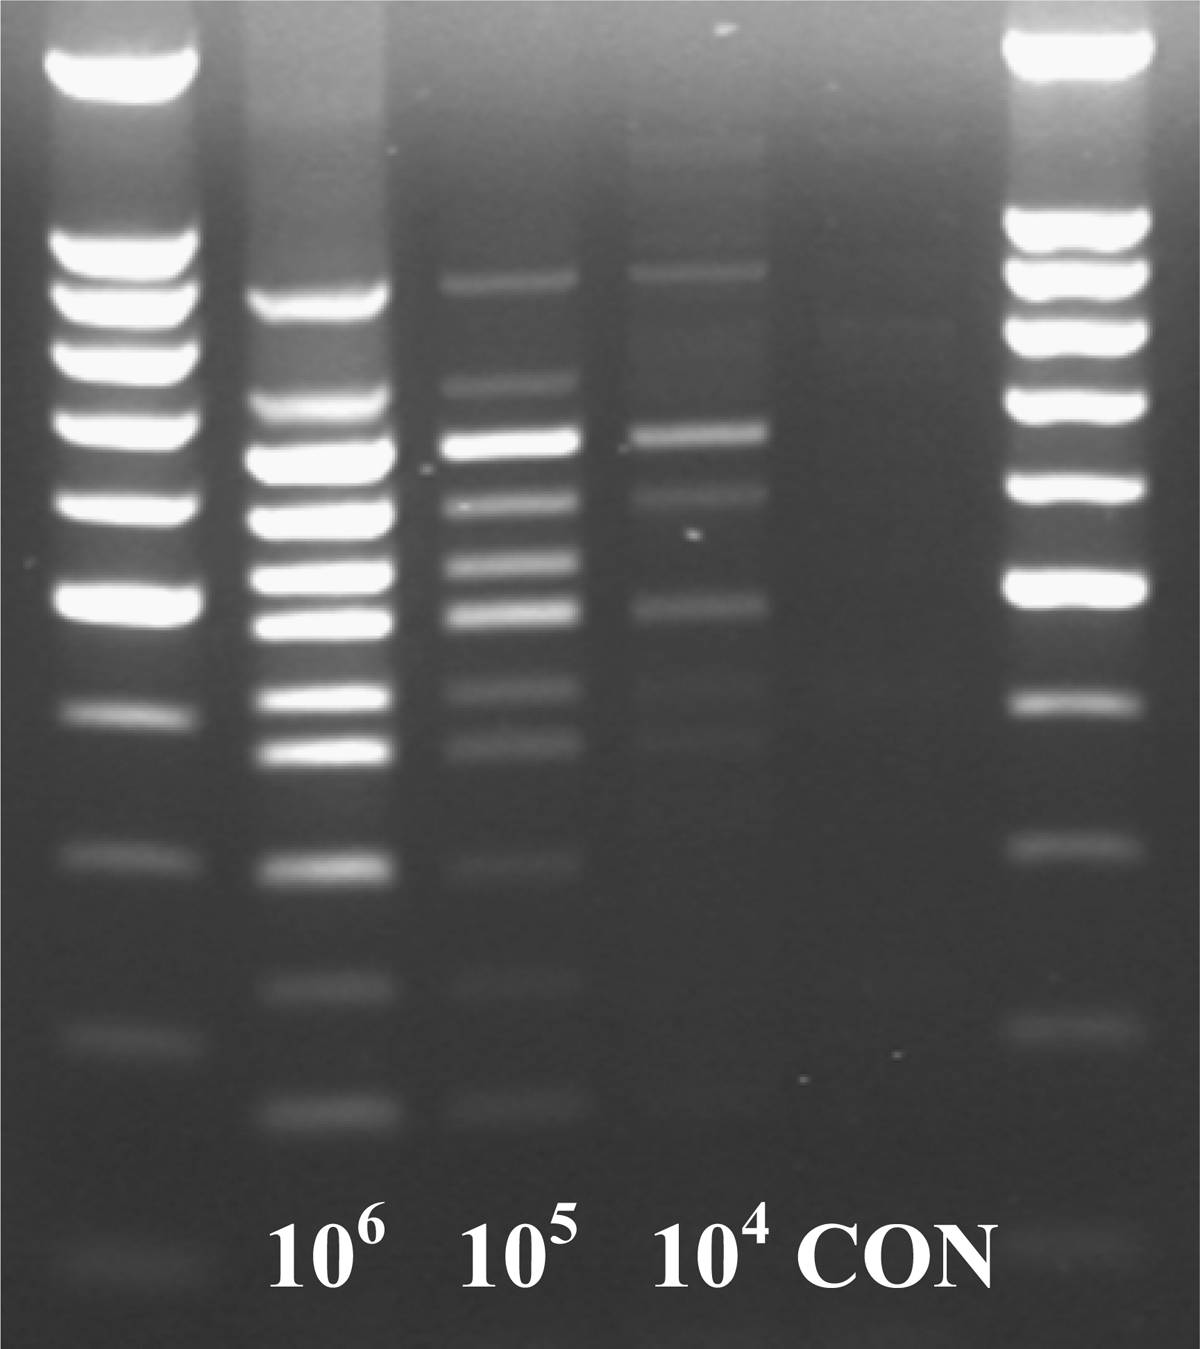
Sensitivity of the multiplex polymerase chain reaction assay determined with cattle fecal sample spiked with 10-fold, serially diluted pooled cultures of Escherichia coli O26, O45, O103, O111, O121, O145, and O157 strains. Lanes 1 and 6, molecular size maker; lanes 2–4, amplicons obtained from cattle fecal sample spiked with pooled cultures of 106, 105, and 104 CFU/g of feces; lane 5 (CON), cattle feces before spiking with pooled E. coli cultures.

Sensitivity of the multiplex polymerase chain reaction assay determined with cattle fecal sample spiked with 10-fold, serially diluted pooled cultures of Escherichia coli O26, O45, O103, O111, O121, O145, and O157 strains after enrichment in Escherichia coli broth at 40°C for 6 h. Lanes 1 and 10, molecular size makers; lanes 2–8, amplicons from enriched cattle fecal sample spiked with pooled cultures of 106, 105, 104, 103, 102, 101, and 100 CFU/g of feces; lane 9 (CON), enriched cattle feces without added E. coli cultures.
PCR assay versus IMS-based detections of O26, O111, and O157 in cattle fecal samples
The mPCR assay of the 50 fecal samples suspended in EC broth before enrichment showed seven samples (14%) positive (O26=1, O45=4, O103=1, O121=2, and O157=1) compared to 23 samples (46%) positive for one or more of the seven O groups (O26=9, O45=6, O103=8, O121=3, and O157=8) after 6 h of enrichment (Table 3). Similarly, more samples were positive for the four virulence genes after enrichment compared to samples before enrichment. None of the samples was positive for O111 and O145 serogroups. Of the 50 fecal samples, 27 (54%) samples were negative for all of the seven major O-serogroups, and 14 (28%) were positive for one, seven (14%) were positive for two, and two (4%) were positive for three of the seven serogroups.
We plated a subset of 20 samples that were enriched in EC broth directly on MacConkey agar without the IMS procedure, and testing of the pooled colonies (10 randomly picked colonies per sample) yielded only three samples positive for O103. After O157 IMS separation and agglutination confirmation of the sorbitol-negative colonies on CT-SMAC plates, 17 of the 50 samples (34%) were positive for O157 serogroup. All 17 O157 isolates possessed eae and ehxA, 15 had stx1 and stx2, and two isolates had stx2 only. The use of O26 IMS beads and testing of the pooled 10 colonies from MacConkey agar plates yielded four samples positive for O26, two samples positive for O103, and one sample positive for O45 serogroups (Table 3). Samples after O111 IMS procedure had no positive O111, but 18 of 50 (36%) fecal samples were positive for O103 and two samples were positive for O45. Only a few fecal samples (12 of 50) were positive for O26, O103, or O157 by both mPCR and IMS methods. For example, a total of 21 of 50 samples were positive for O157 based on either mPCR or IMS, and only four samples were positive by both mPCR and IMS.
Overall, 19 of 50 fecal samples were positive for one or more of the six non-O157 serogroups (13 samples had O103 only, four samples had O103 and O26, one sample had O103 and O45, and one sample had O45 only) based on testing of pooled colonies on MacConkey agar after the IMS procedure with O26 or O111 beads. Because all samples were also subjected to O157 IMS procedures, multiple serogroups were identified from the same samples (nine samples had two, and four samples had three serogroups). We tested the original single colonies that were stored in −80°C of each of the positive sample by mPCR for O-groups and virulence genes. We identified the 27 non-O157 serogroups in pure culture; however, none of the 27 strains had stx genes. One O103 strain had eae and ehxA; five O103 and one O26 strains had only ehxA. The serogrouping of the 27 non-O157 E. coli positives were confirmed by the E. coli Reference Center at Pennsylvania State University. When 10 individual colonies from each positive samples were tested, 13 isolates were identified that did not belong to the seven O-groups, but carried the virulence genes (four had eae and ehxA, two had stx1 and ehxA, four had stx2 only, two had stx1 only, and one had ehxA only). All 13 isolates were confirmed as E. coli based on the API Rapid 20E kit (bioMérieux Inc., Durham, NC). The serogroups of the 13 strains were identified, by the Pennsylvania State University E. coli Reference Center, as O171 (n=4), O104 (n=2), O71 (n=2), and one each of O8, O108, O116, O153, and O109/O119 strain.
Discussion
According to the U.S. Centers for Disease Control and Prevention, the “top six” O-groups are responsible for 74% of non-O157 STEC infections in the United States (Scallan et al., 2011). The four virulence genes code for key virulence factors in human infections with O157 and non-O157 STEC (Brooks et al., 2005; Karmali et al., 2010), and are routinely included in characterizations of STEC (Bai et al., 2010; Hu et al., 1999; Lefebvre et al., 2005; Paton and Paton, 1998). Few mPCR-based methods for detection and identification of O157 and the major non-O157 STEC have been published (DebRoy et al., 2011; Monday et al., 2007; Valadez et al., 2011). Monday et al. (2007) developed a mPCR to detect the six of the top seven (no O45) STEC. DebRoy et al. (2011) have reported on a mPCR to detect eight STEC serogroups (the seven major STEC and O113) by targeting the wzx genes of the O-antigen gene clusters and the assay was evaluated with pure cultures and with artificially inoculated apple juice, but did not target virulence genes; the applicability of the assay to detect STEC in cattle feces was not evaluated.
The primers in our study were designed to obtain 11 amplicons that formed distinct bands on agarose gels. The designed primers were specific for the seven serogroups, based on specificity assays determined with pure cultures of a number of STEC, non-STEC, and other related or unrelated Gram-negative and Gram-positive bacteria. The specificity, sensitivity, and applicability of the assay to detect the seven serogroups were also evaluated with fecal samples inoculated with the pooled mixture of the seven STEC. A minimum concentration of 6.5×10⁵ CFU/g (650 CFU/μl of sample volume in PCR reaction) was needed to detect all 11 genes. The sensitivity of the assay was improved to 6.5×10² CFU/g with the inclusion of a 6-h enrichment step in EC broth.
We evaluated the applicability of mPCR to detect the seven major serogroups of E. coli in cattle feces by comparing to that of culture-based detection methods (IMS followed by plating on CT-SMAC for O157 or MacConkey agar for the six non-O157) with a limited number of fecal samples (n=50). The culture method was used only for three (O26, O111, and O157) of the seven STEC because of our inability to procure IMS beads for O103 and O145. Beads for O45 and O121 are not yet commercially available. However, mPCR of the post-enrichment sample identified six samples positive for O45 and three samples positive for O121. The mPCR assay of the fecal samples suspended in EC broth before incubation for enrichment identified O-groups in seven of the 50 fecal samples (O26=1, O45=4, O103=1, O121=2, and O157=1), suggesting that the samples possibly contained high concentrations (>104 per g) of the O-groups of E. coli. When we plated a subset of 20 samples after enrichment, without IMS, on to MacConkey agar, only three samples yielded O-groups and all three were O103. The same 20 samples, after IMS with O26, O111, or O157 beads, yielded 12 O157 and 18 non-O157 strains (O26=4, O45=2, O103=12), which illustrates the advantage of using IMS beads. The sensitivity of the mPCR and culture-based methods in detecting the major serogroups in feces differed between O-groups. In case of O157, the IMS procedure with O157 beads identified 17 (34%) positive samples compared to eight (16%) of 50 samples by mPCR, which included nine of the 17 samples positive by IMS that were not detected by mPCR and four of the eight samples positive by mPCR that were not detected by IMS. Interestingly, only four samples were positive by both methods. In case of O111 beads, which identified O103, more samples were positive by IMS (18 of 50) compared to mPCR (eight of 50). The difference in sensitivity is not surprising because, for a PCR assay to be positive, the sample should contain at least 1,000 cells per g or mL of sample to assure that a sample volume of 1 μL in the PCR reaction contains DNA from at least one cell. However, in case of O26, mPCR identified more positives (nine of 50) compared to IMS (four of 50). Additional samples need to be evaluated before suggesting that the sensitivity of commercial O26 beads needs improvement. Interestingly, the commercial O111 beads did not yield any O111, but yielded several O103, suggesting that the beads were not specific. The PCR has the advantage in that it is amenable to rapid through-put and automation. On the other hand, the culture-based method, which is labor-intensive and expensive, yields isolates that could then be tested for the presence of virulence genes.
A total of 27 non-O157 strains (O26=4, O45=3, and O103=20) were isolated from the 19 positive fecal samples. Interestingly, none of the 27 strains carried stx genes, suggesting that cattle harbor Shiga toxin–negative E. coli belonging to the “top six” non-O157 serogroups. The other possibility is that the primers used in the PCR did not amplify the stx from the non-O157 serogroups. The latter is unlikely because the primers amplified stx genes of all the known strains (n=250) that were tested in this and in a previous study (Bai et al., 2010). Studies on the prevalence of non-O157 STEC in cattle feces, generally from countries outside the United States, have shown that many non-O157 strains do carry the stx genes (Jenkins et al., 2003; Pearce et al., 2004; Pradel et al., 2000; Renter et al., 2005). There are also reports of prevalence of non-O157 STEC in cattle that lacked stx and other major virulence genes (Barlow and Mellor, 2010; Bosilevac and Koohmaraie, 2011; Bugarel et al., 2011). A recent study of E. coli O26 strains in Germany indicated that 133 of 250 strains did not possess either stx genes, and the authors speculated that the virulent O26 strains were most likely the less virulent O26 that acquired one or both stx genes (Bugarel et al., 2011).
An obvious limitation of our mPCR is that the concurrent detection of virulence genes and the seven serogroups in a sample does not necessarily mean that the virulence genes are associated with the seven serogroups in the same sample. Therefore, when more than one O-serogroup is present in a sample, which is often the case (Barlow and Mellor, 2010; Renter et al., 2007), the assay will not be able to associate the virulence gene(s) to any particular serogroup. Also, the virulence genes in the same sample could be from a serogroup other than the seven major STEC that have been shown to carry some of the virulence genes, including stx genes and more often the eae and the ehxA. In our study, there were eight E. coli isolates from 50 fecal samples that did not belong to the top seven serogroups, but carried stx1 and/or stx2 genes. Blanco et al. (2005) also demonstrated that the eae gene is present in cattle E. coli serogroups O2, O8, O10, O15, O34, O64, O77, O113, O119, O128, O156, O177, and several ONT (O-antigen nontypeable) strains. The eae gene was also found in both stx-positive and stx-negative E. coli serogroups (Ito et al., 2007). Similarly, ehxA is found in E. coli O5, O69, O76, O84, O98, and O156 of both cattle and human origins (Boerlin et al., 1998). Using our eae and ehxA primers as queries to search the GenBank, we identified a perfect match to our primers from multiple E. coli O-groups, including those that were not within the seven major STEC serogroups (data not shown). The confirmation of the association of virulence gene(s) with a particular serogroup would require that the isolate be obtained in pure culture and then tested again by mPCR. The major application of our 11-gene mPCR assay may be in identifying serogroup and virulence genes of putative colonies of STEC that have been obtained by culture-based method.
Footnotes
Acknowledgments
We thank Taghreed Mohmood and Neil Wallace for their assistance in the laboratory. The research was supported by the U.S. Department of Agriculture (special grant 2010-34359-20714). This is Contribution No. 12-223-J from the Kansas Agricultural Experiment Station, Manhattan.
Disclosure Statement
No competing financial interests exist.