
Abstract
Johne's disease (JD) or paratuberculosis, caused by Mycobacterium avium ssp. paratuberculosis (MAP), is one of the most economically important diseases of dairy cattle. Control of JD could be achieved by good herd management practices, and diagnosis; however, this approach has been hampered by the low sensitivity of currently available enzyme-linked immunosorbent assay (ELISA) tests. In our previous study, we developed a sensitive serum ELISA test, ethanol-vortex enzyme-linked immunosorbent assay (EVELISA), using ethanol extract of MAP. The objective of this study is to demonstrate that the EVELISA can be used for detection of anti–MAP antibodies in milk samples. In this study, we tested and optimized concentrations of antigen, milk, and secondary antibody for better differentiation of milk samples of cattle with MAP infections from those of cattle in JD–free herds. We evaluated five environmental mycobacteria as absorbents of cross-reactive antibodies in milk and found that the mycobacteria had no significant effect on EVELISA results. Using the optimized conditions, a total of 57 milk samples from Holstein dairy cattle (37 animals found positive on the fecal polymerase chain reaction test and 20 animals from JD-free herds) were tested for anti-MAP antibody in milk by using the EVELISA method. The average of ELISA values in the JD-positive milk samples (mean±SD=0.355±0.455) was significantly higher than that in the JD-negative milk samples (mean±SD=0.071±0.011). These results warrant further studies for evaluation and validation of the EVELISA for milk testing of cattle for JD.
Introduction
Serum ELISA is similar to milk ELISA in terms of the testing time and cost of the assay. However, since milk samples from individual cows are routinely collected on dairy farms enrolled in the Dairy Herd Improvement Association (DHIA) testing, milk ELISA is less labor-intensive and less invasive for testing dairy cattle as compared to serum ELISA. In this study, we tested if the EVELISA method can be used to detect anti-MAP antibodies in milk samples of dairy cattle naturally infected with MAP.
Methods
Milk samples
A total of 57 serum samples used in this study were obtained from two dairy herds in Michigan. Twenty samples were from JD-negative herds (JD-negative samples) and 37 samples were from cattle tested positive for JD by a polymerase chain reaction (PCR) test (JD-positive samples). Ten JD-negative and 10 JD-positive samples were selected for optimization of ELISA conditions and the remaining samples were added for evaluation of the optimized condition. The details of the samples and grouping were described below and summarized in Table 1.
ELISA, enzyme-linked immunosorbent assay; PCR, polymerase chain reaction; N.D., no data (which represents the unavailability of data).
Group N1
A total of 10 Holstein cattle from a dairy herd in Michigan were included in this group. The herd is a level 2 status dairy herd according to the National Voluntary Johne's Program. A herd is classified as level 2 if it is negative for ELISA followed by MAP detection test and if its size is less than 100 (USDA, 2010). The animals were tested negative for JD by fecal PCR test (AntelBio, 2010) and ELISA (Parachek, PRIONICS, Schlieren-Zurich, Switzerland). The age and lactation history of the animals in this herd are not available.
Group N2
A total of 10 Holstein dairy cattle from a dairy in Michigan were included in this group. The whole herd was tested negative using the PRIONICS ELISA for two consecutive years in 2008 and 2009. The animals in this group ranged from 1–2 lactations and 2–3 years of age.
Group P1
A total of 10 Holstein dairy cattle from a dairy farm in Michigan were included in this group. The animals in this group ranged from 1–3 lactations and 4–5 years of age. They were tested positive for JD by the AntelBio (Lansing, MI) fecal PCR test. The herd level test prevalence of this herd for JD at the time of sample collection (2009) was 8.7%.
Group P2
Another set of positive samples were from the same herd of Group P1 in Michigan but consisted of a total of 27 Holstein dairy cattle that were tested positive for JD by the AntelBio fecal PCR. The animals in this group ranged from their 2nd to 7th lactation. The age of the animals in this group ranged from 3 to 9 years.
ELISA procedures
Commercial ELISA
A commercial ELISA (IDEXX Laboratories, Westbrook, ME), termed ELISA-I in this study, was carried out according to the manufacturer's instructions. The ELISA-I was approved by the U.S. Department of Agriculture for detection of anti-MAP antibodies in milk samples as well as serum samples. The milk samples were tested in duplicates for the presence of antibodies against MAP. The ratio of optical densities (ODs) of samples and positive control (S/P value) was determined, and JD status was assigned using the cut-off S/P value of 0.40, as recommended in the manufacturer's instructions.
EVELISA
The EVELISA test was conducted as described previously (Eda et al., 2006). In Figure 1A–C, different dilutions of MAP ethanol extract, milk, and secondary antibody were used to optimize the conditions, as indicated in the figure. The difference of antibody binding levels between Groups N1 and P1 were analyzed by Mann-Whitney U test. In Figure 1D, milk samples were incubated at room temperature for 30 min with heat-killed bacteria (2 mg/mL; M. phlei, M. chelonae, M. fortuitum, M. terrae, and M. flavescens, provided by Dr. P. Small, Department of Microbiology, University of Tennessee, Knoxville, TN) prior to EVELISA testing in an attempt to absorb cross-reactive antibodies in milk. For this experiment, data were log transformed, and t-test was applied to evaluate the difference of antibody binding levels between Groups N1 and P1. In Figure 2, the cut-off value was set as mean±3 SD (0.1) of the OD values obtained using the 20 negative milk samples (Groups N1 and N2).
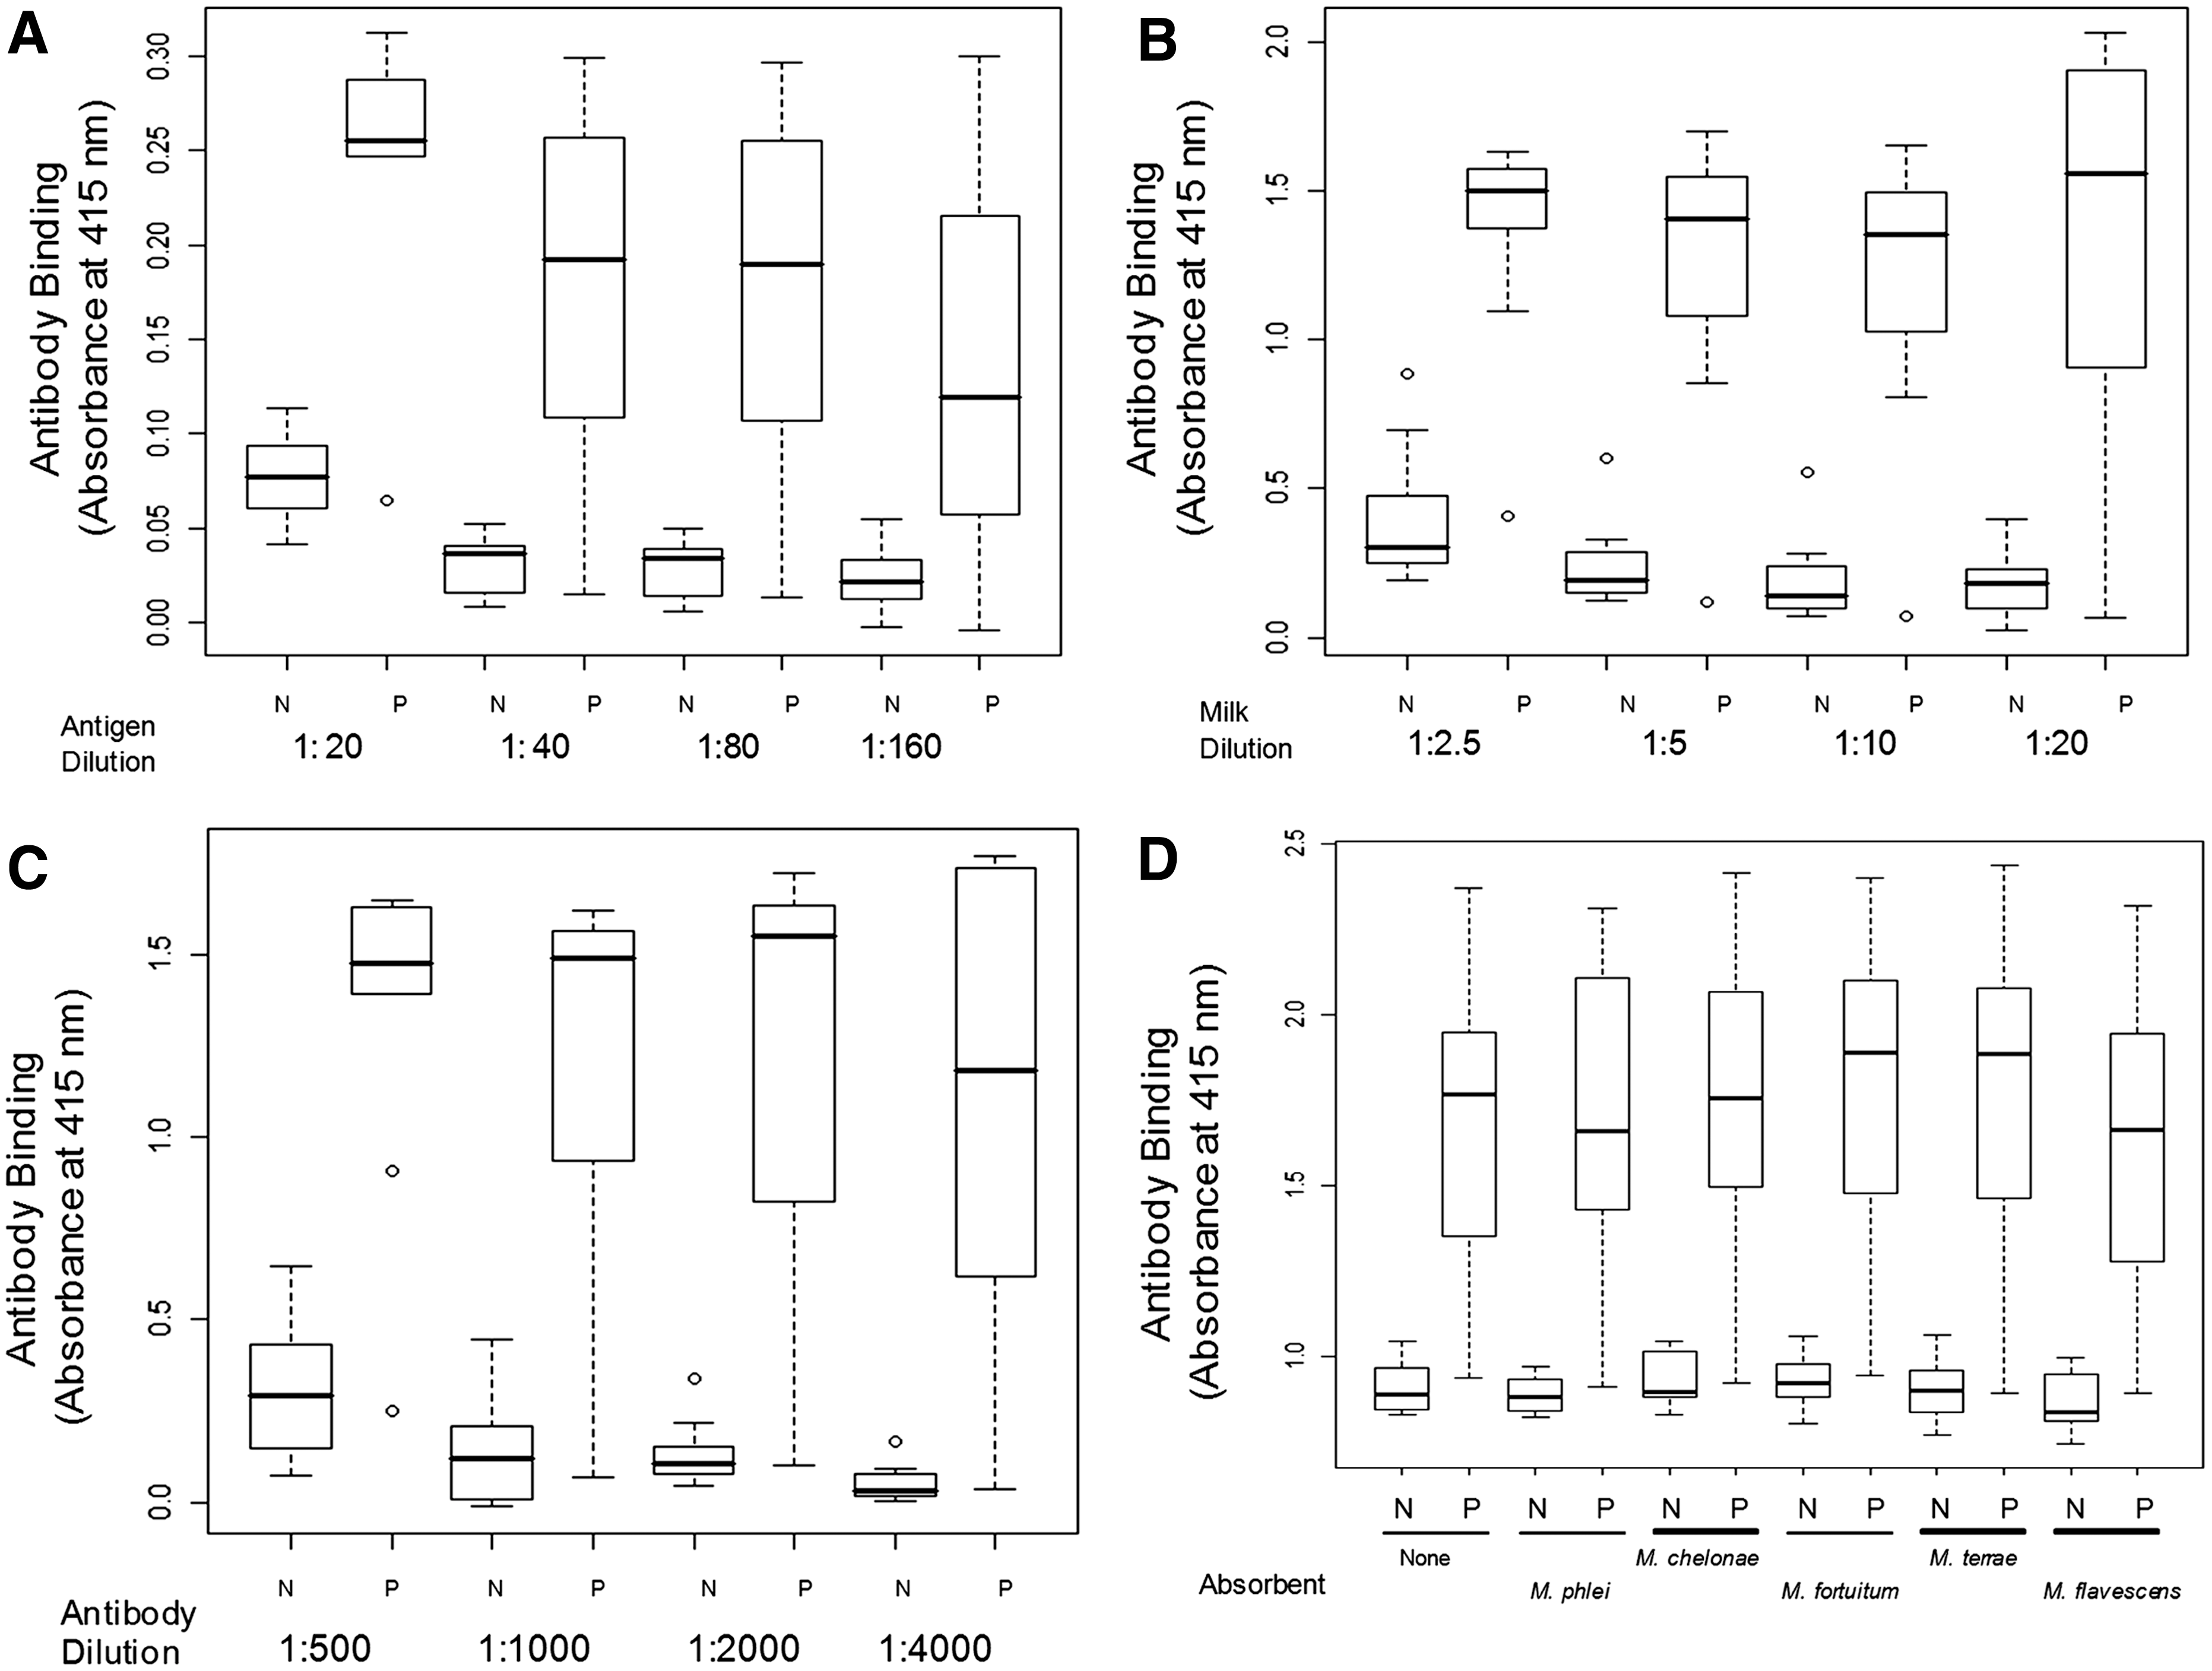
Optimization of ethanol-vortex enzyme-linked immunosorbent assay (EVELISA) conditions for milk testing. Optimization of the different conditions for the milk EVELISA test were conducted by using different dilutions of antigen
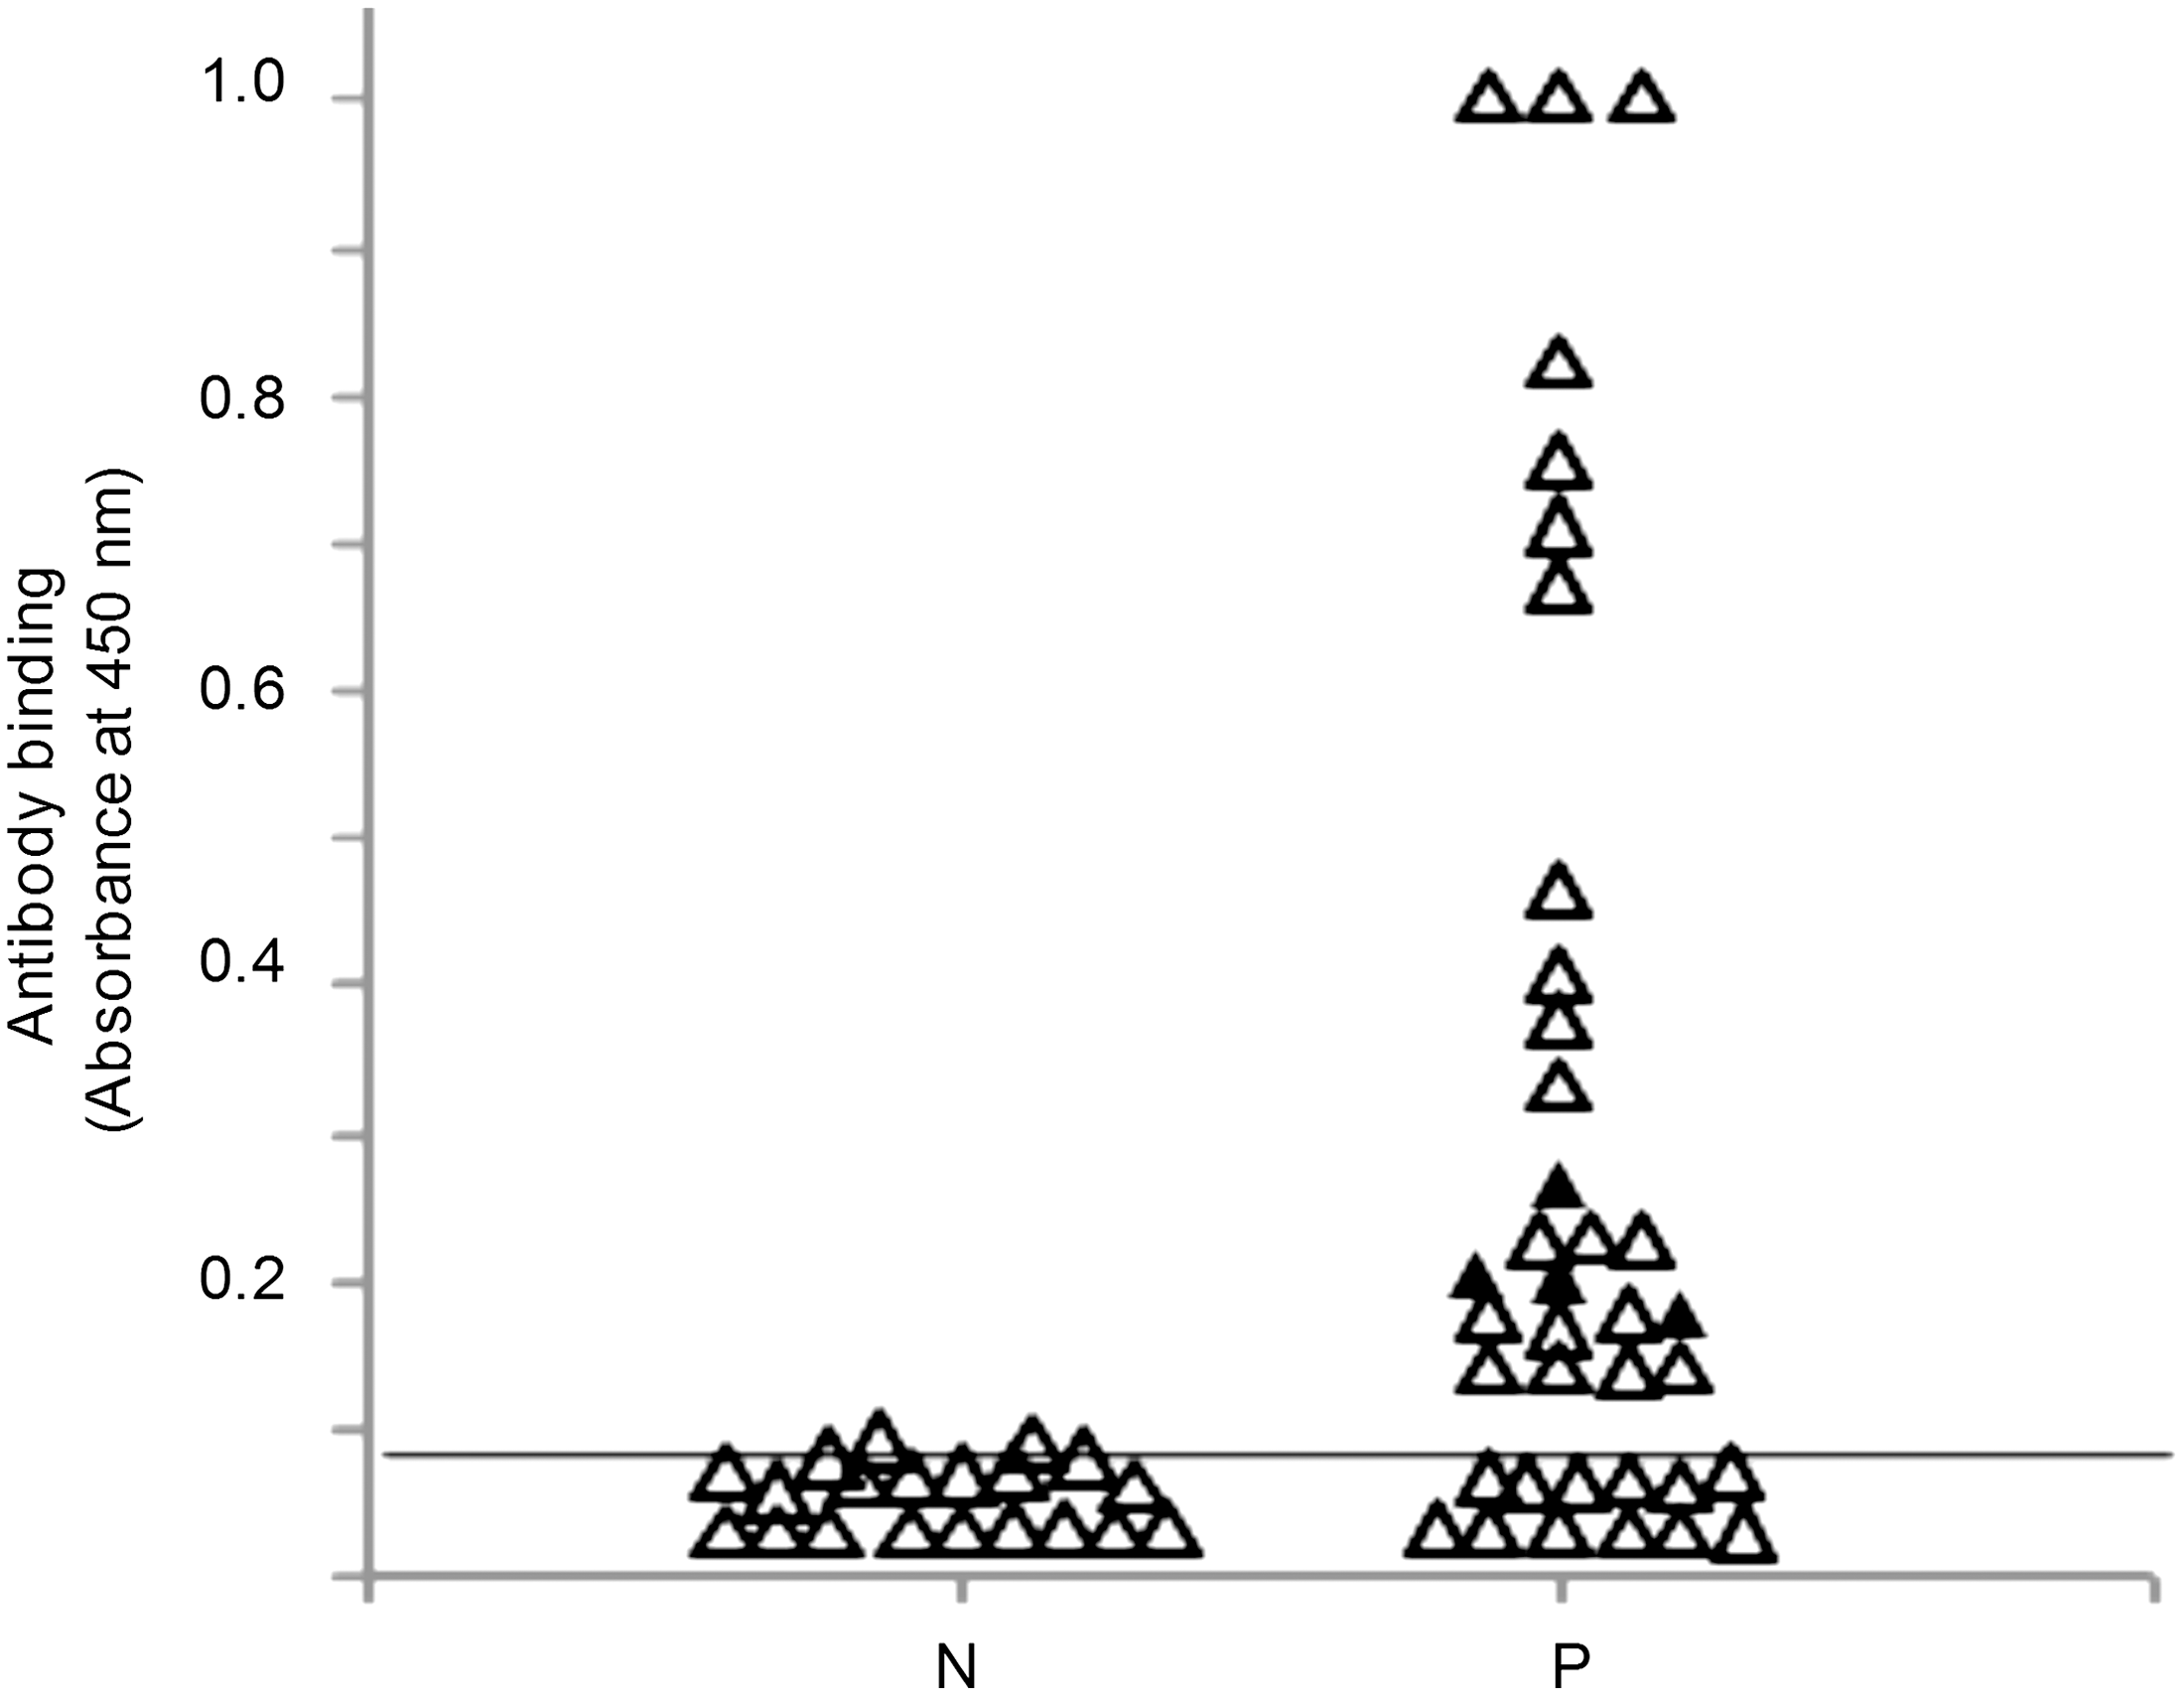
Ethanol-vortex enzyme-linked immunosorbent assay (EVELISA) results on 57 milk samples. Antibody binding in 57 milk samples in groups N1 and N2 (N) and P1 and P2 (P) were tested by using the optimized EVLISA test. The horizontal line represents a tentative cut-off value (0.105, mean±3 standard deviation of the optical density [OD] values obtained using milk samples of groups N1 and N2) for milk EVELISA test. Shaded triangles, milk samples that tested Johne's Disease (JD) positive by milk EVELISA test but not by ELISA-I. All of the samples tested negative by the EVELISA test were also tested negative by the ELISA-I. The three positive samples plotted at the OD value of 1.0 showed OD values of 1.18, 1.50, and 1.90.
PCR test
For fecal sample processing, 2 g of feces was mixed in 25 mL of 0.2N NaOH for 30 min, and coarse sediment was removed by centrifugation at 300×g for 3 min. The supernatant was harvested through two layers of cheesecloth, and MAP was concentrated into the pellet fraction by centrifugation for 30 min at 4000×g. After washing, the pellet was transferred into a microcentrifuge tube and disrupted by bead beating for 2 min with 0.5 g zirconium beads (0.1 mm) in 200 μL of PBS-1 mM EDTA. The clarified supernatant after centrifugation at 10,000×g for 10 min was diluted 1:50 in PCR-grade water prior to direct analysis by quantitative PCR (qPCR), as described below. The DNA primer and probe combination for MAP qPCR was designed by Primer Express 3 software (Life Technologies, Carlsbad, CA) for TaqMan chemistry to recognize a 65–base pair (bp) region of the repeat element IS900 in the MAP genome (MCBI accession number NC002944). The primers and probe sequences used for target amplification and detection were as follows: forward primer, GCC TTC GAC TAC AAC AAG AGC; reverse primer, GCG TCG GGA GTT TGG TAG; and probe with a FAM-based detection dye, GCC GCG CTG ATC CTG CTT ACT. Amplification efficiency during qPCR was also monitored by the inclusion of internal positive control DNA (IPC), plasmid pCR2.1-TOPO containing the human actin gene (GenBank accession number NM001101.3). The primers and probe for the amplification and detection of the 55-bp target region of human actin were as follows: forward primer, GCG CGG CTA CAG CTT CA; reverse primer, CTT AAT GTC ACG CAC GAT TTC C; and probe with a VIC-based detection dye, CAC CAC GGC CGA GC. The content of IPC used for qPCR was determined by titration and yielded cycle threshold (Ct) values of 32±1. qPCR was performed in an AB 7500 Real-time Thermocycler (Life Technologies, Carlsbad, CA) using a 25-μL reaction volume containing 5% bovine serum albumin. Specifically, each reaction contained 12.5 μL of TaqMan Universal Master Mix, 0.9 μM IS900 primers, 0.9 μM IPC primers, 0.1 μM FAM-labeled probe for IS900, 0.1 μM VIC-labeled probe for IPC, 0.125 ng of IPC plasmid DNA, and 9 μL of diluted sample extract or controls. The qPCR reaction conditions were as follows: 1 cycle of 95°C for 10 min; and 40 cycles of 95°C for 15 s and 60°C for 1 min. In addition to the IPC, each test panel included positive (MAP-derived DNA) and negative controls in PCR-grade water. Samples with Ct values of <36 are considered positive for the presence of MAP.
Statistical analysis
All experiments were conducted in duplicate or triplicate, and repeated at least twice. The statistical difference of antibody binding among various sets of conditions and between Group N1 and Group P1 were evaluated by using Mann-Whitney U test, due to lack of normality in the distribution of the data (calculated by the Shapiro-Wilk normality test). The statistical analysis and depiction of box plots were conducted by using statistical software, R (R Foundation for Statistical Computing; available at
Results
Optimization of antigen dilutions
Antibody binding was evaluated in EVELISA test with different antigen dilutions (approximately 1:20 to 1:160). In this experiment, two groups of milk samples, Groups N1 (n=10) and P1 (n=10), were tested using a 1:5 dilution for milk samples and a 1:1,000 dilution for secondary antibody. The difference between antibody binding in the two groups was greatest (p<0.001, Mann-Whitney U test) at the 1:20 antigen dilution (Fig. 1A). For 1:20 antigen dilution, the average OD values for JD-positive and JD-negative milk samples were 0.249±0.068 and 0.078±0.024 (mean±SD), respectively. Based on this result, the 1:20 dilution of ethanol-extracted antigen was used in the following experiments.
Optimization of milk dilutions
Milk samples of Groups N1 and P1 were tested for antibody binding in the EVELISA test using different dilutions (approximately 1:2.5 to 1:20) and a secondary antibody dilution of 1:1,000. The greatest difference (p<0.0001, Mann-Whitney U test) was observed at the milk dilution of 1:2.5 (Fig. 1B); however, levels of antibody binding in JD-negative samples (Group N1) were higher than other dilutions. Therefore, the milk dilution of 1:10 (p<0.001, Mann-Whitney U test) was selected for the following experiments.
Optimization of secondary antibody dilutions
Using the antigen dilution of 1:20 and milk dilution of 1:10, antibody binding was evaluated using different secondary antibody dilutions(approximately 1:500 to 1:4000). The difference between antibody binding in the Group N1 and Group P1 was greatest (p<0.001, Mann-Whitney U test) at a 1:500 dilution of secondary antibody (Fig. 1C), and this dilution was used in the following experiment.
Comparison of different mycobacteria as absorbent
Antibody binding to MAP antigen was evaluated in EVELISA test using different mycobacteria species as absorbent of cross-reactive antibodies (Fig. 1D). There was no significant difference between antibody binding in the Group N1 and Group P1 using unpaired t-test.
Evaluation of the EVELISA for milk testing
JD-negative milk samples (Groups N1 and N2) and JD-positive milk samples (Groups P1 and P2) were tested by the EVELISA using the optimized dilutions of antigen, milk, and secondary antibody. Out of the 37 milk samples, 25 samples showed higher levels of antibody binding than the tentative cut-off value determined using results of Groups N1 and N2 samples (Fig. 2). In the same sample set, 21 samples in Groups P1 and P2 were tested positive for JD by using a commercial ELISA test, ELISA-I.
Discussion
Previous studies on developing milk ELISA for JD have used protoplasmic antigen (PPA) (Collins et al., 2005; Hendrick et al., 2005; Klausen et al., 2003; Sharma et al., 2008; Singh et al., 2007; Wells et al., 2006), lipoarabinomannan (LAM) (Sweeney et al., 1994), and culture filtrate of MAP (Shin et al., 2008) for testing antibodies in the milk of animals. PPA is a crude antigen mixture prepared by thorough physical disruption of mycobacterial bacilli followed by removal of cell debris (Beam et al., 1969), and therefore, it is likely that PPA contains proteins that are common or very similar in the closely related mycobacteria species. LAM is one of the components of the cell wall of mycobacteria species (Sugden et al., 1997), and its core structure is shared among mycobacterial species (Mishra et al., 2011). Sweeney et al. (1994) tested a LAM-based ELISA to detect antibodies in milk and serum for JD diagnosis and found that sensitivity and specificity of the ELISA were similar regardless of the tested samples (i.e., milk and serum). McKenna et al. (2005) reported that sensitivity and specificity of PPA-based ELISA were higher than that for LAM-ELISA (McKenna et al., 2005). Because PPA and LAM contains structures common in mycobacterial species, use of these molecules as diagnostic antigen can cause false-positive reactions in animals infected with environmental mycobacteria other than MAP (Osterstock et al., 2007). In a recent study, Shin et al. (2008) developed a new ELISA by using culture filtrate of a MAP strain, JTC. JTC-ELISA showed significantly higher sensitivity than that of commercial ELISA tests and performed effectively on both serum and milk samples. In this study, we used ethanol extract of MAP in the EVELISA for milk testing. The ethanol extract was prepared by gently mixing bacteria in an ethanol solution for a short time period; it is likely that major components are surface antigens. We previously showed that the ethanol extract reacted specifically with serum samples of MAP-infected calves but not with those of calves infected with other species of mycobacteria (Eda et al., 2006). In the ethanol extract, MAP-specific lipidic molecules were detected by thin-layer chromatography (data not shown). Thus, the high sensitivity of the EVELISA test may be due to the reduction of non-specific antibody binding.
Previous studies have used different dilutions of milk for ELISA: 1:20 (Shin et al., 2008), 1:10 (Sweeney et al., 1994), and 1:2 (Klausen et al., 2003; Nielsen et al., 2002; van Weering et al., 2007). Singh et al. (2007) and Sharma et al. (2008) used whey for testing antibodies against MAP at a dilution of 1:10 and 1:8, respectively. For the EVELISA, a 1:10 dilution of milk was found to be optimal for differentiation between JD-positive and JD-negative milk samples. Thus, the dilutions used in the previous studies were similar to the dilution optimized in the current study despite the difference of the antigens used in the ELISAs. The secondary antibody in most of the studies were diluted in the range of 1:500 to 1:4000 (Collins et al., 2005; Hendrick et al., 2005; Huda et al., 2004; Klausen et al., 2003; Nielsen et al., 2002; Sharma et al., 2008; Shin et al., 2008; Singh et al., 2007; Sweeney et al., 1994; van Weering et al., 2007). These dilutions are compatible with the dilution optimized in this study (1:500).
In the previous studies on milk ELISA tests for JD, milk samples were preabsorbed with environmental mycobacteria (M. phlei) at different dilutions before performing the assay to prevent cross-reaction of non-specific antibodies (Klausen et al., 2003; Nielsen et al., 2002; van Weering et al., 2007). In a recent study, preabsorption of serum samples improved the specificity of the EVELISA when serum samples were tested (Scott et al., 2010). However, in the current study with milk samples, there was no effect of preabsorption on differentiation of JD-positive and JD-negative milk samples. The reason for this difference in serum and milk EVELISA is not known, but it is possible that there was no (or only a low level of) infection of cattle with environmental mycobacteria in the dairy farms where milk samples were collected for this study.
There were several previous studies evaluating diagnostic performance of milk ELISA for JD (Collins et al., 2005; Hendrick et al., 2005; Sharma et al., 2008; Shin et al., 2008; Singh et al., 2007; Sweeney et al., 1994; van Weering et al., 2007; Wells et al., 2006). The sensitivity and specificity of milk ELISA in previous studies were 26–76.9% and 99–100%, respectively. For example, Hendrick et al. (2005) and Collins et al. (2005) reported sensitivities of only 40% and 28.6%, respectively. Wells et al. (2006) reported a sensitivity of only 26% for their milk ELISA test. In this study, we tested a total of 57 milk samples (37 positive, 20 negative). Out of the 37 positive samples, 25 samples were found positive by the EVELISA test compared to 21 samples testing positive by ELISA-I. However, the number of samples in this study is not enough to compare diagnostic accuracy of the ELISA-I and EVELISA tests.
Conclusion
Previous reports suggested that MAP exists in food materials and may be a cause of human diseases. JD control is, therefore, important for prevention of the potential foodborne diseases. Since milk can be obtained cost-effectively and non-invasively, a sensitive milk ELISA would facilitate JD control in dairy farms. Our data demonstrated that optimized EVELISA test could detect antibodies in JD-positive milk samples and differentiated a majority of JD-positive samples from JD-negative samples. This work warrants further studies to examine if a sensitive milk ELISA test for JD diagnosis can be developed based on the EVELISA optimized for milk testing.
Footnotes
Acknowledgments
The work was supported by the following grants to S.E.: USDA/NRI 2007-3504-1862, Johne's Disease Integrated Program JDIP 2008-55620-18710, and AgResearch Extension Innovation Fund of the University of Tennessee Institute of Agriculture.
Disclosure Statement
No competing financial interests exist.